. 2023 Sep;82(9):1227-1239.
doi: 10.1136/ard-2023-224002. Epub 2023 Jun 21.

Metabolic rewiring controlled by c-Fos governs cartilage integrity in osteoarthritis

Affiliations

Metabolic rewiring controlled by c-Fos governs cartilage integrity in osteoarthritis

Kazuhiko Matsuoka et al. Ann Rheum Dis. 2023 Sep.

Abstract

Objectives: The activator protein-1 (AP-1) transcription factor component c-Fos regulates chondrocyte proliferation and differentiation, but its involvement in osteoarthritis (OA) has not been functionally assessed.

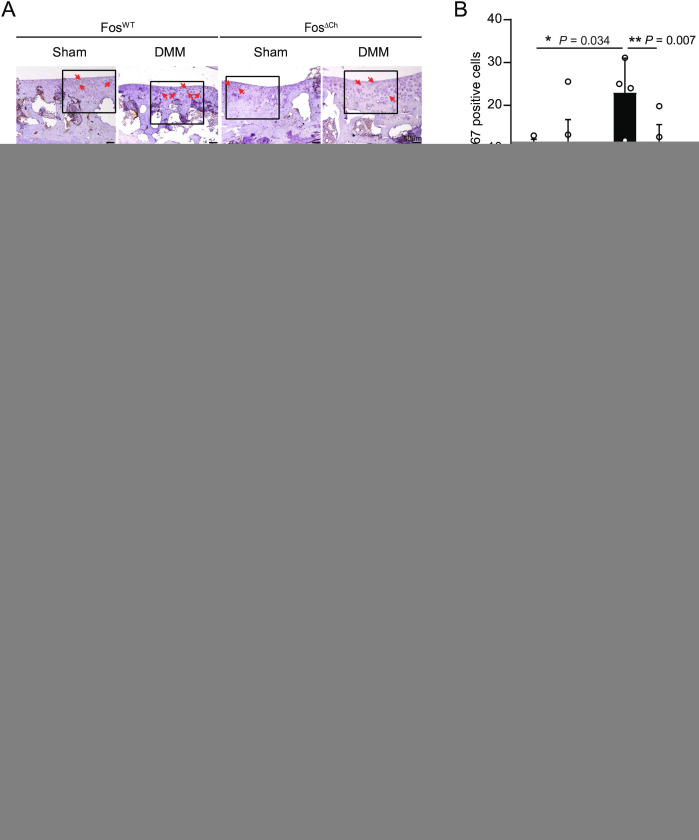
Methods: c-Fos expression was evaluated by immunohistochemistry on articular cartilage sections from patients with OA and mice subjected to the destabilisation of the medial meniscus (DMM) model of OA. Cartilage-specific c-Fos knockout (c-FosΔCh) mice were generated by crossing c-fosfl/fl to Col2a1-CreERT mice. Articular cartilage was evaluated by histology, immunohistochemistry, RNA sequencing (RNA-seq), quantitative reverse transcription PCR (qRT-PCR) and in situ metabolic enzyme assays. The effect of dichloroacetic acid (DCA), an inhibitor of pyruvate dehydrogenase kinase (Pdk), was assessed in c-FosΔCh mice subjected to DMM.

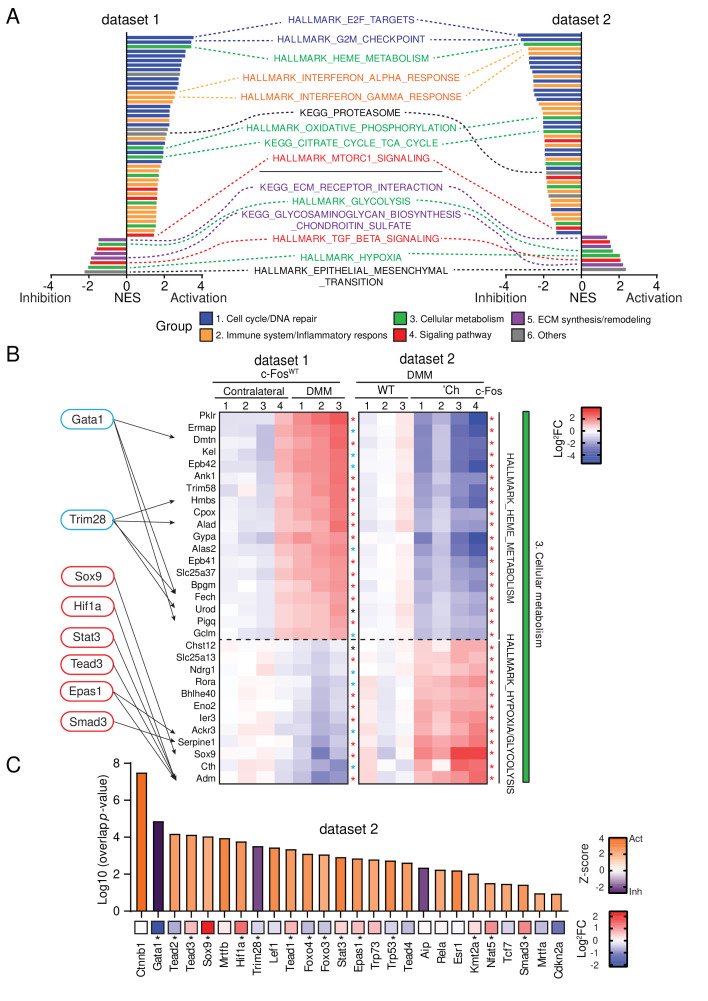
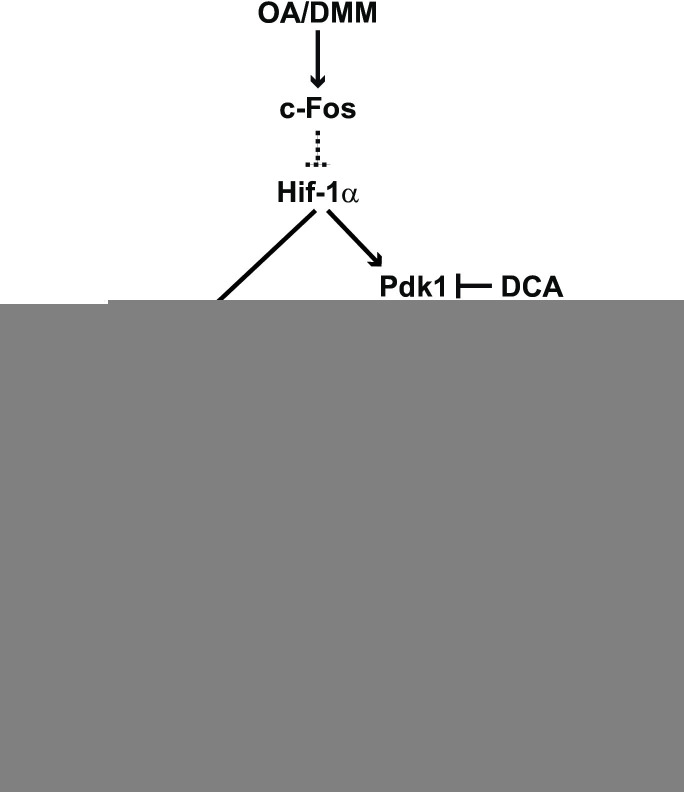
Results: FOS-positive chondrocytes were increased in human and murine OA cartilage during disease progression. Compared with c-FosWT mice, c-FosΔCh mice exhibited exacerbated DMM-induced cartilage destruction. Chondrocytes lacking c-Fos proliferate less, have shorter collagen fibres and reduced cartilage matrix. Comparative RNA-seq revealed a prominent anaerobic glycolysis gene expression signature. Consistently decreased pyruvate dehydrogenase (Pdh) and elevated lactate dehydrogenase (Ldh) enzymatic activities were measured in situ, which are likely due to higher expression of hypoxia-inducible factor-1α, Ldha, and Pdk1 in chondrocytes. In vivo treatment of c-FosΔCh mice with DCA restored Pdh/Ldh activity, chondrocyte proliferation, collagen biosynthesis and decreased cartilage damage after DMM, thereby reverting the deleterious effects of c-Fos inactivation.

Conclusions: c-Fos modulates cellular bioenergetics in chondrocytes by balancing pyruvate flux between anaerobic glycolysis and the tricarboxylic acid cycle in response to OA signals. We identify a novel metabolic adaptation of chondrocytes controlled by c-Fos-containing AP-1 dimers that could be therapeutically relevant.

Keywords: Arthritis, Experimental; Chondrocytes; Osteoarthritis.


Conflict of interest statement

Competing interests: None declared.

Figures

Figure 1
Figure 1
c-Fos is activated in articular chondrocytes in patients with OA and a mouse OA. (A and B) Femoral condyles of 20 patients undergoing knee arthroplasty were collected and histopathologically graded using the Mankin score (MS; 0: most intact; 14: most degenerated). From each patient, tissue regions with MS 0–5 and MS 8–14 were selected and histological sections were stained immunohistochemically (IHC) with antibodies against c-Fos. (A) IHC images of c-Fos in representative cartilage regions with MS 4 (left) and MS 9 (right). (B) Quantification of c-Fos-positive in MS 0–5 and MS 8–14 regions. The dotted lines connect the sample pairs from each patient. Statistical differences between groups were analysed by Mann-Whitney test. (C and D) 10 weeks-old wild-type mice were subjected to DMM (n=7)/sham (n=4) and cartilage damage was evaluated by Osteoarthritis Research Society International (OARSI) system 2 and 8 weeks post surgery. Red and black indicate c-Fos positive and negative cells, respectively. (C) Representative images of safranin O/fast green staining of the joint. (D) Quantification of cartilage damage. Black arrows indicate the damaged area. Statistical differences between groups were analysed by Mann-Whitney test. (E) Representative IHC images of c-Fos at 2 and 8 weeks post surgery. (F) Quantification of c-Fos positive cells. Red arrows indicate positive cells. Bar graphs and plots represent or include mean±SD, respectively. *p<0.05, **p<0.01, ***p<0.001, ***p<0.0001. Statistical differences between groups were analysed by non-parametric Mann-Whitney test in B and by two-way ANOVA with Bonferroni post hoc analysis in D and F. ANOVA, analysis of variance; DMM, destabilisation of the medial meniscus; OA, osteoarthritis; OARSI, Osteoarthritis Research Society International.
Figure 2
Figure 2
c-Fos protects knee cartilage in experimental OA. (A) Targeting strategy and structure of the floxed/deleted c-Fos allele. Cre expression results in deletion of exons 2–4 and expression of nuclear EGFP under the control of the c-fos promoter. Coding areas (exon 1–4) are depicted in grey boxes. Experimental procedure and timeline to delete c-fos in chondrocytes and experimentally induced cartilage damage (DMM). Tamoxifen was injected intraperitoneally at two time points (2.5 and 9 weeks of age, 2 mg/mouse/day, 5 consecutive days) and mice were subjected to DMM/sham at 10 weeks of age and knee joints analysed 8 weeks post surgery. (B) Analysis of c-Fos deletion by anti-GFP immunofluorescence (red) in c-FosWT and c-FosΔCh mice articular cartilage at 10 weeks of age. The left panels are representative images of GFP-positive articular chondrocytes before surgery. (nuclei counterstained with DAPI) while % GFP-positive articular chondrocytes are plotted on the right. Articular cartilage is depicted with white dashed lines. (C) Representative images of safranin O/fast green staining of knee joints from c-FosWT mice and c-FosΔCh mice 8 weeks post surgery. (D) Quantification of cartilage damage on the medial side. (E) Relative cartilage area quantified by ImageJ analysis. Bar graphs and plots represent or include mean±SD, respectively. *p<0.05, **p<0.01, and ***p<0.001. Statistical differences between groups were analysed by non-parametric Mann-Whitney test in B and by two-way ANOVA with Bonferroni post hoc analysis in D and E. ANOVA, analysis of variance; DAPI, 4′,6-diamidino-2-phenylindole; DMM, destabilisation of the medial meniscus; EGFP, enhanced green fluorescent protein; OA, osteoarthritis; OARSI, Osteoarthritis Research Society International; TAM, Tamoxifen.
Figure 3
Figure 3
c-Fos affects chondrocyte proliferation and collagen organisation during cartilage damage progression. (A) Representative images of Ki67 and (B) quantification of Ki67-positive cells. (C) Chondrocyte density in articular cartilage from c-FosWT mice and c-FosΔCh mice at 8 weeks post surgery. (D) Representative images of picrosirius red staining of knee joints from c-FosWT mice and c-FosΔCh mice 8 weeks post surgery. Pictures are taken under the polarised light. (E) Quantification of collagen area in articular cartilage based on picrosirius red staining. (F) Quantification of collagen fibre length. Picrosirius red staining images were analysed using CurveAlign. (G) IF of collagen type 2 (green) in articular cartilage from c-FosWT mice and c-FosΔCh mice 8 weeks post surgery. Col2 positive areas are indicated by white arrows. (H) Quantification of Col2-positive area. Bar graphs and plots represent or include mean±SD, respectively. *p<0.05, **p<0.01, and ***p<0.001. In all panels, statistical differences between groups were analysed by two-way ANOVA with Bonferroni post hoc analysis. ANOVA, analysis of variance; DMM, destabilisation of the medial meniscus; IF, immunofluorescence
Figure 4
Figure 4
c-Fos transcriptionally controls cellular metabolic pathways. Bulk RNA-sequencing of articular cartilage from DMM-treated mice. (A) GSEA analysis indicating common core biological pathways either enriched or downregulated between data set 1 (c-FosWT mice: DMM-treated vs contralateral articular cartilage) and data set 2 (DMM-treated articular cartilage: c-FosWT vs c-FosΔCh mice). NES, normalised enrichment score. Contralateral c-FosWT, n=4, DMM c-FosWT, n=3. DMM c-FosΔCh, n=4. (B) Log2FC-based relative mRNA expression heat map of top-ranked factors enriched in the cellular metabolism (group 3) in figure 4C and online supplemental figure 4A (green) and IPA-predicted transcription factors (TFs) downstream of c-Fos in the DMM-treated side. Target genes of TFs detected by IPA are indicated with arrows. Asterisk indicates p<0.05 (black), p<0.01 (blue) and p<0.001 (red). (C) IPA-predicted upstream TFs from DMM-treated c-FosΔCh vs c-FosWT mice, showing activation Z-score (bars) and Log2FC (asterisk indicates p value<0.05). Statistical evaluation of RNA-seq data was performed as indicated in the methods. DMM, destabilisation of the medial meniscus; GSEA, gene set enrichment analysis; IPA, Ingenuity Pathway Analysis; RNA-seq, RNA sequencing; WT, wild-type.
Figure 5
Figure 5
c-Fos maintains pyruvate dehydrogenase activity in experimental OA. (A) Relative mRNA expression heat map of factors in glycolysis, PDH-PDK pathway and TCA cycle based on Log2FC in the DMM-treated side compared with those from the contralateral side in c-FosWT mice. Asterisk indicates p<0.05 (black), p<0.01 (blue) and p<0.001 (red). (B) Representative images of Pdk1 and (C) quantification of positive cells. (D) Representative images of HIF-1α and (E) quantification of positive cells. Red arrows indicate positive cells. (F and G) In situ enzyme activity assay by formazan formation for Ldh (F) and Pdh (G). Bar graphs and plots represent or include mean±SD. *p<0.05, **p<0.01 and ***p<0.001. In all panels, statistical differences between groups were analysed by two-way ANOVA with Bonferroni post hoc analysis. ANOVA, analysis of variance; DMM, destabilisation of the medial meniscus; Ldh, lactate dehydrogenase; OA, osteoarthritis; PDH, pyruvate dehydrogenase; PDK, pyruvate dehydrogenase kinase; TCA, tricarboxylic acid; WT, wild-type.
Figure 6
Figure 6
DCA treatment reduces DMM-induced cartilage damage in c-Fos deficient mice. (A) Experimental procedure. Tamoxifen was injected into mice at two time points (2.5 and 9 weeks of age, 2 mg/mouse/day, 5 consecutive days). Mice were subjected to DMM/sham at 10 weeks of age and treated with DCA from 11 weeks of age for 7 weeks. Knee joints were analysed 8 weeks post surgery. (B) Representative images of safranin O/fast green staining of knee joints from c-FosWT mice and c-FosΔCh mice treated with or without DCA 8 weeks post DMM. (C) Quantification of cartilage damage. (D) Chondrocyte density in articular cartilage from c-FosWT mice and c-FosΔCh mice 8 weeks post surgery. (E) Quantification of Ki67 positive cells. (F) Quantification of collagen area based on picrosirius red staining in the articular cartilage. (G) Quantification of collagen fibre length. The images of collagen fibre from picrosirius red staining were analysed by CurveAlign. (H) Quantification of IF images of collagen type 2 positive area. Bar graphs and plots represent or include mean±SD. *p<0.05, **p<0.01 and ***p<0.001. In all panels, statistical differences between groups were analysed by two-way ANOVA with Bonferroni post hoc analysis. ANOVA, analysis of variance; DCA, dichloroacetic acid; DMM, destabilisation of the medial meniscus; IF, immunofluorescence; TAM, Tamoxifen; WT, wild-type.
Figure 7
Figure 7
Scheme depicting chondrocyte pyruvate usage pathways modulated by c-Fos/AP-1 in experimental OA. In early OA, the Hif-1α/Pdk1/Pdh and/or Hif-1α/Ldh pathways are suppressed by c-Fos, and pyruvate—acetyl-CoA conversion is predominant, leading to increased TCA cycle/OXPHOS and decreased lactate production. In chondrocytes subjected to DMM, c-Fos/AP-1 modulates pyruvate metabolism through Hif-1α/Pdk1/Pdh and/or Hif-1α/Ldh, thereby controlling cell proliferation and collagen biosynthesis, improving cartilage integrity and counteracting OA progression. The dotted lines between c-Fos and Hif-1α, two nuclear proteins forming heterodimeric transcription factors, indicate yet-to-be-defined pathways, such as the Tgfβ/Smad/Bmp and mTORC1, which are more likely than a direct transcriptional regulation. In Fos-deficient cells, chondrocytes execute these events in the opposite manner, whereby c-Fos-induced protection is lost and the energy deficit leads to decreased proliferation, collagen synthesis and increased OA. Elevated Pdk and Ldh activity can be therapeutically targeted in Fos-deficient cells using DCA to promote TCA cycle/OXPHOS and suppress glycolysis, rescuing the above-mentioned defects in proliferation and cartilage integrity. DCA, dichloroacetic acid; DMM, destabilisation of the medial meniscus; Ldh, lactate dehydrogenase; OA, osteoarthritis; OXPHOS, oxidative phosphorylation; Pdh, pyruvate dehydrogenase; Pdk, pyruvate dehydrogenase kinase; TCA, tricarboxylic acid.

References

    1. Charlier E, Deroyer C, Ciregia F, et al. . Chondrocyte Dedifferentiation and osteoarthritis (OA). Biochemical Pharmacology 2019;165:49–65. 10.1016/j.bcp.2019.02.036 - DOI - PubMed
    1. Martel-Pelletier J, Barr AJ, Cicuttini FM, et al. . Osteoarthritis. Nat Rev Dis Primers 2016;2:16072. 10.1038/nrdp.2016.72 - DOI - PubMed
    1. Ayral X, Pickering EH, Woodworth TG, et al. . Synovitis: A potential predictive factor of structural progression of medial Tibiofemoral knee osteoarthritis - results of a 1 year longitudinal Arthroscopic study in 422 patients. Osteoarthritis and Cartilage 2005;13:361–7. 10.1016/j.joca.2005.01.005 - DOI - PubMed
    1. Sellam J, Berenbaum F. The role of Synovitis in pathophysiology and clinical symptoms of osteoarthritis. Nat Rev Rheumatol 2010;6:625–35. 10.1038/nrrheum.2010.159 - DOI - PubMed
    1. Berenbaum F, Griffin TM, Liu-Bryan R. Review: metabolic regulation of inflammation in osteoarthritis. Arthritis Rheumatol 2017;69:9–21. 10.1002/art.39842 - DOI - PMC - PubMed

Publication types