. 2023 Jun 21;14(1):3675.
doi: 10.1038/s41467-023-39173-2.

Selective oxidative protection leads to tissue topological changes orchestrated by macrophage during ulcerative colitis

Affiliations

Selective oxidative protection leads to tissue topological changes orchestrated by macrophage during ulcerative colitis

Juan Du et al. Nat Commun. .

Abstract

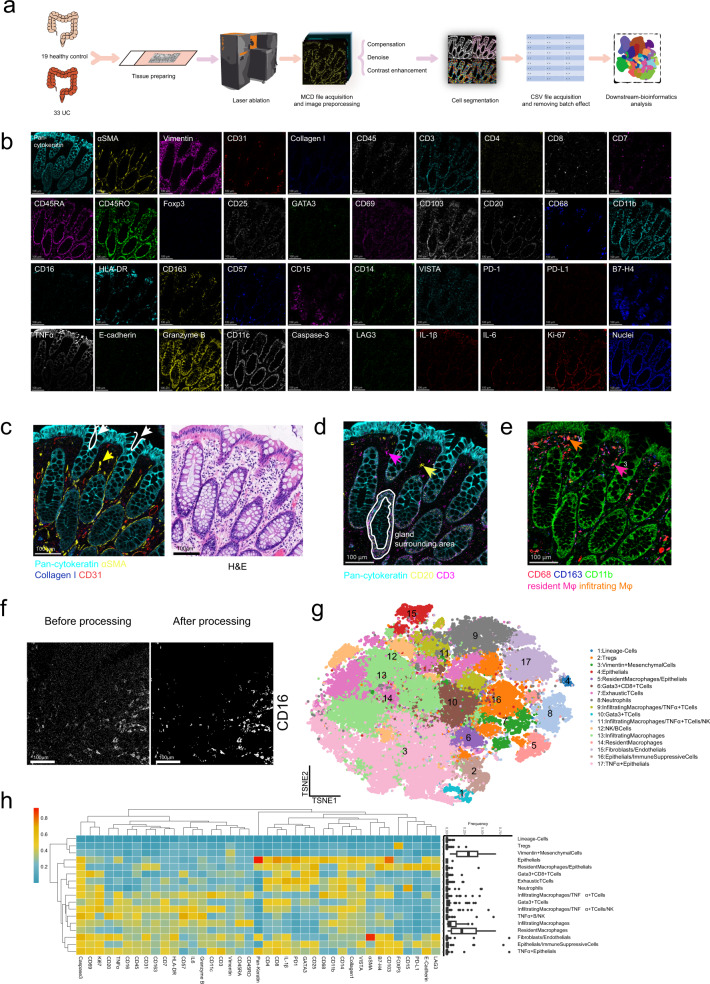
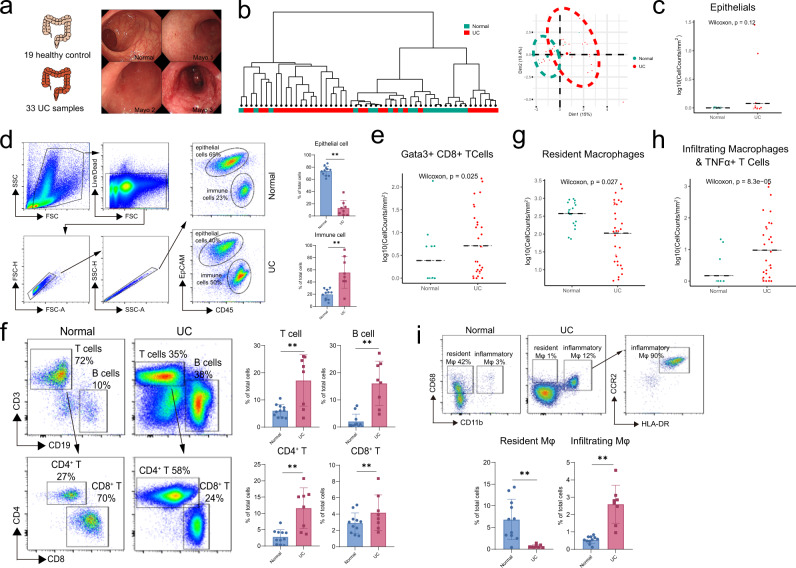
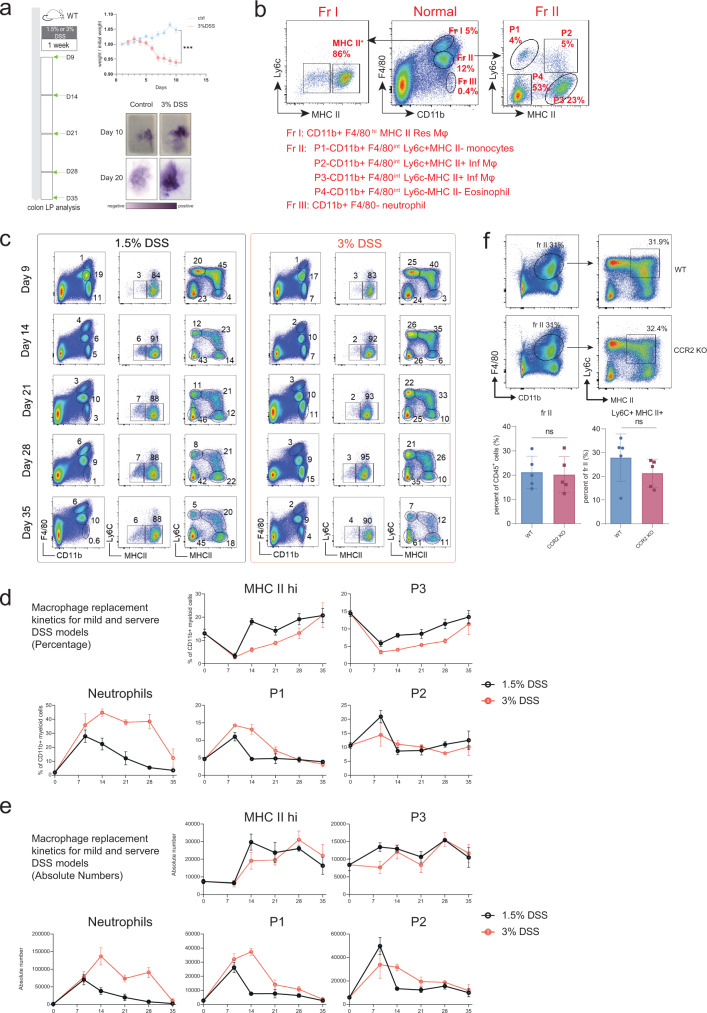
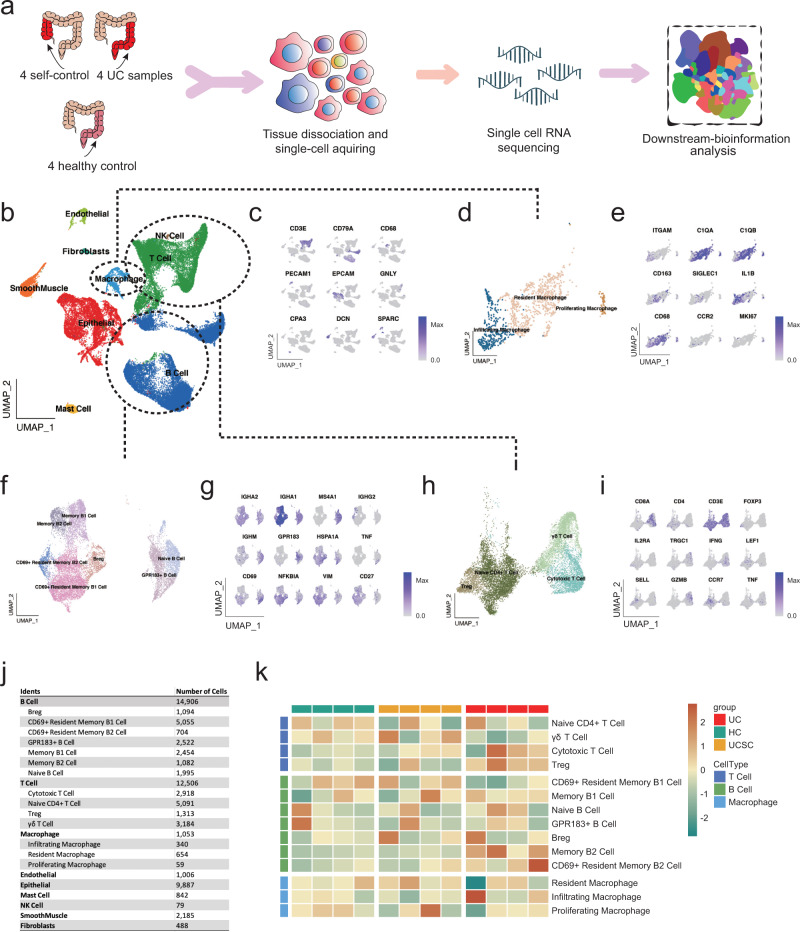
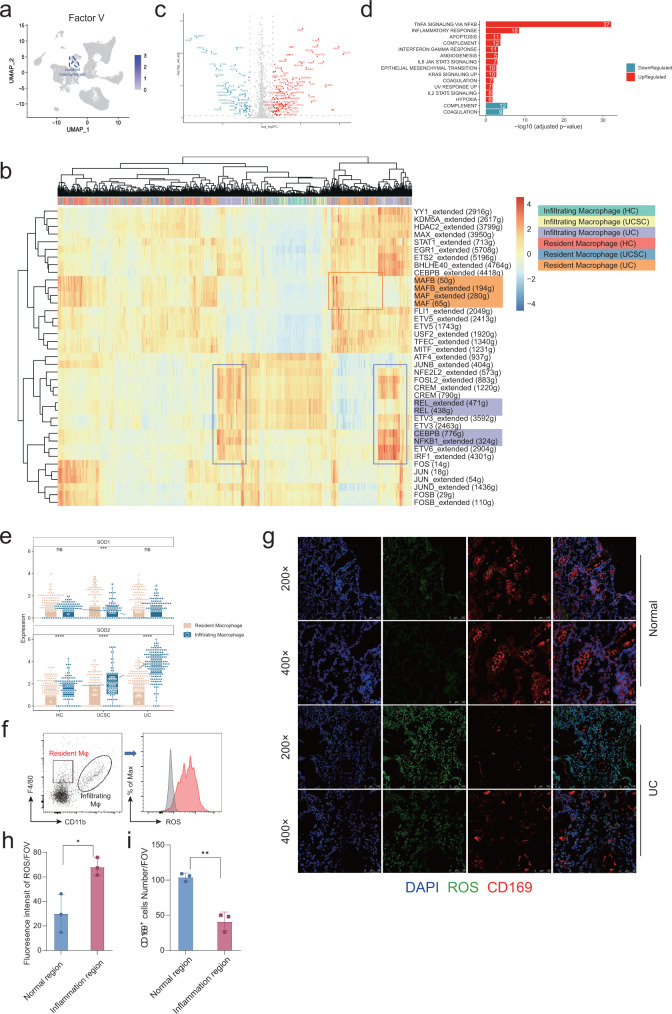
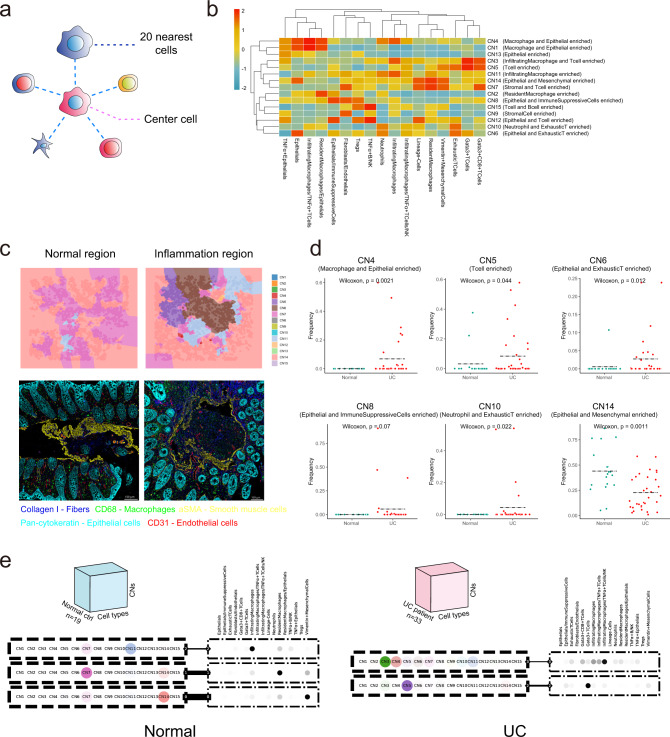
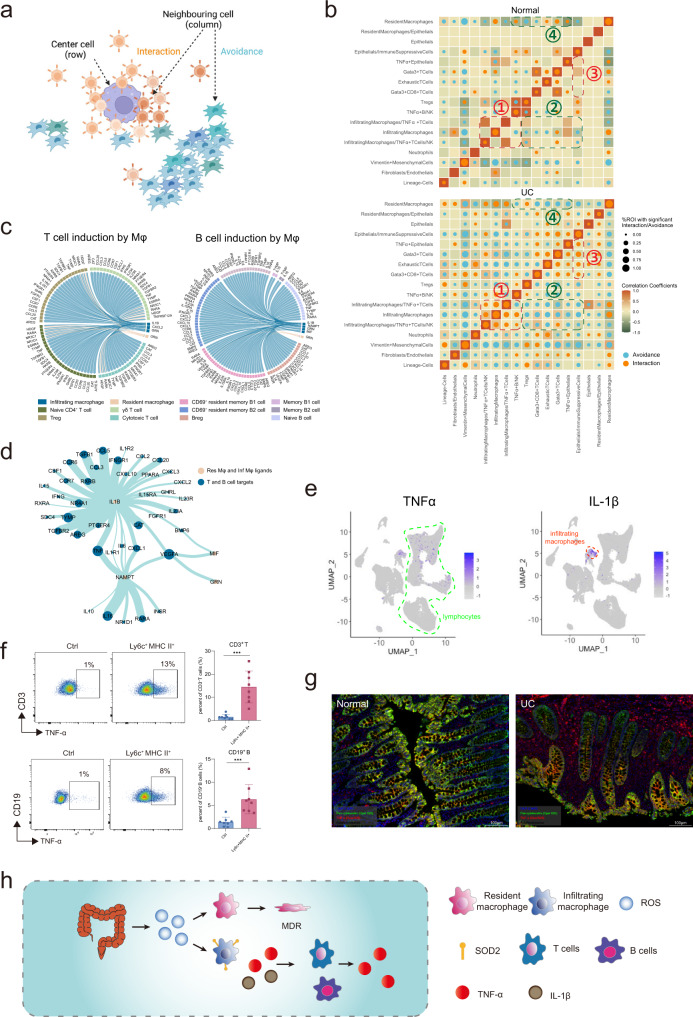
Ulcerative colitis is a chronic inflammatory bowel disorder with cellular heterogeneity. To understand the composition and spatial changes of the ulcerative colitis ecosystem, here we use imaging mass cytometry and single-cell RNA sequencing to depict the single-cell landscape of the human colon ecosystem. We find tissue topological changes featured with macrophage disappearance reaction in the ulcerative colitis region, occurring only for tissue-resident macrophages. Reactive oxygen species levels are higher in the ulcerative colitis region, but reactive oxygen species scavenging enzyme SOD2 is barely detected in resident macrophages, resulting in distinct reactive oxygen species vulnerability for inflammatory macrophages and resident macrophages. Inflammatory macrophages replace resident macrophages and cause a spatial shift of TNF production during ulcerative colitis via a cytokine production network formed with T and B cells. Our study suggests components of a mechanism for the observed macrophage disappearance reaction of resident macrophages, providing mechanistic hints for macrophage disappearance reaction in other inflammation or infection situations.


Conflict of interest statement

The authors declare no competing interests.

Figures

Fig. 1
Fig. 1. Imaging mass cytometry pipeline based on the 40-marker panel.
a The workflow of IMC. Patients’ UC and healthy donors’ samples were acquired by IMC. IMC images went through preprocessing before cell segmentation, followed by batch effect removing and downstream bioinformatics analysis. b Single color staining of the indicated marker above each plot. Representative plot from 52 samples (2 independent experiments). c Pan-cytokeratin (cyan), αSMA (yellow), Collagen I (blue), and CD31 (red) were used to portray the structure of colonic tissue (left image). H&E staining (right image). Scale bars, 100 μm. The white arrows and curves point out intestinal glands. And the yellow arrows mark smooth muscles cells labeled with αSMA (yellow) in lamina propria. d Pan-cytokeratin (cyan), CD20 (yellow), and CD3 (magenta) highlight the distribution of T cells and B cells in colonic tissue. Arrow 1 (magenta) and arrow 2 (yellow) indicate the T cells and B cells, respectively. Scale bars 100 μm. e CD68 (red), CD163 (blue) and CD11b (green) distinguish resident macrophages and inflammatory macrophages. Due to the overlap of colors, we used arrow 3 (plum) to highlight the resident macrophages (CD68+CD163+CD11b) and arrow 4 (orange) to point out the infiltrating macrophages (CD68+CD163CD11b+). Scale bars 100 μm. f Raw IMC image and processed image of CD16 staining. Scale bars, 100 μm. Representative plot from 52 samples (2 independent experiments). g t-SNE plots were based on the single-cell data extracted from IMC images. 17 clusters of cells from normal and ulcerative colitis samples were defined according to their markers. h The heat map showing the max-min normalized mean marker expression of 17 clusters with their frequency distribution pattern across different patients shown in the box plot.
Fig. 2
Fig. 2. Intestinal ecosystem changes revealed by IMC.
a 52 patient and donors’ samples were separated into 2 classes: normal (green) and UC (red), determined by Mayo Clinic Endoscopic Subscore. Patients’ clinical characteristics were also summarized. b Dendrogram based on cell type fractions showing the hierarchical relationship between samples and PCA plot showing similarities between cell type fractions of each sample from normal (green) and UC (red) groups. c, d The distribution of epithelial cells based on IMC results in c. (Normal, n = 19; UC, n = 33 from two independent experiments), statistical significance performed with two-sided Wilcoxon rank-sum tests and verification by FACS analysis of fresh samples, as shown in d. Statistic results (Normal, n = 11; UC, n = 8 from 8 independent experiments) were shown in the right panel of d as mean +/− SD and performed with a two-sided Wilcoxon rank-sum tests (***P < 0.001). Exact P values were provided in the Source Data file. e, f The distribution of T cells based on IMC results (Normal, n = 19; UC, n = 33 from two independent experiments), statistical significance performed with two-sided Wilcoxon rank-sum tests shown in e and verification by FACS analysis of fresh samples, as shown in f. Statistic results (Normal, n = 11; UC, n = 8 from 8 independent experiments) were shown in the right panel of f as mean +/− SD and performed with a two-sided Wilcoxon rank-sum tests (**p < 0.01). Exact P values were provided in the Source Data file. g, h The distribution of resident macrophages and infiltrating macrophages based on IMC results (Normal, n = 19; UC, n = 33 from 2 independent experiments). Statistical significance were performed with two-sided Wilcoxon rank-sum tests. Exact P values were provided in the Source Data file. i The distribution of the resident and infiltrating macrophages by FACS analysis of fresh samples. Statistic results (Normal, n = 11; UC, n = 8 from 8 independent experiments) were shown in the right panel of i as mean +/− SD and performed with a two-sided Wilcoxon rank-sum tests (**P < 0.01). Exact P values were provided in the Source Data file.
Fig. 3
Fig. 3. Dynamics of myeloid cell changes during UC.
a DSS treatment schedule. Mice were treated with 1.5% or 3% DSS in drinking water, followed by a four-week chase period with normal drinking water. Colon tissue was isolated and analyzed at indicated time points. Weight loss and the presence of occult blood in the feces were used as indicators for the successful establishment of DSS-induced colitis model.Weight data (ctrl, n = 5; 3% DSS, n = 5 from one experiment) were shown as mean +/− SD and performed with two-way ANOVA test (***P < 0.001). Exact P values were provided in the Source Data file. b Gating strategy for different myeloid cells in normal colon tissue at day 0. CD11b+ F4/80hi Fraction I cells were separated into MHC II and MHC II+ subsets of resident macrophages. CD11b+ F4/80int Fraction II cells were separated into P1 (Ly6c+ MHC II monocytes), P2 (Ly6c+ MHC II+ inflammatory macrophage), P3 (Ly6c MHC II+ infiltrating macrophage), and P4 (Ly6c MHC II eosinophil). CD11b+ F4/80 Fraction I cells were neutrophils. ce Representative FACS plots, subset percentages, and absolute numbers for the different myeloid cells shown in Fig. 5B during different time points of the DSS model. Data (1.5% DSS, n = 5; 3% DSS, n = 5 from one experiment) were shown as mean +/− SD. f Representative FACS plots and statistic results of infiltrating macrophages in WT (n = 5) and CCR2 knockout mice (n = 5 from one experiment) after DSS-induced colitis. Data were shown as mean +/− SD and performed with two-tailed T test (ns P > 0.05, *P < 0.05, **P < 0.01). Exact P values were provided in the Source Data file.
Fig. 4
Fig. 4. A single-cell transcriptomic atlas of the microenvironment in UC.
a The brief schematic of the single-cell RNA-seq analysis pipeline. b UMAP plot showing nine major cell type clusters identified based on the scRNA-seq data. c UMAP plot displaying key makers of each major cell type. d, e UMAP plot displaying sub-clusters of macrophage populations and e Key markers of each macrophage sub-cluster. f, g UMAP plot displaying sub-clusters of B cell populations and g Key markers of each B cell sub-cluster. h, i UMAP plot displaying sub-clusters of T cell populations and i Key markers of each T cell sub-cluster. j Cell number statistics for major cell types and corresponding sub-clusters. k Heatmap showing the abundance of sub-clusters of macrophages, T, and B cells across samples. Subset frequency was normalized to total cells and row scaled by z-score.
Fig. 5
Fig. 5. The mechanism of resident macrophage disappearance reaction.
a UMAP identifying expression of Factor V within all major populations. b Heatmap of regulon activities analyzed by SCENIC for inflammatory and resident macrophages. The top row refers to cell types and sample origins. c Volcano plot showing genes differentially expressed between inflammatory and resident macrophages in UC patients (adjusted p-value < 0.05 and |log2 Fold Change| > 1.5). d Enrichment analysis on Hallmark gene sets based on the up-/downregulated genes compared inflammatory to resident macrophages in UC patients (adjusted p-value < 0.05). e Expressions of SOD1/2 for inflammatory and resident macrophages in HC (Resident Macrophag, n = 199; Infiltrating Macrophage, n = 96), UCSC (Resident Macrophag, n = 201; Infiltrating Macrophage, n = 76), and UC groups (Resident Macrophag, n = 254; Infiltrating Macrophage, n = 168). Each box represents the 25th to 75th percentile of values. Minima and maxima are present in the boxplot’s lower and upper bounds and whiskers represent 1.5 × IQR away from upper/lower quartile or maxima/minima, whichever is closer. Statistics were performed with two-sided Wilcoxon rank-sum tests (ns P > 0.05, *P < 0.05, **P < 0.01, ***P < 0.001, ****P < 0.0001). The scRNA-seq data were preprared from 8 experiments. Exact P values were provided in the Source Data file. fi Representative plot for ROS reporter analyzed by FACS for infiltrating and resident macrophage shown in f and statistical results shown in h (n = 3 in both normal and inflammation region from one experiment). Representative image for ROS reporter together with immunofluorescence staining of CD169 (a marker for resident macrophage) were shown in g and statistical results (n = 3 in both normal and inflammation region from one experiment) for the absolute count of resident macrophage shown in i. Data were shown as mean +/− SD and performed with two-tailed T test (*P < 0.05, **P < 0.01). Exact P values were provided in the Source Data file.
Fig. 6
Fig. 6. Cellular neighborhood (CN) changes during UC.
a Schematic of CN identification. CN was defined by its center cell and the 20 nearest neighbor cells. b Identification of 15 distinct CNs based on the 17 original CTs and their respective abundances (column scaled) within each CN. c Representative Voronoi diagrams of CNs (upper panels) and corresponding IMC images (lower panels) in the normal and inflammatory region. d Dot plots showing the abundance of selected CNs (CN4, CN5, CN6, CN8, CN10, CN14) between normal and UC samples (Normal, n = 19; UC, n = 33 from two independent experiments). Dashed black line labeling mean value of each group and statistics were performed with two-sided Wilcoxon rank-sum tests. Exact P values were provided in the plot and Source Data file. e Schematic of the tensor decomposition analysis and decomposition results of selected modules for normal and UC groups. Weight of the line connecting CN and CT modules indicating interaction potentials between each pair.
Fig. 7
Fig. 7. Infiltrating macrophages induces a spatial shift of TNF-α production.
a Schematic of spatial cell-cell cross talk analysis. Cell-cell crosstalk was categorized into interaction and avoidance co-occurrence patterns. b Circles indicating patterns of cell-cell interactions/avoidance for normal and UC (Normal, n = 19; UC, n = 33 from two independent experiments). The circle size shows the percentage of ROIs with significant interaction/avoidance determined by the permutation test. Rows represent the cell type of interest (center cell) and columns represent other cell types surrounding the interest cell type (neighboring cell). Colors in the heatmap indicate the Pearson correlation between cell types across all ROIs in normal and UC respectively. c Circos plots showing cell-cell communications from inflammatory/resident macrophages to T/B cells involving chemokines and cytokines. d Network graph summarizing cell-cell communications between macrophages and T/B cells. Vertex sizes and edge widths scale to numbers of interacted cell types. e UMAP identifying distinguishable expression of TNF-α in lymphocytes and IL-1β in infiltrating macrophages, T cells, and B cells. f Ly6c+ MHC II+ inflammatory macrophages were sorted from the colon in DSS treated mice and cultured with lymphocytes from mesenteric lymph nodes. Representative plots and statistics results (ctrl, n = 8; Ly6c+ MHC II+, n = 8 from two independent experiments) were shown for TNF-α production from CD3+ T cells and CD19+ B cells after the co-cultivation as mean +/− SD and performed with two-tailed T test (***p < 0.001). Exact P values were provided in the Source Data file. g mIHC staining of TNF-α production. Intestinal tissues from normal and UC patients were stained with Pan-cytokeratin (green), TNF-α (red), and DAPI for DNA (blue). All markers were listed in the legend on the image. Scale bars, 100 μm. Representative plot from 5 samples (2 independent experiments). h The abstract diagram interprets the mechanism of the resident macrophage disappearance effect. ROS was elevated as the first defense against the invading bacteria. At the same time, immune-suppressive resident macrophage was wiped out purposely due to their sensitivity to ROS and replaced by inflammatory macrophage which was resistant to ROS based on the high level of SOD2. Furthermore, inflammatory macrophages played a key role in forming the inflammatory cellular network by producing TNF-α and IL-1β. Resident macrophages might go through cell death due to high ROS stress.

References

    1. Vegh Z, Kurti Z, Lakatos PL. Epidemiology of inflammatory bowel diseases from west to east. J. Dig. Dis. 2017;18:92–98. doi: 10.1111/1751-2980.12449. - DOI - PubMed
    1. Gren ST, Grip O. Role of monocytes and intestinal macrophages in Crohn’s disease and ulcerative colitis. Inflamm. Bowel Dis. 2016;22:1992–1998. doi: 10.1097/MIB.0000000000000824. - DOI - PubMed
    1. Sheng J, Ruedl C, Karjalainen K. Most tissue-resident macrophages except microglia are derived from fetal hematopoietic stem cells. Immunity. 2015;43:382–393. doi: 10.1016/j.immuni.2015.07.016. - DOI - PubMed
    1. Zigmond E, et al. Macrophage-restricted interleukin-10 receptor deficiency, but not IL-10 deficiency, causes severe spontaneous colitis. Immunity. 2014;40:720–733. doi: 10.1016/j.immuni.2014.03.012. - DOI - PubMed
    1. Zigmond E, et al. Ly6C hi monocytes in the inflamed colon give rise to proinflammatory effector cells and migratory antigen-presenting cells. Immunity. 2012;37:1076–1090. doi: 10.1016/j.immuni.2012.08.026. - DOI - PubMed

Publication types