. 2023 Jun 21;14(1):3696.
doi: 10.1038/s41467-023-39041-z.

Acentrosomal spindles assemble from branching microtubule nucleation near chromosomes in Xenopus laevis egg extract

Affiliations

Acentrosomal spindles assemble from branching microtubule nucleation near chromosomes in Xenopus laevis egg extract

Bernardo Gouveia et al. Nat Commun. .

Abstract

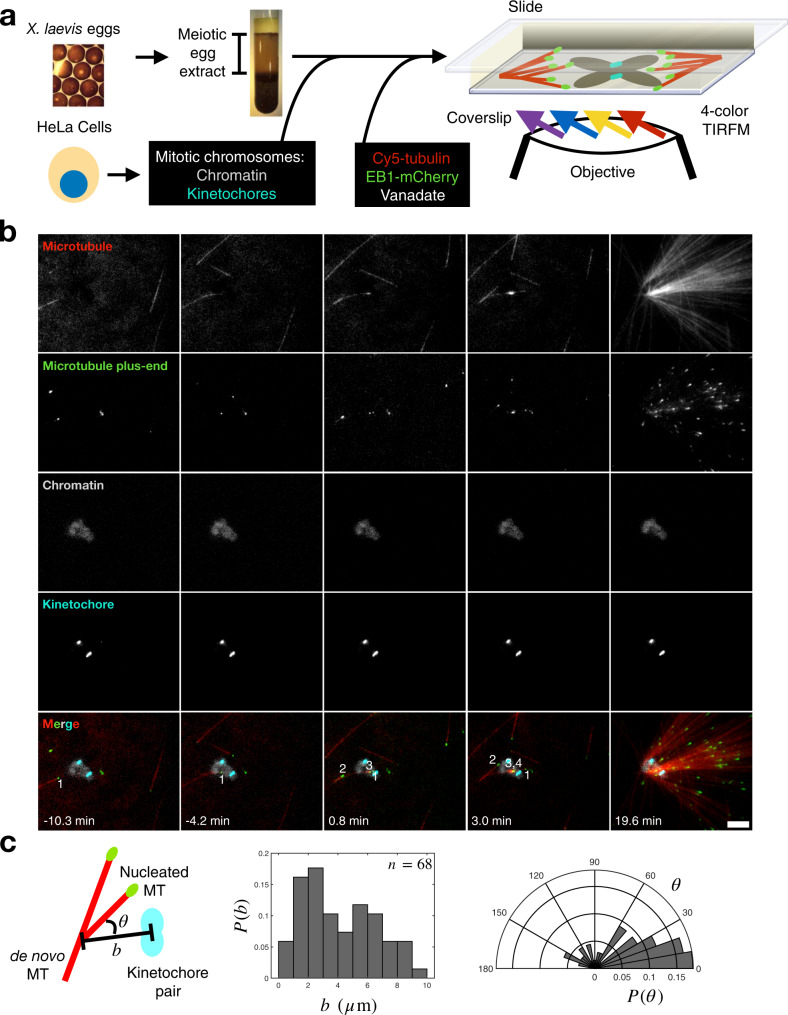
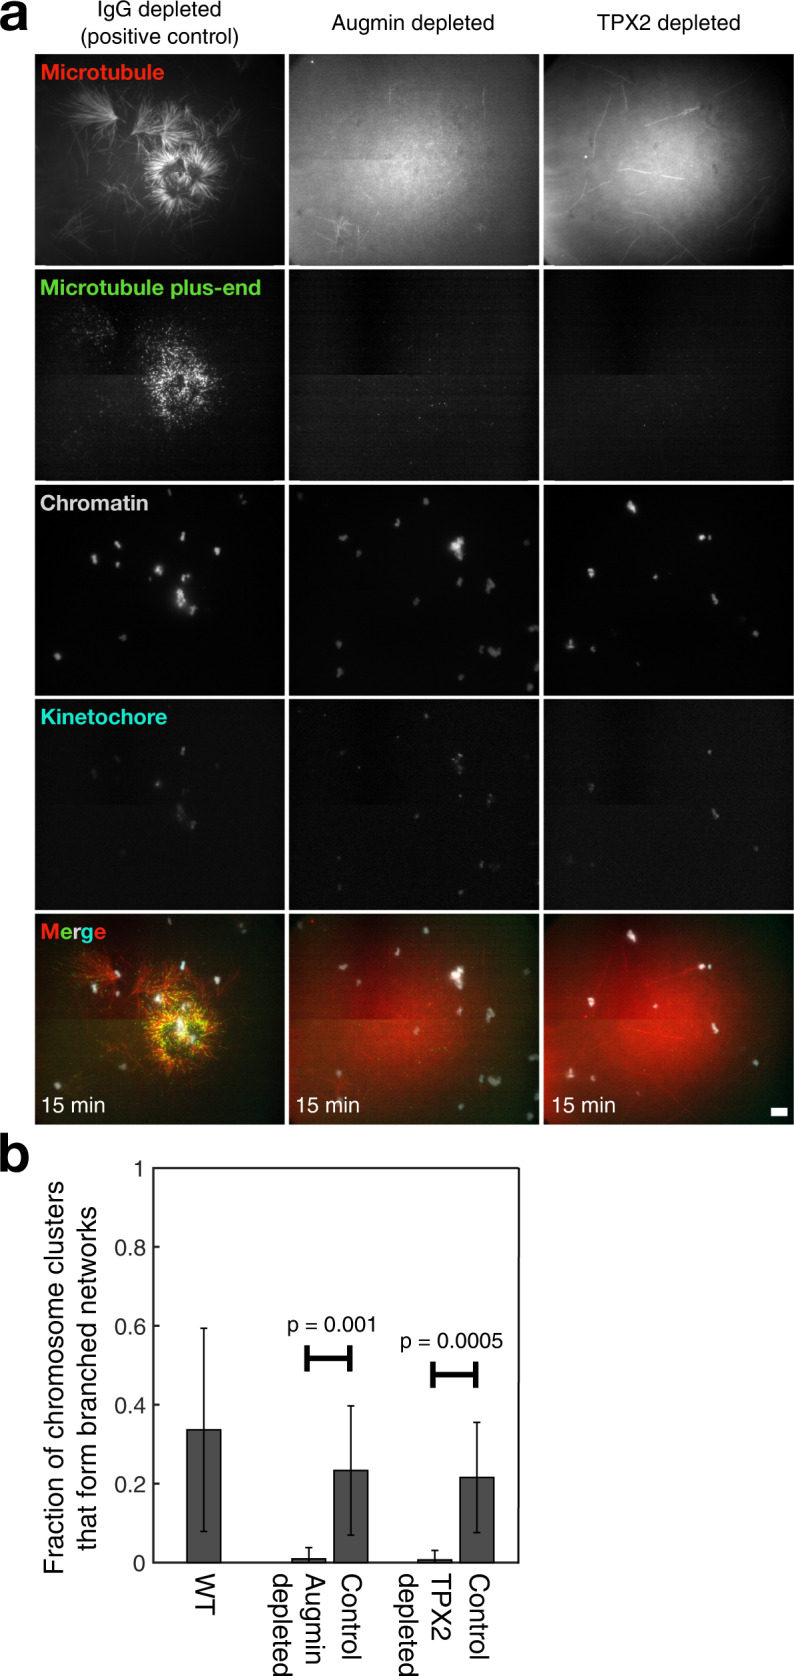
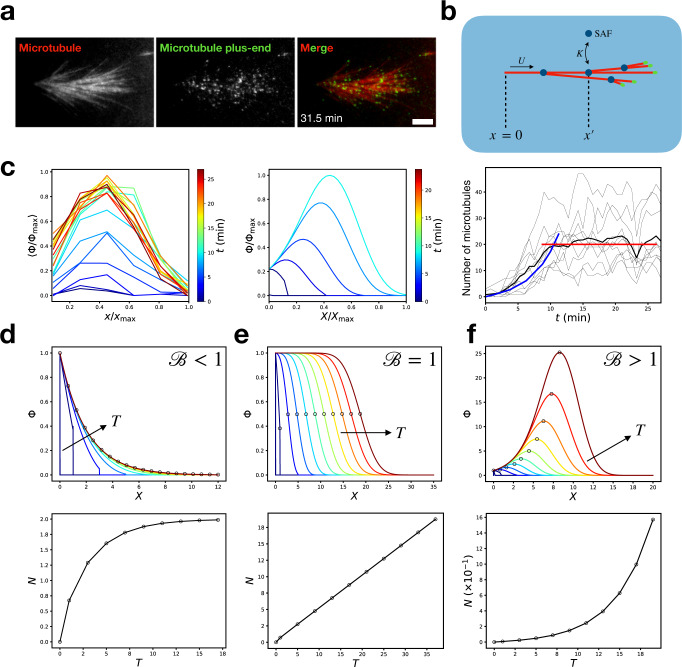
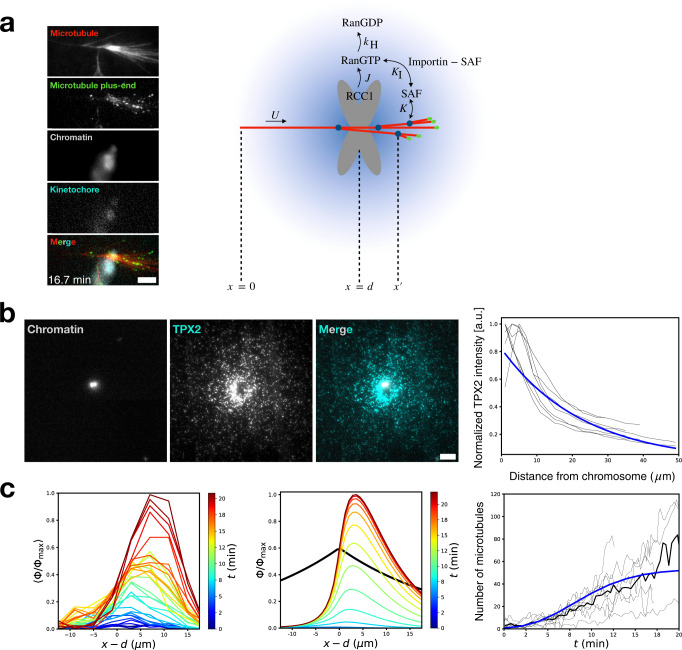
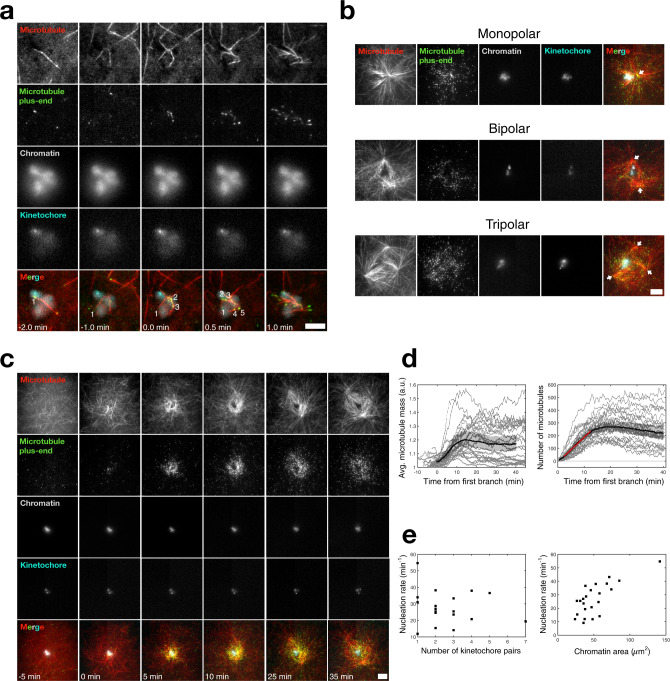
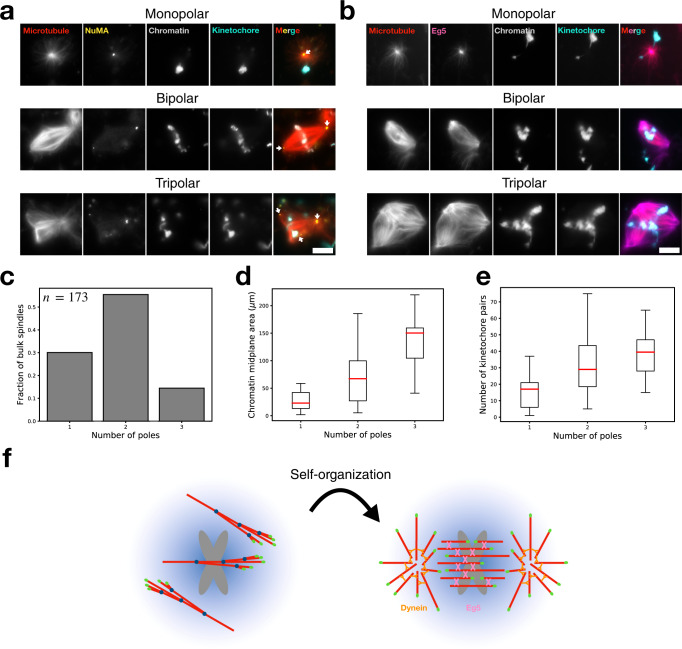
Microtubules are generated at centrosomes, chromosomes, and within spindles during cell division. Whereas microtubule nucleation at the centrosome is well characterized, much remains unknown about where, when, and how microtubules are nucleated at chromosomes. To address these questions, we reconstitute microtubule nucleation from purified chromosomes in meiotic Xenopus egg extract and find that chromosomes alone can form spindles. We visualize microtubule nucleation near chromosomes using total internal reflection fluorescence microscopy to find that this occurs through branching microtubule nucleation. By inhibiting molecular motors, we find that the organization of the resultant polar branched networks is consistent with a theoretical model where the effectors for branching nucleation are released by chromosomes, forming a concentration gradient that spatially biases branching microtbule nucleation. In the presence of motors, these branched networks are ultimately organized into functional spindles, where the number of emergent spindle poles scales with the number of chromosomes and total chromatin area.


Conflict of interest statement

The authors declare no competing interests.

Figures

Fig. 1
Fig. 1. Ex vivo reconstitution of microtubule-dependent microtubule nucleation near chromosomes.
a An illustration of the ex vivo reconstitution, which utilizes meiotic cytosol purified from Xenopus laevis eggs and chromosomes with CENPA-GFP labeled kinetochores purified from mitotic HeLa cells (“Methods”). Fluorescent tubulin and EB1 are included to label microtubules and microtubule plus-ends, respectively. Vanadate is used to inhibit motor activity. b The initial nucleation events near chromosomes are microtubule-dependent. A de novo microtubule randomly approaches a chromosome, allowing new microtubules to nucleate from it. This leads to an autocatalytic microtubule network of uniform polarity. Numbers demarcate unique microtubule plus-ends. t = 0 min corresponds to the first nucleation event. Scale bar is 5 μm. c Histogram of distance to the nearest kinetochore pair and polar histogram of angle towards the nearest kinetochore pair for up to the first ten nucleation events around chromosomes. Data are from 11 chromosome clusters across 7 extract preparations. n = 68 nucleation events.
Fig. 2
Fig. 2. Branching microtubule nucleation mediated by TPX2 and augmin is the chief source of chromosomal microtubule networks.
a Field of view for each of the three conditions tested: IgG depleted, augmin depleted, and TPX2 depleted, visualized using TIRFM in the presence of vanadate. Chromosomal microtubule networks were not generated when augmin or TPX2 was depleted. Scale bars are 10 μm. b Mean fraction of chromosomes that form microtubule networks in each condition. n = 213 chromosome clusters for wild-type extract, n = 135 for the augmin ID, n = 237 for the respective IgG control, n = 144 for the TPX2 ID, and n = 185 for the respective IgG control. Error bars are standard deviations across n = 10 imaging fields per condition. Data are from 4 extract preparations per condition. P values reported are from the two-sample Kolmogorov–Smirnov test.
Fig. 3
Fig. 3. Branching microtubule nucleation in a uniform field of SAFs: experiment and theory.
a TIRFM snapshot of a branched network in a uniform field of SAFs in the presence of vanadate. Scale bar is 5 μm. b Schematic of the branching nucleation model. c Experimentally measured plus-end distribution Φ (left panel, averaged over n = 10 branched networks across five different extract preparations) compared with the theoretically predicted plus-end distribution using B = 1.7 (middle panel). Plus-end distributions are normalized by their maximum value Φmax and rescaled by the length of the final branched network Xmax. In the right panel, the black curves show the experimentally measured number of microtubules, which increases exponentially over the first ~10 min before saturating. The blue curve is the theoretical prediction with B = 1.7 (R2 = 0.90), while the red curve shows the average number of microtubules after saturation. d For B < 1, the plus-end distribution reaches a bounded stationary state set by microtubule turnover. e For B = 1, the plus-end distribution propagates as a constant density wave where microtubule turnover perfectly balances branching nucleation. f For B > 1, the plus-end distribution propagates as an autocatalytic growing front as branching nucleation outcompetes microtubule turnover.
Fig. 4
Fig. 4. Branching microtubule nucleation near chromosomes: experiment and theory.
a Representative TIRFM snapshot of a chromosomal branched network in the presence of vanadate and model schematic of RanGTP-regulated chromosomal branching nucleation. RanGTP is released at chromosomes and can either be hydrolyzed into RanGDP or bind the importin molecules that sequester SAFs, freeing them to promote microtubule branching nucleation. t = 0 min corresponds to the first branching event. Scale bar is 5 μm. b The images show that the SAF GFP-TPX2 is enriched around chromosomes in an extract depleted of endogenous TPX2. The plot shows intensity profiles of GFP-TPX2 as a function from the distance from chromosomes, computed using 2 μm radial bins (black curves). The blue curve is the average best fit decaying exponential Ae-r/λ with A = 0.8 ± 0.1 and λ = 23 ± 2 μm (7 chromosome clusters across 2 extract preparations). Scale bar is 5 μm. c Experimentally measured plus-end distribution Φ (left panel, n = 11 branched networks across 7 extract preparations) compared with the theoretically predicted plus-end distribution using B = 2 and Λ = 3 (middle panel). The black curve shows the SAF gradient profile. Plus-end distributions are normalized by their maximum value Φmax and plotted as a function of distance from the chromosome xd. In the right panel, the experimentally measured number of microtubules (black curves) is compared with the theoretical prediction using B = 2 and Λ = 3 (blue curve, R2 = 0.95).
Fig. 5
Fig. 5. In the presence of motor activity, chromosomes generate polar spindles.
a Branching microtubule nucleation leads to the formation of branched networks at chromosomes, which are eventually organized into a spindle by motor activity. A de novo microtubule randomly approaches a chromosome, bends due to motor activity, and nucleates new microtubule branches. This leads to an autocatalytic branched microtubule network that gets reorganized by motors into a bipolar spindle over time. Numbers demarcate unique microtubule plus-ends. t = 0 min corresponds to the first branching event. Scale bars are 5 μm. b TIRFM visualization of mono-, bi-, and tripolar spindles assembled around purified chromosome clusters on the coverslip surface. White arrows mark the poles. Scale bars is 10 μm. c Time-lapse TIRFM images of a bipolar spindle assembling around chromosomes. t = 0 min corresponds to the first branching event. Scale bar is 10 μm. d Microtubule mass (left) and number of microtubules (right) versus time during spindle assembly. Microtubule mass and number plateau at ~10 min. n = 23 spindles across seven extract preparations. Shaded regions represent 95% bootstrap confidence intervals. The red curve is a linear fit, giving an effective microtubule nucleation rate of k = 19.5 ± 0.54 microtubules/min (mean ± 95% confidence bounds, R2 > 0.99). e Nucleation rate in the spindle does not significantly correlate with the number of visible kinetochore pairs in the chromosome cluster (left). One-sided Pearson correlation coefficient = −0.07, P = 0.78. n = 19 spindles across 7 extract preparations. The nucleation rate in the spindle correlates with the two-dimensional projected area of the chromatin in the chromosome cluster (right). One-sided Pearson correlation coefficient = 0.73, P = 0.0003. n = 23 spindles across 7 extract preparations.
Fig. 6
Fig. 6. Immunofluorescence and analysis of bulk spindle organization.
Epifluorescence visualization of fixed mono-, bi-, and tripolar spindles organized around purified chromosome clusters in bulk extract immunostained for a NuMA and b Eg5. Images shown are midplanes of a z-stack. White arrows mark the poles which show sharp NuMA localization. Scale bars are 10 μm. c Number of monopolar (n = 52), bipolar (n = 96), and tripolar (n = 25) spindles. n = 173 spindles total across 13 extract preparations. The number of spindle poles increases with d increasing chromatin area and e increasing chromosome number. Chromatin areas were measured at the spindle midplane. Chromosome numbers were manually determined by counting kinetochore pairs throughout each z-stack. The minimum number of chromosomes that formed a monopolar, bipolar, or tripolar spindle were 1, 5, and 15, respectively. Boxes are interquartile ranges, whiskers extend 1.5× the interquartile range, and red lines are medians. f Schematic of our general model for acentrosomal spindle assembly. First, de novo microtubules randomly enter the SAF gradient generated by chromosomes. Branching microtubule nucleation occurs along these first mother microtubules, generating branched networks. These branched networks are then self-organized by molecular motors such as dynein and Eg5 into a bipolar spindle.

Similar articles

Cited by

References

    1. McKim, K. S. & Hawley, R. S. Chromosomal control of meiotic cell division. Science10.1126/science.270.5242.1595 (1995). - PubMed
    1. Ohkura H. Meiosis: an overview of key differences from mitosis. Cold Spring Harb. Perspect. Biol. 2015;7:a015859. doi: 10.1101/cshperspect.a015859. - DOI - PMC - PubMed
    1. Dumont J, Desai A. Acentrosomal spindle assembly and chromosome segregation during oocyte meiosis. Trends Cell Biol. 2012;22:241–249. doi: 10.1016/j.tcb.2012.02.007. - DOI - PMC - PubMed
    1. Zhang H, Dawe RK. Mechanisms of plant spindle formation. Chromosome Res. 2011;19:335–344. doi: 10.1007/s10577-011-9190-y. - DOI - PubMed
    1. Karsenti E, Newport J, Kirschner M. Respective roles of centrosomes and chromatin in the conversion of microtubule arrays from interphase to metaphase. J. Cell Biol. 1984;99:47s–54s. doi: 10.1083/jcb.99.1.47s. - DOI - PMC - PubMed

Publication types