. 2023 Jun 21;13(1):10082.
doi: 10.1038/s41598-023-36468-8.

The effect of blocking immune checkpoints LAG-3 and PD-1 on human invariant Natural Killer T cell function

Affiliations

The effect of blocking immune checkpoints LAG-3 and PD-1 on human invariant Natural Killer T cell function

Allison L Balasko et al. Sci Rep. .

Abstract

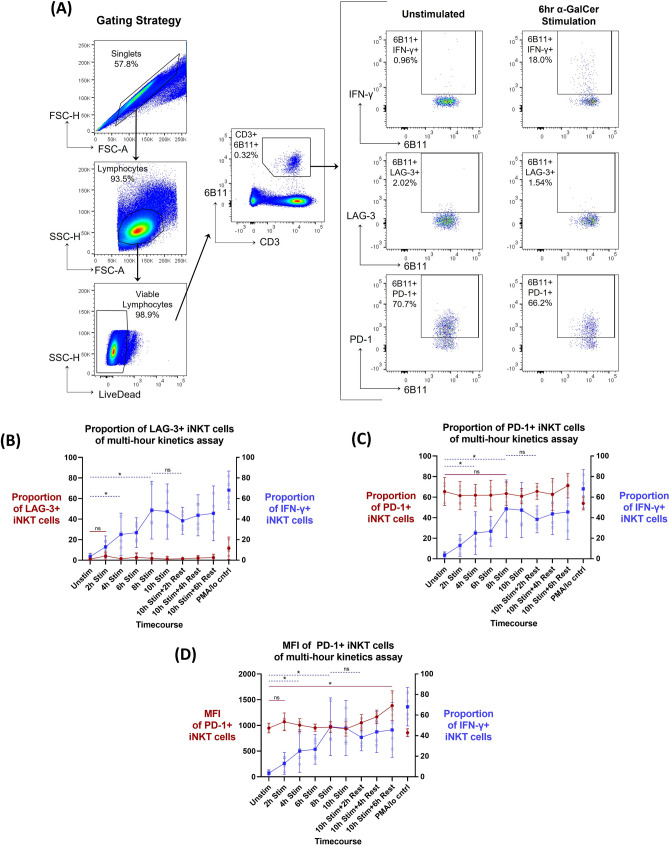
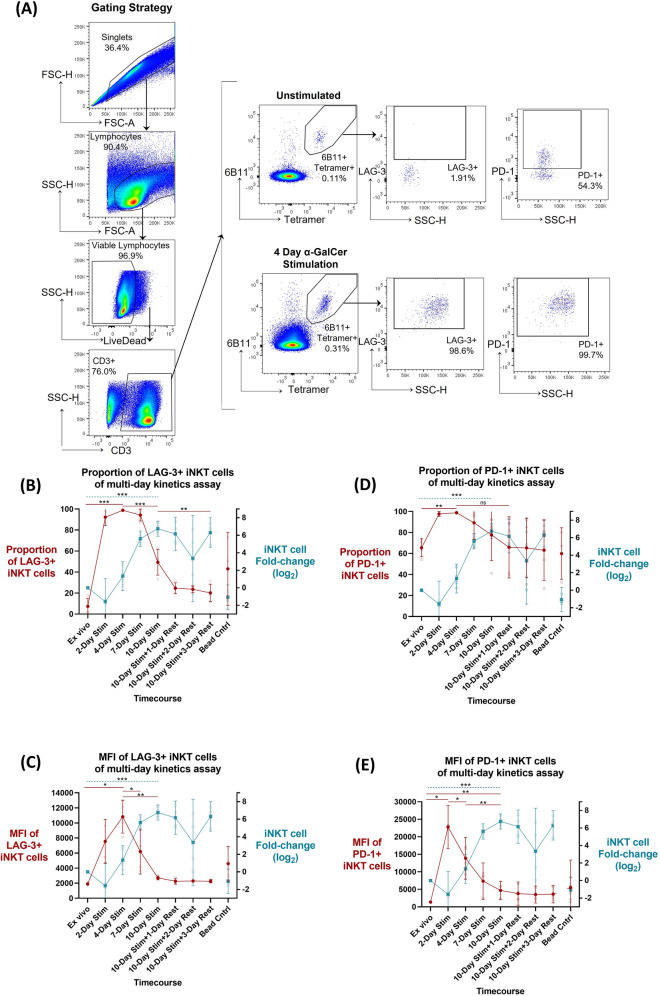
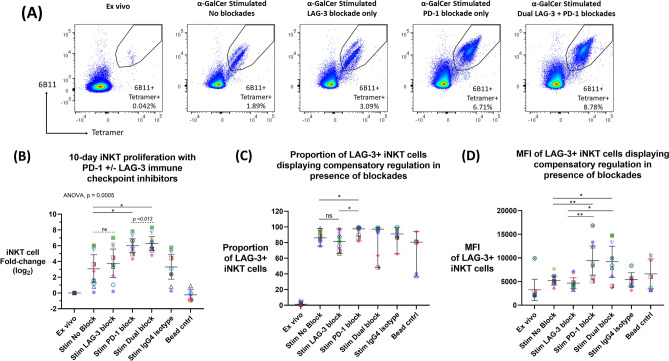
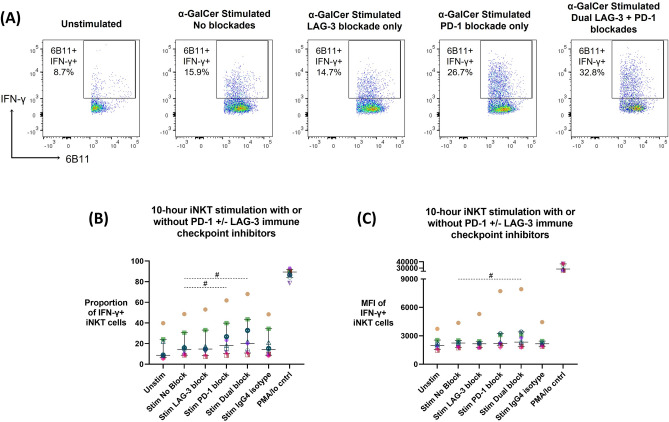
Invariant Natural Killer T (iNKT) cells undergo immune exhaustion during chronic activation caused by cancer and viral infections, such as HIV. Exhaustion is marked by cell dysfunction and increased expression of immune checkpoint proteins programmed cell-death-1 (PD-1) and lymphocyte-activation-gene-3 (LAG-3). We hypothesize that blockade of PD-1 and/or LAG-3 will enhance iNKT cell function. Utilizing peripheral blood mononuclear cells from healthy donors, LAG-3 and PD-1 expression on iNKT cells was assessed using flow cytometry following in vitro stimulation with iNKT-specific stimulant α-galactosylceramide (n = 4). Efficacy of anti-LAG-3 and/or anti-PD-1 antibody blockades in enhancing iNKT cell function was assessed by determining proliferative capacity and IFN-γ production (n = 9). LAG-3 and PD-1 expression on iNKT cells peaked at Day 4 (98.8%; p ≤ 0.0001 and 98.8%; p = 0.005, respectively), followed by steep decrease by Day 10, coinciding with peak iNKT cell proliferation. In a 10-day blocking assay, both the anti-PD-1 alone and dual anti-PD-1 and anti-LAG-3 significantly increased iNKT proliferation (6 and 6.29 log2 fold-change respectively) compared to the no blockade control (ANOVA-p = 0.0005) with the dual blockade system being more effective (t-test-p = 0.013). This provides proof-of-concept for LAG-3 and PD-1 as immunotherapeutic targets to enhance human iNKT cell function, with the long-term goal of addressing immune exhaustion.


Conflict of interest statement

The authors declare no competing interests.

Figures

Figure 1
Figure 1
Kinetics of PD-1 and LAG-3 surface expression following a multi-hour α-GalCer iNKT cell activation and rest assay (n = 4). (A) Example of iNKT flow cytometry gating strategy. (B) LAG-3 proportion of parent population expression (left y-axis, red line), (C) PD-1 proportion of parent population expression (left y-axis, red line) and (D) median fluorescent intensity (MFI) of PD-1 + iNKT cells (left y-axis, red line) in relation to proportion of parent population IFN-γ production (right y-axis, blue line) over the multi-hour α-GalCer stimulation time course. Mean and 95% confidence intervals are represented at each timepoint for both datasets, with the mean represented as either circles (left y-axis) or squares (right y-axis). Raw data values are represented as smaller open dots. Paired two-tailed T-tests have been selected to highlight specific dataset trends (dashed blue line: right y-axis dataset; straight red line: left y-axis dataset), where p < 0.05 were considered significant (*< 0.05, **< 0.01, ***< 0.001, ns: not significant).
Figure 2
Figure 2
Kinetics of PD-1 and LAG-3 surface expression following a multi-day α-GalCer iNKT cell activation and rest assay (n = 4). (A) Example of iNKT flow cytometry gating strategy. Surface LAG-3 expression defined as (B) proportion of parent population or (C) median fluorescent intensity (MFI), and PD-1 expression defined as (D) proportion of parent population or (E) MFI (left y-axis, red line) in relation to iNKT fold change (log2) (right y-axis, teal line) over the multi-day α-GalCer stimulation time course. Mean and 95% confidence intervals are represented at each timepoint for both datasets, with the mean represented as either circles (left y-axis) or squares (right y-axis). Raw data values are represented as smaller open dots. Paired two-tailed T-tests have been selected to highlight specific dataset trends (dashed teal line: right y-axis dataset; straight red line: left y-axis dataset), where p < 0.05 were considered significant (* < 0.05, ** < 0.01, *** < 0.001, ns: not significant).
Figure 3
Figure 3
Anti-PD-1 and anti-LAG-3 single or dual blockade application during a 10-day α-GalCer iNKT cell proliferation assay (n = 9). (A) Example of one donor’s iNKT cell proliferation by flow cytometry data with or without PD-1 + /− LAG-3 blockade application. (B) Fold change (log2) of iNKT cell population following 10-day α-GalCer stimulation assay with or without PD-1 + /− LAG-3 blockade, compared to no blockade or isotype control. ANOVA and Dunnett’s multiple comparisons test were used to compare the mean of the LAG-3, PD-1 and Dual blockade conditions to the mean of the stimulation control “Stim no blockade” (solid line) where p < 0.05 were considered significant (* < 0.05, ** < 0.01, *** < 0.001). Mean (horizontal line) and 95% confidence intervals are represented in each condition. Paired two-tailed T-tests were used as a follow up comparison analysis (dash line), where p < 0.05 were considered significant (# < 0.05, ## < 0.01, ### < 0.001, ns: not significant). (C) Proportion and (D) MFI of LAG-3 + iNKT cell population following 10-day stimulation assay with or without PD-1 + /− LAG-3 blockade, where Wilcoxon two-tailed matched-pair signed-rank test and paired two-tailed T-test were used, respectively. p < 0.05 were considered significant (* < 0.05, ** < 0.01, *** < 0.001, ns: not significant). Colours and symbols represent individual donors.
Figure 4
Figure 4
Anti-PD-1 and anti-LAG-3 single or dual blockade application during a 10-h α-GalCer stimulation post-iNKT cellular expansion model (n = 9). (A) Example of one donor’s iNKT cell flow cytometry data with or without PD-1 + /− LAG-3 blockade application. iNKT cell IFN-γ production, represented as (B) proportion of parent population or (C) MFI, in response to a 10 h α-GalCer stimulation assay with or without PD-1 + /− LAG-3 blockade compared to no blockade or isotype control, following the iNKT expansion model. Wilcoxon two-tailed matched-pair signed-rank tests were used (dash line), where p < 0.05 were considered significant (# < 0.05, ## < 0.01, ### < 0.001, ns: not significant). Colours and symbols represent individual donors.

Similar articles

Cited by

References

    1. Li D, Xu X-N. NKT cells in HIV-1 infection. Cell Res. 2008;18(8):817–822. doi: 10.1038/CR.2008.85. - DOI - PubMed
    1. Kenna T, Mason LG, Porcelli S, et al. NKT cells from normal and tumor-bearing human livers are phenotypically and functionally distinct from murine NKT cells. J Immunol. 2003;171(4):1775–1779. doi: 10.4049/jimmunol.171.4.1775. - DOI - PubMed
    1. Lynch L, O’Shea D, Winter DC, Geoghegan J, Doherty DG, O’Farrelly C. Invariant NKT cells and CD1d+ cells amass in human omentum and are depleted in patients with cancer and obesity. Eur J Immunol. 2009;39(7):1893–1901. doi: 10.1002/EJI.200939349. - DOI - PubMed
    1. Taniguchi M, Nakayama T. Recognition and function of Vα14 NKT cells. Semin Immunol. 2000;12(6):543–550. doi: 10.1006/smim.2000.0270. - DOI - PubMed
    1. Snyder-Cappione JE, Nixon DF, Chi JC, et al. Evidence of invariant Natural Killer T (iNKT) cell exhaustion in sarcoidosis. Eur. J. Immunol. (43):2194–2205. 10.1002/eji.201243185 - PMC - PubMed

Publication types