. 2023 Jul;619(7970):650-657.
doi: 10.1038/s41586-023-06179-1. Epub 2023 Jun 21.

Structure and function of the RAD51B-RAD51C-RAD51D-XRCC2 tumour suppressor

Affiliations

Structure and function of the RAD51B-RAD51C-RAD51D-XRCC2 tumour suppressor

Luke A Greenhough et al. Nature. 2023 Jul.

Abstract

Homologous recombination is a fundamental process of life. It is required for the protection and restart of broken replication forks, the repair of chromosome breaks and the exchange of genetic material during meiosis. Individuals with mutations in key recombination genes, such as BRCA2 (also known as FANCD1), or the RAD51 paralogues RAD51B, RAD51C (also known as FANCO), RAD51D, XRCC2 (also known as FANCU) and XRCC3, are predisposed to breast, ovarian and prostate cancers1-10 and the cancer-prone syndrome Fanconi anaemia11-13. The BRCA2 tumour suppressor protein-the product of BRCA2-is well characterized, but the cellular functions of the RAD51 paralogues remain unclear. Genetic knockouts display growth defects, reduced RAD51 focus formation, spontaneous chromosome abnormalities, sensitivity to PARP inhibitors and replication fork defects14,15, but the precise molecular roles of RAD51 paralogues in fork stability, DNA repair and cancer avoidance remain unknown. Here we used cryo-electron microscopy, AlphaFold2 modelling and structural proteomics to determine the structure of the RAD51B-RAD51C-RAD51D-XRCC2 complex (BCDX2), revealing that RAD51C-RAD51D-XRCC2 mimics three RAD51 protomers aligned within a nucleoprotein filament, whereas RAD51B is highly dynamic. Biochemical and single-molecule analyses showed that BCDX2 stimulates the nucleation and extension of RAD51 filaments-which are essential for recombinational DNA repair-in reactions that depend on the coupled ATPase activities of RAD51B and RAD51C. Our studies demonstrate that BCDX2 orchestrates RAD51 assembly on single stranded DNA for replication fork protection and double strand break repair, in reactions that are critical for tumour avoidance.


Conflict of interest statement

Competing interests

S.J.B. is a co-founder and VP Science Strategy at Artios Pharma Ltd., Babraham Research Campus, U.K. Other authors declare no conflict of interest.

Figures
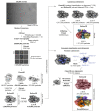
Extended Data Fig. 1
Extended Data Fig. 1. Single particle analysis pipeline of BCDX2-ADP.AlFx and BCDX2-ADP.AlFx-ssDNA.
Summary of the data processing strategies, including intermediate 2D and 3D class averages, which yield the final reconstructions of BCDX2-ADP.AlFx (2.2 Å) and BCDX2-ADP.AlFx-ssDNA (2.9 Å).
Extended Data Fig. 2
Extended Data Fig. 2. Single particle analysis pipeline of BCDX2-ADP.BeFx.
Summary of the data processing strategy, including intermediate 2D and 3D class averages, which yields the final reconstruction of BCDX2-ADP.BeFx (3.4 Å)
Extended Data Fig. 3
Extended Data Fig. 3. Angular distribution, map and model resolution statistics and local resolution.
a, Angular distribution plots. b, Fourier Shell Correlation (FSC) plots. c, Map vs model FSCs. d, Local resolution estimates for BCDX2-ADP.AlFx (2.2 Å), BCDX2- ADP.AlFx (2.9 Å) and BCDX2-ADP.BeFx (3.4 Å).
Extended Data Fig. 4
Extended Data Fig. 4. Structural and biochemical analyses of BCDX2.
a, SDS-PAGE of BCDX2 and BNTDCDX2. b, Front (left) and back (right) views of BCDX2-ADP.BeFx cryo-EM map (3.4 Å) and atomic model. c, and d, NS-EM 2D class averages of BCDX2 showing movement of the mobile domain in the presence of ATP or ADP, respectively. e, Limited proteolysis of BCDX2. SDS-PAGE gel and immunoblots of Superdex 200 3.2/300 fractions for untreated and chymotrypsin treated BCDX2. For gel and immunoblot source data, see Supplementary Figure 1.
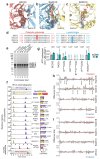
Extended Data Fig. 5
Extended Data Fig. 5. Coupling of RAD51B and RAD51C ATPases.
a, b and c, Atomic models from the BCDX2-ADP.BeFx structure (3.4 Å) showing the binding of ATP by XRCC2, ATP by RAD51D and ADP by RAD51C, respectively. The Walker A lysine and threonine, Walker B aspartate, catalytic glutamate and the lysine finger from the adjacent subunit are indicated. Density of the nucleotide is shown as black mesh. Green spheres = Mg2+ ions. d, Sequence alignment of the RAD51, RAD51B, RAD51C, RAD51D and XRCC2 protein sequences. Highlighted in red are conserved catalytic glutamate residues (RAD51, RAD51B and RAD51C) and in cyan are lysine fingers (RAD51B, RAD51C, RAD51D and XRCC2). e, SDS-PAGE of the mutant proteins used in Figure 4. For gel source data, see Supplementary Figure 1. f, HPLC chromatograms (left) of standards (standardised to 2 μM ATP, ADP, ATPyS) and BCDX2/BCTD (standardised to 1 μM BCDX2). Bar chart (mean + s.d.) of bound nucleotides (right). All are n=3 except wt and BK114ACDX2 which is n=7 and n=4 respectively. n values are independent experiments. Unpaired two-tailed t-test. g, Bar chart (mean + s.d.) of ATP hydrolysis rate. All are n=3 except wt which is n=6. n values are independent experiments. Unpaired two-tailed t-test. h and i, Difference plots between BCDX2-ADP.AlFx and BCDX2-ADP, and BCDX2-ADP.BeFx and BCDX2-ADP, respectively, showing the level of deuterium uptake after 3 (orange), 30 (red), 300 (blue) and 3000 (black) seconds. Positive values = exposure; negative values = protection. RAD51B: 116 peptides, 91.1% coverage, 3.36 redundancy. RAD51C: 134 peptides, 88% coverage, 4.11 redundancy. RAD51D: 99 peptides, 93.0% coverage, 3.5 redundancy. XRCC2: 76 peptides, 93.6% coverage, 2.67 redundancy.
Extended Data Fig. 6
Extended Data Fig. 6. ATP hydrolysis by BCDX2 stimulates RAD51 filament assembly.
a, Representative NS-EM micrographs of RAD51 filaments in the absence and presence of BCDX2, showing filaments detected by curvilinear line analysis and crYOLO particle picking. Scale bar = 100 nm. b, Scatter plot (mean + s.d.) of number of crYOLO picked particles per micrograph (n=631 micrographs). Unpaired two-tailed t-test. c, Force measured between the traps as a function of time in the absence (n=6) and presence (n=7) of BCDX2. Shaded area represents SEM. d, Representative kymographs and time-binned intensity histograms verses genomic position on RPAmStrawberry coated λ ssDNA for RAD51AF488 signal (blue) in the absence or presence of BCDX2. Each line represents 1 min timepoint. Nucleation rate was calculated for each time frame of the smoothed kymograph by detecting peaks in the AF488 intensity profile. e, Kymographs of RAD51 filament growth (by movement of ssDNA into protein + ATP channel) and subsequent disassembly (movement into buffer only channel containing no ATP). Growth and disassembly rates were measured as a slope of the border of the RAD51AF488 signal. f, Scatter plot (median and IQR) of RAD51 disassembly rates in the absence (n=47 filaments) and presence (n=50 filaments) of BCDX2. Two-sided Mann-Whitney test. g, Force measured between the traps as a function of time absence (n=6) or presence of BCDX2 (n=6), BE144ACDX2 (n=6), BCE161ACDX2 (n=7) and BE144ACE161ACDX2 (n=6). n values are independent experiments. Shaded area represents SEM.
Extended Data Fig. 7
Extended Data Fig. 7. ATP hydrolysis is required for ssDNA binding.
a, Changes in fluorescence anisotropy upon binding of WT BCDX2 to FAM-dN15nt ssDNA in the presence of ATPyS (n=3, magenta), AMP-PNP (n=3, turquoise), ADP.BeFx (n=3, navy) and ADP.Vanadate (n=3, brown). Lines denote quadratic curve fits. Each point and error bar denotes mean + s.d. n values are independent experiments. b, Calculated ssDNA binding affinity constants (centre = KD values, error bars = 95% CI lower and upper limits) of wild-type BCDX2 in the presence of ATP, ADP, ADP.AlFx, ATPγS, AMP-PNP, ADP.BeFx and ADP.Vanadate. X axis = log10 scale. c, SDS-PAGE of dual labelled BCDX2, BE144ACDX2 and BCE161ADX2. Left = Coomassie stain. Right = AF555 and AF647 fluorescence. For gel source data, see Supplementary Figure 1. d, Bar chart (mean + s.d.) of binding frequencies of BCDX2, BE144ACDX2 and BCE161ADX2 to ssDNA in the absence (n=3, n=5, n=5 independent experiments, respectively) or presence (n=4, n=5, n=5 independent experiments, respectively) of RAD51 in the first 30 second window. Unpaired two-tailed t-test. e and f, Normalized fluorescence intensity for AF555 signal for fluorescently labelled BCDX2, BE144ACDX2 or BCE161ADX2 over time in the absence (n=3, n=4, n=4 independent experiments, respectively) or presence (n=4, n=5, n=5 independent experiments, respectively) of unlabelled RAD51. Shaded area represents SEM. g, Force measured between the traps as a function of time of RAD51 in the absence (n=5) and presence of fluorescently labelled BCDX2 (n=7), BE144ACDX2 (n=6) or BCE161ADX2 (n=5). n values are independent experiments. Shaded area represents SEM. h, Kymographs of RAD51AF555/BCDX2AF647 FRET. 1 = FRET between RAD51 and BCDX2. 2 = BCDX2 dissociates or RAD51 binding. 3 = RAD51 dissociates. i, Scatter plot of AF647 intensity values for RAD51 alone (bleed-through) (n=39), BAF647CDX2 (n=48) and BCDX2ybbr-AF647 (n=61). Median + IQR. Two-sided Mann-Whitney statistical test.
Extended Data Fig. 8
Extended Data Fig. 8. Mechanism of ssDNA binding by BCDX2
a, Cryo-EM model of BCDX2 bound to ssDNA. Unmodelled density of ssDNA is labelled (red) and an additional density, thought to be due to a protein conformation change, is indicated (blue). b, Difference plot between BCDX2-ADP.AlFx and BCDX2-ADP.AlFx-ssDNA showing level of deuterium uptake after 3 (orange), 30 (red), 300 (blue) and 3000 (black) seconds. Positive values = exposure (red); negative values = protection (blue). Purple text = L1 loops. Orange text = L2 loops. RAD51B: 110 peptides, 97.7% coverage, 3.38 redundancy. RAD51C: 113 peptides, 98.1% coverage, 3.32 redundancy. RAD51D: 108 peptides, 98.5% coverage, 3.88 redundancy. XRCC2: 89 peptides, 97.9% coverage, 3.27 redundancy. c, Conservation of putative ssDNA binding arginine residues in the L1 loops of RAD51B, RAD51C, RAD51D and XRCC2. d, SDS-PAGE of mutant BCDX2 mutant proteins. For gel source data, see Supplementary Figure 1. Fluorescence anisotropy ssDNA binding curves in the absence of ATP (blue) or ADP (red) for e, BR217ACDX2 (n=3) and BR231ACDX2 (n=3), f, BCR258ADX2 (n=3) and BCR258HDX2 (n=3), g, BCDR221AX2 (n=3), and h, BCDX2R159A (n=3). n values are independent experiments. Lines denote quadratic curve fits. Each point and error bar denotes mean + s.d. i, Calculated ssDNA binding affinity constants (centre = KD values, error bars = 95% CI lower and upper limits) of BCDX2 arginine mutants. X axis = log10 scale. j, Bar chart (mean + s.d.) of ATP hydrolysis rate. Unpaired two-tailed t-test. All n=3, except wt which is n=6. n values represent independent experiments. k, Correlation of ssDNA binding affinity (errors = 95% CI) against fold increase in ssDNA ATPase stimulation (mean + s.d.). Curve fitting by exponential decay curve. l, Bar chart (mean + s.d.) of FRET fluorescence ratio (IA/ID) between 5′-Cy3-dN15nt or dN15nt-Cy3-3′ and BCDX2, BAF647CDX2 and BCDX2AF647. All n=3 independent experiments. Two tailed unpaired t-test.
Extended Data Fig. 9
Extended Data Fig. 9. Interplay between BCDX2 and RAD51 filaments.
a, RAD51 B binds to ssDNA and RAD51. b, Structure of the RAD51 filament (PDB = 5H1B) bound to ssDNA (left). Modelling of RAD51BCTD on RAD51-1 (rmsd = 1.024 Å) (right). Zoomed view (upper panels) showing engagement of RAD51R229/R241 and RAD51BR217/R231 with ssDNA. c, RAD51B interacts RAD51C during ATP hydrolysis, promoting high affinity ssDNA binding by the BCDX2 complex. d, Structural modelling of RAD51C binding a triplet of nucleotides in both RAD51C ground and active intermediate conformations.
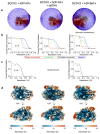
Fig. 1
Fig. 1. Cryo-EM structure of BCDX2.
a, Domain architectures of RAD51, RAD51B, RAD51C, RAD51D and XRCC2 protein subunits. NTD = N-terminal domain. b, Front and back views of the cryo-EM map (2.2 Å) and atomic model of BCDX2 in the presence of ADP.AlFx. c, Representative NS-EM 2D class averages of BCDX2 showing a mobile domain relative to the structural core. d, Representative 2D class average of chymotrypsin treated BCDX2. e, Recombinant BNTDCDX2 deleted for the RAD51BCTD.
Fig. 2
Fig. 2. Structural comparison between BCDX2 and RAD51 filaments.
a, Zoomed view of three RAD51 protomers (RAD51-1, RAD51-2, RAD51-3) (PDB:5H1B) aligned relative to RAD51BNTD-RAD51C-RAD51D-XRCC2. b, Comparison of the NTD-linker-α5 in RAD51-2 and RAD51D. c, Top views of the C-terminal RecA-like folds of three RAD51 protomers and RAD51C-RAD51D-XRCC2 subunits. The 25.2° anticlockwise rotation of RAD51C relative to RAD51-1 is indicated.
Fig. 3
Fig. 3. Structural insights into RAD51B, RAD51C, RAD51D and XRCC2 VUS.
Missense VUS mutations in the ClinVar database were extracted for RAD51B (21), RAD51C (811), RAD51D (689) and XRCC2 (283). a, In silico prediction of missense mutations which affect monomer stability of RAD51B, RAD51C, RAD51D or XRCC2. b, Hydrogen and ionic bonds between RAD51 paralogs, and associated VUS. c, Interaction diagram of hydrogen bonds and non-bonded contacts in the nucleotide binding sites of RAD51C, RAD51D and XRCC2. Density of the nucleotides and Mg2+ is shown as black mesh. Stratification of ClinVar mutations highlighted in Supplementary Table 1.
Fig. 4
Fig. 4. Coupled ATPase activities of RAD51B and RAD51C.
a, b, and c, Atomic models from the BCDX2-ADP.AlFx structure (2.2 Å) showing the binding of ATP by XRCC2 and RAD51D, and ADP by RAD51C. The Walker A lysine and threonine, Walker B aspartate, Mg2+ cations (magenta spheres) and water molecules (red dots) are indicated. Lysine fingers RAD51DK297 and RAD51CK308 that coordinate the XRCC2 and RAD51D active sites (respectively) and the catalytic glutamate RAD51CE161 are shown. Density of the nucleotide is shown as black mesh. d, Quantification of nucleotides bound by BCDX2 (n=7) and BK114ACDX2 (n=4) as measured by HPLC analysis. Mean + s.d. e, Quantification of nucleotides bound by BCDX2 following exchange with no nucleotide (n=7), ADP (n=3), ATP yS (n=3), or ATP (n=3). ATP (+5 hr) are repeat measurements of the ATP sample after 5 hours at room temperature (n=3). -Mg2+ is BCDX2 in the absence of magnesium cations (n=3). Mean + s.d. n values represent independent experiments. f, Quantification of ATPase activity (left) and nucleotides bound (right) for BCDX2 (ATPase: n=6; bound nucleotides = n=7), BE144ACDX2 (n=3), BCE161ADX2 (n=3), BE144ACE161ADX2 (n=3), BK324ACDX2 (n=3) and BCDX2K261A (n=3). Mean + s.d. n values represent independent experiments. g, Comparative HDX-MS analysis of BCDX2-ADP.AlFx vs BCDX2-ADP. Regions of exposure during AlFx release are indicated (red). Hybrid model contains cryo-EM determined atomic model of BNTDCDX2 with missing loops modelled, together with the AlphaFold2-predicted monomer model of RAD51BCTD. The catalytic glutamate residues RAD51BE144 and RAD51CE161, and lysine fingers RAD51BK324 and XRCC2K261, are highlighted. h, As (g) but mapped onto the AlphaFold2 multimer model of BCDX2. i, Extension of the RAD51CL1 helix and rotation of RAD51CR258 during RAD51C ATP hydrolysis and RAD51B binding. All statistics associated with this figure are found in Extended Data Fig. 5.
Fig. 5
Fig. 5. ATP hydrolysis by BCDX2 is required for RAD51 filament growth.
a, Representative NS-EM micrographs of RAD51 filaments formed in the absence or presence of BCDX2. Scale bar = 100 nm. b, Box plot (median, IQR, whiskers = 5 and 95 percentile) of RAD51 filament lengths formed in the absence (n=15,537 filaments) or presence (n=33,436 filaments) of BCDX2. Two-sided Mann-Whitney statistical test. c, Scatter plot (mean + s.d.) of RAD51 filaments per micrographs (n=631 micrographs) in the absence or presence of BCDX2. Unpaired two-tailed t- test. d, Kymographs showing the displacement of RPAmStrawberry by RAD51AF488 in the absence or presence of BCDX2. A schematic of the C-trap experimental set up with fluorescently labelled proteins is shown. e, Normalized fluorescence intensity for RAD51AF488 signal over time in the absence (n=5) and presence (n=6) of BCDX2. Shaded area represents SEM. Line represents exponential fit. n values represent independent experiments. f, Scatter plot (mean and s.d.) of apparent nucleation rates in the absence (n=5) or presence (n=6) of BCDX2. n values represent independent experiments. Unpaired two-tailed t-test. g, Scatter plot (median and IQR) of RAD51 filament growth and disassembly rates in the absence (n=65 filaments) and presence (n=64 filaments) of BCDX2. Two-sided Mann-Whitney test. h, Kymographs showing the displacement of RPAmStrawberry by RAD51AF488 in the absence or presence of BCDX2, BE144ACDX2, BCE161ACDX2 and BE144ACE161ACDX2. i, Normalized fluorescence intensity for RAD51AF488 signal over time in the absence (n=6) or presence of BCDX2 (n=6), BE144ACDX2 (n=6), BCE161ACDX2 (n=7) and BE144ACE161ACDX2 (n=6). Shaded areas represent SEM. Lines represent exponential fits. n values represent independent experiments.
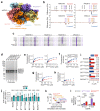
Fig. 6
Fig. 6. Interaction of BCDX2 with ssDNA and RAD51.
a, Changes in fluorescence anisotropy upon binding of wild-type BCDX2 to FAM-dN15nt ssDNA in the presence of ATP (n=17, blue), ADP.AlFx (n=3, purple) or ADP (n=12, red), and to FAM-dN30bp dsDNA (n=3, orange). Lines denote quadratic curve fits. Each point and error bar denotes mean + s.d. b, As a, but including binding of BE144ACDX2 (n=3, turquoise), BCE161ADX2 (n=3, magenta) and BE144ACE161ADX2 (n=3, brown) to FAM-dN15nt in the presence of ATP. n values are independent experiments. c, Calculated ssDNA binding affinity constants from curves in panels a and b (centre = KD values, error bars = 95% CI lower and upper limits). X axis = log10 scale. d and e, Kymographs showing binding of dual-labelled AF555/AF647 BCDX2, BE144ACDX2, and BCE161ADX2 to λ ssDNA in the absence or presence of unlabelled RAD51. f, Kymographs showing FRET between RAD51AF555 and BAF647CDX2. 1 = FRET between RAD51 and BCDX2. 2 = BCDX2 dissociates. 3 = RAD51 dissociates. g, Fluorescence intensity profile showing anti-correlated emission for AF555 and AF647. h, Comparative HDX-MS analysis of BCDX2-ADP.AlFx-ssDNA vs BCDX2- ADP.AlFx. Regions protected from deuterium uptake after 300 secs are indicated (blue). The L1 and L2 loops of RAD51B, RAD51C, RAD51D and XRCC2 and putative arginine residues that engage ssDNA are shown. Italicised are VUS, underlined are confirmed pathogenic mutations. Dashed orange line represents the putative path of ssDNA. i, Changes in fluorescence anisotropy upon binding of BCDX2, or the indicated mutants, to FAM-dN15nt ssDNA in the presence of ATP (all n=3, except wt n=17, n values are independent experiments). Results for wt originally shown in Fig 6a. Lines denote quadratic curve fits. Each point and error bar denotes mean + s.d.

References

    1. Venkitaraman AR. Cancer suppression by the chromosome custodians, BRCA1 and BRCA2. Science. 2014;343:1470–1475. - PubMed
    1. Golmard L, et al. Germline mutation in the RAD51B gene confers predisposition to breast cancer. BMC Cancer. 2013;13:484. - PMC - PubMed
    1. Song H, et al. Contribution of germline mutations in the RAD51B, RAD51C and RAD51D genes to ovarian cancer in the population. J Clin Oncol. 2015;33:2901–2907. - PMC - PubMed
    1. Meindl A, et al. Germline mutations in breast and ovarian cancer pedigrees establish RAD51C as a human cancer susceptibility gene. Nat Genet. 2010;42:410–414. - PubMed
    1. Pelttari LM, et al. RAD51C is a susceptibility gene for ovarian cancer. Hum Mol Genet. 2011;20:3278–3288. - PubMed

Publication types

MeSH terms