. 2023 Jun;618(7967):1057-1064.
doi: 10.1038/s41586-023-06228-9. Epub 2023 Jun 21.

Single-cell quantification of ribosome occupancy in early mouse development

Affiliations

Single-cell quantification of ribosome occupancy in early mouse development

Hakan Ozadam et al. Nature. 2023 Jun.

Abstract

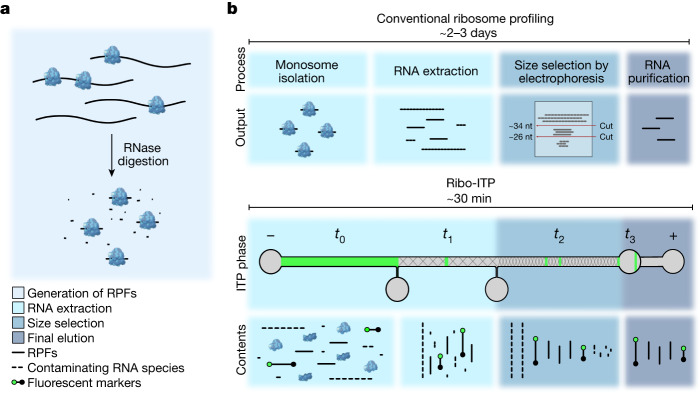
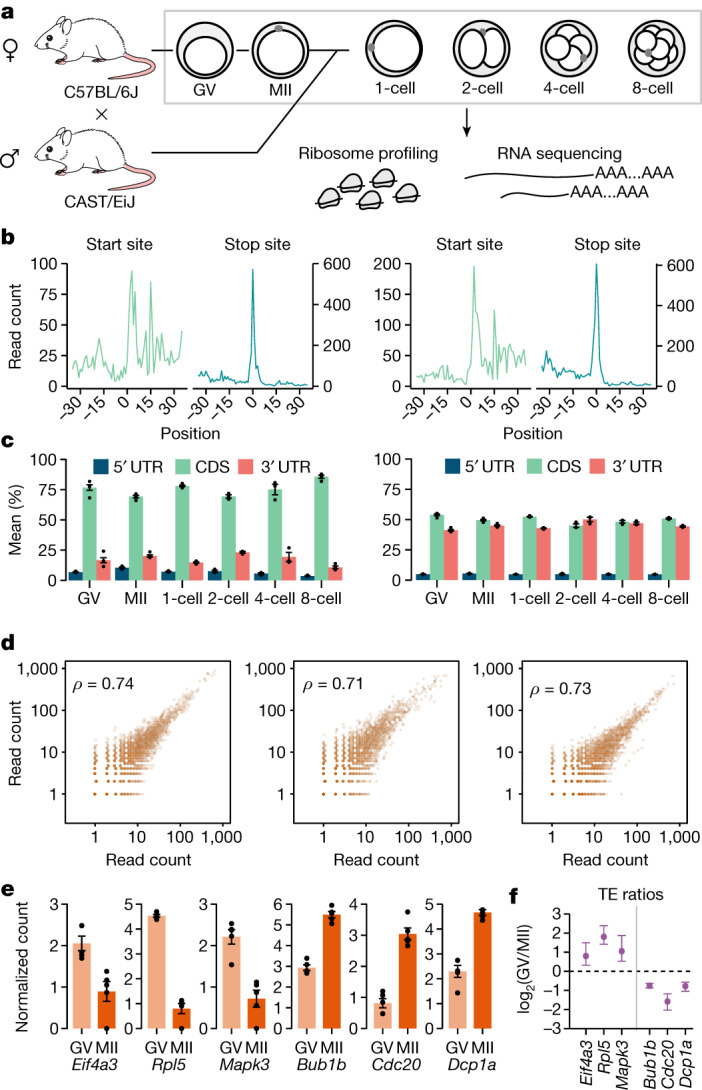
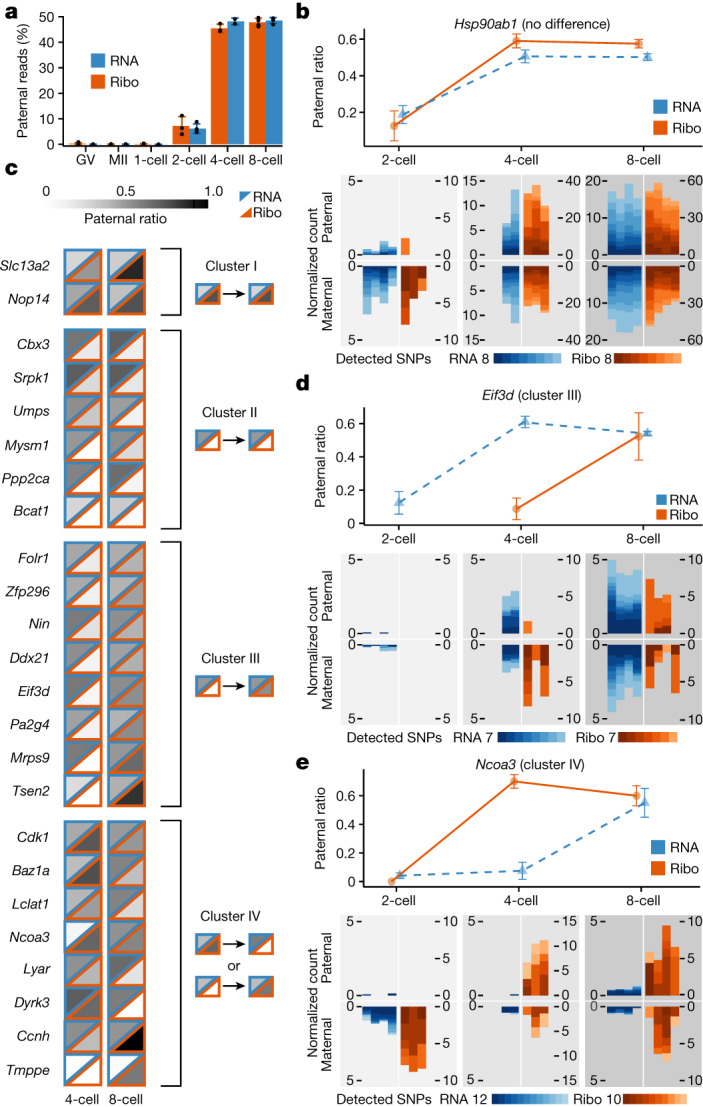
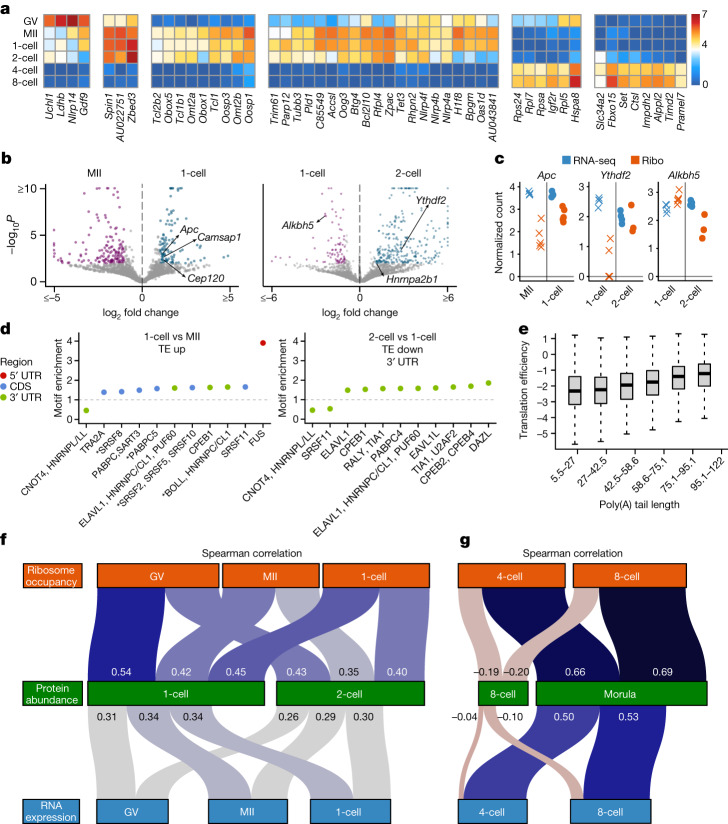
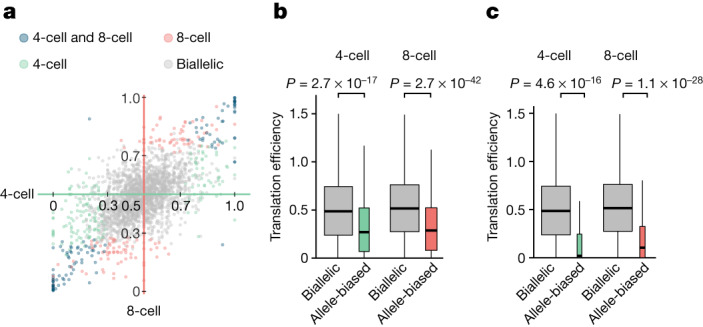
Translation regulation is critical for early mammalian embryonic development1. However, previous studies had been restricted to bulk measurements2, precluding precise determination of translation regulation including allele-specific analyses. Here, to address this challenge, we developed a novel microfluidic isotachophoresis (ITP) approach, named RIBOsome profiling via ITP (Ribo-ITP), and characterized translation in single oocytes and embryos during early mouse development. We identified differential translation efficiency as a key mechanism regulating genes involved in centrosome organization and N6-methyladenosine modification of RNAs. Our high-coverage measurements enabled, to our knowledge, the first analysis of allele-specific ribosome engagement in early development. These led to the discovery of stage-specific differential engagement of zygotic RNAs with ribosomes and reduced translation efficiency of transcripts exhibiting allele-biased expression. By integrating our measurements with proteomics data, we discovered that ribosome occupancy in germinal vesicle-stage oocytes is the predominant determinant of protein abundance in the zygote. The Ribo-ITP approach will enable numerous applications by providing high-coverage and high-resolution ribosome occupancy measurements from ultra-low input samples including single cells.


Conflict of interest statement

US patent application no. 63/286,531, entitled ‘Ribosome profiling via isotachophoresis’ by C.C. and C.M.H., and international patent application no. PCT/US2022/080982 based on US serial no. 63/286,531, entitled ‘Ribosome profiling via isotachophoresis’ by C.C. and C.M.H. were filed in the Name of Board of Regents, The University of Texas System et al.

Figures

Fig. 1
Fig. 1. Schematic of Ribo-ITP.
a, Schematic of the generation of RPFs. Following RNase digestion, RPFs are isolated with the conventional or Ribo-ITP approach. b, Schematic of the conventional ribosome profiling protocol and the Ribo-ITP process for extraction of RPFs. In Ribo-ITP, marker oligonucleotides with a 5′ fluorophore (green circle) and 3′ ddC blocking modification (black circle), which encapsulate the size range of RPFs, are added to the digested cellular lysate. Lysate contents are loaded into the channel (t0), then an electrical current is applied to a selectively focus species of a specific electrophoretic mobility range, enabling nucleic acid extraction by ITP. Nucleic acids are extracted in a narrow ITP band and then size selected as they migrate through 5% (t1) and 10% (t2) polyacrylamide gels, respectively. At the end of the run, purified and size-selected RNAs are collected (t3).
Fig. 2
Fig. 2. Characterization of the Ribo-ITP method and validation of efficacy in ultra-low input ribosome profiling.
a, Representative gel images highlighting inputs (I), RNAs recovered by Ribo-ITP (R) and gel electrophoresis (G) are shown (left). Four RNAs of 17, 21, 25 and 29 nt (Z) used in the experiment were radioactively labelled at their 5′ end. The per cent yield was calculated for the 25 nt RNA (right). b, Representative gel image of a size selection experiment (n = 3 from two independent experiments). Of MNase-digested RNA from K562 cells (D), 100 ng was used as an input (I) for Ribo-ITP after the addition of the two fluorescent marker oligonucleotides (M). In a typical experiment, we collected the sample flanked by the two fluorescent nucleotide markers (fraction 2). Here we also collected the RNAs that eluted before the arrival of the shorter fluorescent marker (fraction 1) as well as the RNAs that were located behind the longer fluorescent marker (fraction 3), which typically remain in the channel. The per cent yield of RNAs larger than the longer fluorescent marker oligonucleotide (more than approximately 36 nt) (blue) and RNAs flanked by the markers (orange), corresponding to the size range of RPFs, are plotted for each fraction. c, Schematic of the sequencing library preparation protocol. In a single-tube reaction, isolated RPFs are 3′ dephosphorylated and poly(A)-tailed. A template-switching reverse transcriptase (RT) creates templates that incorporate unique molecular index-containing adapters. d, Pairwise correlation of gene-level ribosome occupancy measured in conventional ribosome profiling and Ribo-ITP from human K562 cells (right plot). The left plot highlights two replicates of conventional ribosome profiling experiments from approximately 10 million cells. The middle plot is from two replicates of Ribo-ITP with approximately 100 cells. For the right plot, we used the mean number of counts per million reads for each gene. The Spearman correlation coefficients between the gene-level ribosome occupancies are indicated in the top left corner.
Fig. 3
Fig. 3. Ribo-ITP enables single-cell and single-embryo measurements of ribosome occupancy.
a, Schematic of the mouse experiments. Unfertilized oocytes (germinal vesicle (GV) and MII stage) from the C57BL/6J strain along with zygotes to the eight-cell-stage embryos from a crossbreed of two strains (C57BL/6J and CAST/EiJ) were collected for RNA expression and ribosome occupancy measurements. b, Ribosome occupancy around the translation start and stop sites in a representative zygote (one cell; left) and an eight-cell-stage embryo (right). Translation start (or stop) sites are denoted by the position 0. Aggregated read counts (y axis) relative to the start (or stop) sites are plotted after A-site correction (Methods). c, Distribution of reads across transcript regions (5′ UTR, CDS and 3′ UTR) are shown (left). The distribution of the lengths of these regions weighted by their ribosome occupancy are also depicted (right). The error bars indicate the standard error of the mean percentages. d, Pairwise correlation of gene-level ribosome occupancy in single cells (GV mouse oocyte (left), MII mouse oocyte (middle) and one-cell mouse embryo (right)) are plotted along with Spearman correlation coefficients (top left). e, The standard error and mean of the centred log ratio of the ribosome occupancy (y axis) were plotted for representative transcripts that were previously shown to have increased polysome association in GV-stage (e) or MII-stage (f) oocytes (remaining genes are shown in Supplementary Fig. 12). f, Translation efficiency was calculated by dividing ribosome occupancy by RNA expression for germinal vesicle-stage and MII-stage oocytes. For the selected transcripts, the log ratio of translation efficiency between these two stages is plotted along with the standard error of the mean across replicates.
Fig. 4
Fig. 4. Allele-specific translation and RNA expression in early mouse development.
a, Strain-specific SNPs were used to assign sequencing reads to the paternal and maternal allele (Methods). The standard error and mean of the percentage of paternal reads in each stage (y axis) are plotted. b,d,e, Line plots (top) indicate the percentage of paternal reads (y axis) in RNA-seq and Ribo-ITP experiments. The reads are combined across replicates, and error bars indicate the standard error of the mean of paternal ratios. Maternal and paternal read counts per 10,000 are also plotted for all individual replicates and SNPs (bottom). The total number of detected coding SNPs and their corresponding colours are shown with colour scales. c, The percentage of paternal reads is indicated by different shades of grey for ribosome occupancy (lower triangles with orange borders) and RNA expression (upper triangles with blue borders). Genes that displayed differential ribosome engagement in an allele-specific manner compared with RNA expression were grouped into four clusters. The prototypical shared pattern in each cluster is displayed on the right.
Fig. 5
Fig. 5. Differential translation efficiency between developmental stages and association between ribosome occupancy and protein abundance.
a, Fifty genes with the highest variability in ribosome occupancy across developmental stages are plotted (Methods). The colours correspond to the mean of the centred log ratio of ribosome occupancy. b, Volcano plots depict the statistical significance (y axis) and log2 fold change (x axis) in translation efficiency between two developmental stages (Methods). Coloured points indicate transcripts with significant differences (false discovery rate of less than 0.01). c, The centred log-ratio normalized read counts from Ribo-ITP and RNA-seq experiments are plotted for the highlighted genes. All replicate measurements from the given developmental stage are shown. d, Enrichment and depletion of RBP motifs were determined by Transite (Benjamini–Hochberg P < 0.0001; Supplementary Table 5) and annotated with oRNAment RBPs. RBPs that share the same consensus motif are comma-delimited, and RBPs with no detectable expression are marked with an asterisk. TE, translation efficiency. e, Transcripts were grouped by their mean poly(A) tail length in the zygote into six equal-sized bins. The distribution of their corresponding translation efficiencies (Methods) is visualized using boxplots. The horizontal line corresponds to the median, the box represents the interquartile range and the whiskers extend to 1.5 times the interquartile range. f,g, Sankey diagrams depict the relationships between protein abundance with RNA expression and ribosome occupancy. The colour and thickness of the links connecting the nodes are proportional to the strength of the corrected Spearman rank correlation (Methods).
Fig. 6
Fig. 6. Translation efficiency of transcripts with allele-specific bias in RNA expression.
a, For each transcript, we aggregated RNA expression across replicates and phased SNPs to determine the ratio of reads supporting the paternal allele to the total. Genes are coloured by allelic bias in RNA expression in four-cell-stage (x axis) and eight-cell-stage (y axis) embryos. b, For the four-cell-stage and eight-cell-stage embryos, translation efficiency (that is, ribosome occupancy divided by RNA expression) of allele-biased and biallelic genes was compared using two-sided Wilcoxon rank sum tests. c, Translation efficiency of biallelic genes was compared with those that are monoallelically expressed (paternal ratio of 0 or 1). In the boxplots, the horizontal line corresponds to the median, the box represents the interquartile range and the whiskers extend to 1.5 times the interquartile range.
Extended Data Fig. 1
Extended Data Fig. 1. Ribo-ITP design enables efficient RNA extraction and size selection.
a, The top view of the ITP chip layout designed with SOLIDWORKS (units in mm). The thickness of the channel features was 375 µm and that of the rectangular base was 1.5 mm. Linear tapering was applied from the rectangular base to the outer edge (rounded rectangle). b, Microfluidic device setup; indicating lysate, extraction, and size-selection channels; trailing electrolyte (TE) and leading electrolyte (LE) reservoirs; and elution well. Buffers corresponding to each channel and reservoir are color coded. Marker oligonucleotide fluorescence is denoted by green. c, Gel image displays the relative mobilities of fluorescent markers used in Ribo-ITP (M) along with the Zymo Research R1090 small RNA ladder (Z) and synthetic RNA oligonucleotides (S) (n = 1). d, Given that pH is the critical factor determining dephosphorylation efficiency, we determined the impact of Ribo-ITP collection on the conductivity and pH of the dephosphorylation buffer. We found negligible pH change (right axis, blue) and only a 11.0% ± 1.83% (SEM) change in conductivity (left axis, green) for the collection distance (5mm, denoted by the vertical line) used in Ribo-ITP. e, Representative gel images of control inputs (I), Ribo-ITP elutions (R), and gel extraction (G) samples. Four RNA species (17, 21, 25, and 29 nt) were used with total inputs of 20 and 40 ng. Fluorescent marker oligonucleotides were spiked into control and gel extraction samples prior to gel visualization. f, Gel image quantification of control inputs (gray), Ribo-ITP elutions (orange), and gel extraction (purple) samples (n = 4). Minimum, maximum, and average values are represented by the box and the horizontal bar. Only the 25 and 29 nt RNA marker bands were quantified for the yield calculation. g, Inputs (I, gray) were prepared by adding 40 ng of RNA to lysates from ~1,000 K562 cells. The RNA consisted of four species ranging from 17 to 29 nt in length. Fluorescent marker DNAs were added to Ribo-ITP samples (R) in addition to EGTA (10 mM). RNA extraction and isolation was done with Ribo-ITP followed by visualization using gel electrophoresis. h, Yield of the 25 and 29 nt RNAs was quantified and plotted for two replicates (84% and 91%).
Extended Data Fig. 2
Extended Data Fig. 2. Comparison between Ribo-ITP and conventional ribosome profiling.
Ribo-ITP experiments from ~100-cells were compared to the conventional ribosome profiling from ~10M cells for all panels. a, Transcripts with at least one count per million (cpm) in at least two out of three replicates were selected. Log2 of mean cpm (x-axis) was plotted against the square root of the standard deviation of cpm (y-axis). Green (Ribo-ITP) and red (conventional) points represent individual transcripts with mean log2(cpm) > 2. b, The percentage of clipped reads that mapped to ribosomal RNAs was calculated using RiboFlow. The mean and its standard error were shown (n = 3; see also Supplementary Table 1). c, In the metagene plots, position 0 corresponds to the start (left, light green) or stop (right, dark green) site. Ribosome footprints were adjusted according to their A-site offsets. One representative replicate for each method is plotted. d, The mean percentage of specific read lengths among the total mapped reads is plotted. Ribbons around the lines represent standard error of the mean. e, The percentage of ribosome profiling reads mapped to the CDS is indicated for each experiment (left). Single cell data from K562 cells were generated using either RNase I digestion (1-1, 1-2, 1-3) or MNase (1-4, 1-5). The sum of weighted counts across transcripts were plotted for comparison (right). The weighted sum was calculated for each transcript by multiplying its region length by the total number of ribosome footprints. f, Ribosome footprints from Ribo-ITP and the conventional method were used to calculate the mean fraction of reads mapping to each reading frame (Methods). Error bars indicate the standard error of the mean of replicates.
Extended Data Fig. 3
Extended Data Fig. 3. Quality Control for single cell and single embryo measurements of ribosome occupancy and RNA expression.
a, The number of reads (x-axis) is plotted against the number of detected genes (y-axis). Three representative replicates are shown for each stage of development used for single cell ribosome profiling experiments and from GSE162060 (Pro02_TCGTCAGTAC, Pro05_CCAATCCAGG and Dis01_TCGCTCTGCT). The three mouse cells highlighted from GSE162060 were selected to represent median coverage in that study. The total number of detected genes using all CDS mapping reads is indicated along with genes detected with 1.25k, 2.5k, 5k, 10k, 20k, 30k and 40k sub-sampled coding regions mapping UMIs. The inset plot shows the zoomed-in version of the same data in the x-axis from 0 to 5k. b, Ribosome footprints from n = 15 single cell Ribo-ITP samples from GV, MII and 1-cell stages were used to calculate the fraction of reads mapping to each reading frame (Methods). Error bars indicate the standard error of the mean of replicates. c, Metagene plots of translation start and stop sites from a representative RNA-Seq experiment. In contrast to the ribosome profiling data, there is no detectable peak observed at translation start or stop sites. d, Metagene plots of translation start and stop sites from a representative Ribo-ITP experiment using a 2-cell or a 4-cell stage mouse embryo. Start sites (light green, left) and stop sites (dark green, right) are at position 0 on the x-axis. Positions of the aligned reads are adjusted according to their A-site offsets. e, CDS-mapping read counts from each transcript were used to compute the Spearman correlation coefficient. Ribo-ITP (orange) and RNA-Seq (blue) experiments are ordered by developmental stage. The colors indicate the strength of the correlation.
Extended Data Fig. 4
Extended Data Fig. 4. Ribosome occupancy in GV- and MII-stages of transcripts with previously identified differential polysome association.
a, The mean of centered log-ratio of ribosome occupancy (y-axis) was plotted along with the standard error of the mean. These transcripts were identified as having increased polysome association in the MII-stage compared to GV-stage. b, Similar to panel a with the exception that these transcripts were found to display decreased polysome association in the MII-stage compared to the GV-stage. c, log2 ratio of translation efficiencies (ribosome occupancy/RNA expression) for the highlighted genes in GV compared to MII stage oocytes are plotted along with their standard error. The vertical bar separates genes in panel a from b.
Extended Data Fig. 5
Extended Data Fig. 5. Allele-specific ribosome occupancy and RNA expression.
a, Reads from RNA-seq experiments that overlap strain-specific SNPs were used to determine the percentage of reads that match the maternal (green) and paternal (red) allele. A small percentage of reads differed from either allele and are labeled as “other” (dark blue). b, Ribosome footprints from Ribo-ITP experiments were used as in panel a. c, The percentage of RNA sequencing reads that originate from the paternal allele was visualized for genes with at least 10 allele-specific reads at each stage. d, The percentage of ribosome footprints that were assigned to the paternal allele was plotted for the set of genes in panel c.
Extended Data Fig. 6
Extended Data Fig. 6. Representative genes with allele-specific difference in ribosome occupancy and RNA expression.
Line-plots (top) indicate the mean percentage of paternal reads (y-axis) in RNA-Seq and Ribo-ITP experiments. The reads are combined across replicates and error bars indicate standard error of the mean of paternal ratios. At the bottom, maternal and paternal reads counts per 10k are plotted for all individual replicates and SNPs. The total number of detected coding SNPs and their corresponding colors are shown with color scales. Each vertical bar corresponds to a replicate experiment. a, Representative gene with no difference in allele- specific ribosome occupancy compared to RNA expression. b, Representative gene from Cluster I (Fig. 4). c, Representative gene from cluster II (Fig. 4). d, Representative gene from cluster III (Fig. 4) with delayed engagement of ribosomes in allele- and stage-specific manner i.e. parental RNA expression is observed at or before the 4- cell stage, yet these RNAs predominantly engage with ribosomes only in the 8-cell stage. e,f, Representative genes from Cluster IV (Fig. 4).
Extended Data Fig. 7
Extended Data Fig. 7. Differential translational efficiency and enrichment of RBP motifs across stages in oocyte and embryonic development.
a, The oRNAment matrix similarity score was computed for maternal and paternal SNPs that intersect RBP motifs, and the max absolute difference in scores was determined. SNP-motifs in the 95th percentile of the absolute differences are shown. A positive difference (yellow) indicates the paternal SNP more closely matches the RBP motif, while a negative difference (blue) indicates a better match for the maternal SNP. RBPs with a shared motif are comma-delimited. SNP coordinates are relative to the mm10 build. b, Schematic of a predicted upstream open reading frame (uORF) in Tmppe. uORF value and intensity of fill indicate the efficiency of the corresponding non-canonical translation initiation sites from mouse PD-31 cells. c, The mean ratio of allele-specific reads in ribosome profiling (n = 4) to RNA-seq (n = 4) was plotted after aggregating data across SNPs and experiments. Each experiment is normalized to 10k SNP-informative reads to account for differences in sequencing depth. The error bars correspond to the 80% confidence interval calculated using bootstrap sampling of replicates. A pseudocount of 0.5 was added to both normalized RNA-seq and ribosome profiling counts. d,e, Volcano plots depict the statistical significance (y-axis) and log2 fold-change (x-axis) in translation efficiency between the GV- to MII-stage oocytes and between the 2-cell to 4-cell stage embryos. The purple and blue points indicate transcripts with a significant difference in translation efficiency between the compared stages (FDR < 0.01). f, Enrichment and depletion of RBP motifs in genes with increased TE between MII and GV stages was determined by Transite (Benjamini-Hochberg adjusted p-value < 0.0001, Supplementary Table 5) and annotated with oRNAment RBPs. RBPs that share the same consensus motif are comma-delimited, and RBPs with no detectable expression are marked with an asterisk.
Extended Data Fig. 8
Extended Data Fig. 8. Relationship between RNA expression, translation and protein abundance across embryonic stages.
a, Venn diagram of the overlap between the sets of transcripts that are reduced in RNA abundance or translational efficiency upon fertilization (MII-oocyte to the zygote transition). b, The mean poly(A) tail length and translation efficiency was calculated using data from 2-cell stage embryos (n = 3 Ribo-ITP; n = 4 RNA-Seq; see Methods). The boxes correspond to interquartile range and the horizontal lines indicate the median. c, Mean translation efficiency and its 90% confidence interval are plotted for PABPC1 along with its mean poly(A) length in 1-cell (n = 5 Ribo-ITP; n = 4 RNA-Seq) and 2-cell embryos. d,e,f, Pairwise correlation between protein abundance and d, RNA expression or e, Ribosome occupancy or f, Translation efficiency. Spearman correlation coefficient with Spearman’s correction is reported inside the heatmaps. g,h, Sankey diagrams depict the relationships between translation efficiency and protein abundance. The color and the thickness of the paths connecting the nodes are proportional to the correlation coefficient.
Extended Data Fig. 9
Extended Data Fig. 9. Translation efficiency of genes with allelic-biased RNA expression.
For all plots, boxes correspond to interquartile range and the horizontal lines indicate the median. The whiskers extend from the hinge to at most 1.5 times the interquartile range. P-values are calculated using the two-sided Wilcoxon rank sum test. Translation efficiency is defined by average ribosome occupancy (MII n = 5, 1-cell n = 5, 4-cell n = 3, 8-cell n = 4) divided by average RNA expression (MII n = 4, 1-cell n = 4, 4-cell n = 2, 8-cell n = 4) a, Translation efficiency is plotted for two bi-allelic genes (Anapc7 and Plpp5), two maternally biased genes (Tesc and Tubg2) and two paternally biased genes (Prkcz and Shc3). Vertical bars indicate 95% confidence intervals of bootstrap sample based variability in translation efficiency. Horizontal lines depict the median translation efficiency of all bi-allelic genes. b, Translation efficiency of unbiased (bi-allelic), paternally and maternally biased genes are plotted. c, We define a high-confidence set of allelic-biased transcripts that are supported by more than one SNP (Methods). The scatter plot, on the left, shows the paternal ratios of the genes in 4-cell (x-axis) and 8-cell (y-axis) stages. Genes are colored by their allelic bias and unbiased genes are colored in gray. d, A nearest neighbor matching method was used to select a subset of bi-allelic genes with matched distribution of RNA expression and CDS length compared to the allele-specific genes (Methods). e,f, The genes with allele-biased expression at the 4-cell and 8-cell stages were compared to other genes with respect to their translation efficiency at the 1-cell and MII stages. The bi-allelic genes were matched to allele-specific ones with respect to RNA expression levels and CDS lengths. g,h For each transcript, the x-axis represents the mean RPKM in RNA-seq and the y-axis is the corresponding mean translation efficiency. Genes with allelic expression bias are colored.
Extended Data Fig. 10
Extended Data Fig. 10. RNA expression measurements using Smart-seq3 do not exhibit a systematic bias as a function of poly(A) tail length.
poly(A) tail length of transcripts from mouse GV-stage oocytes were retrieved from two previous studies a, Tail-Seq (n = 3) or b, PAIso-seq (n=2). Spearman rank correlation coefficients between our RNA-Seq measurements and poly(A) tail length was shown in the top left corners highlighting the lack of a strong relationship between the two variables for both Tail-Seq and PAIso-seq. c, Transcripts with shortest poly(A) tails (<35nt corresponding to the lowest 1% in TAIL-Seq and the lowest 3.7% in PAIso-seq) were compared to all other transcripts with respect to RNA expression measured by Smart-Seq3. The median of the distribution is shown with the horizontal line. The box depicts the interquartile range, the whiskers extend from the hinge to at most 1.5 times the interquartile range. d, Our RNA-seq measurements from zygotes using Smart-seq3 (n = 4), which uses oligo(dT) priming, was compared to measurements using SUPeR-Seq (n = 5), which provides poly(A) independent quantification. Spearman rank correlation between the two approaches is shown (p-value < 2.2 × 10⁻¹⁶). e, The log2 ratio of SUPeR-Seq to Smart-seq3 expression values (y-axis) were calculated for each gene and grouped by their respective poly(A) tail lengths (x-axis) as previously reported. While there is not a systematic bias in expression measurements as a function of poly(A) tail length, transcripts with the shortest tails (<17nt) were slightly underestimated in Smart-seq3 (Kruskal-Wallis rank sum test; p-value 0.016).

References

    1. Vastenhouw NL, Cao WX, Lipshitz HD. The maternal-to-zygotic transition revisited. Development. 2019;146:dev161471. doi: 10.1242/dev.161471. - DOI - PubMed
    1. Zhang C, Wang M, Li Y, Zhang Y. Profiling and functional characterization of maternal mRNA translation during mouse maternal-to-zygotic transition. Sci. Adv. 2022;8:eabj3967. doi: 10.1126/sciadv.abj3967. - DOI - PMC - PubMed
    1. Wang Q, Chung YG, deVries WN, Struwe M, Latham KE. Role of protein synthesis in the development of a transcriptionally permissive state in one-cell stage mouse embryos. Biol. Reprod. 2001;65:748–754. doi: 10.1095/biolreprod65.3.748. - DOI - PubMed
    1. Lee MT, Bonneau AR, Giraldez AJ. Zygotic genome activation during the maternal-to-zygotic transition. Annu. Rev. Cell Dev. Biol. 2014;30:581–613. doi: 10.1146/annurev-cellbio-100913-013027. - DOI - PMC - PubMed
    1. Li L, Zheng P, Dean J. Maternal control of early mouse development. Development. 2010;137:859–870. doi: 10.1242/dev.039487. - DOI - PMC - PubMed

Publication types