. 2023 Jul;619(7969):348-356.
doi: 10.1038/s41586-023-06231-0. Epub 2023 Jun 21.

B-cell-specific checkpoint molecules that regulate anti-tumour immunity

Affiliations

B-cell-specific checkpoint molecules that regulate anti-tumour immunity

Lloyd Bod et al. Nature. 2023 Jul.

Erratum in

  • Author Correction: B-cell-specific checkpoint molecules that regulate anti-tumour immunity.
    Bod L, Kye YC, Shi J, Torlai Triglia E, Schnell A, Fessler J, Ostrowski SM, Von-Franque MY, Kuchroo JR, Barilla RM, Zaghouani S, Christian E, Delorey TM, Mohib K, Xiao S, Slingerland N, Giuliano CJ, Ashenberg O, Li Z, Rothstein DM, Fisher DE, Rozenblatt-Rosen O, Sharpe AH, Quintana FJ, Apetoh L, Regev A, Kuchroo VK. Bod L, et al. Nature. 2025 Apr;640(8057):E1. doi: 10.1038/s41586-025-08858-7. Nature. 2025. PMID: 40097822 No abstract available.

Abstract

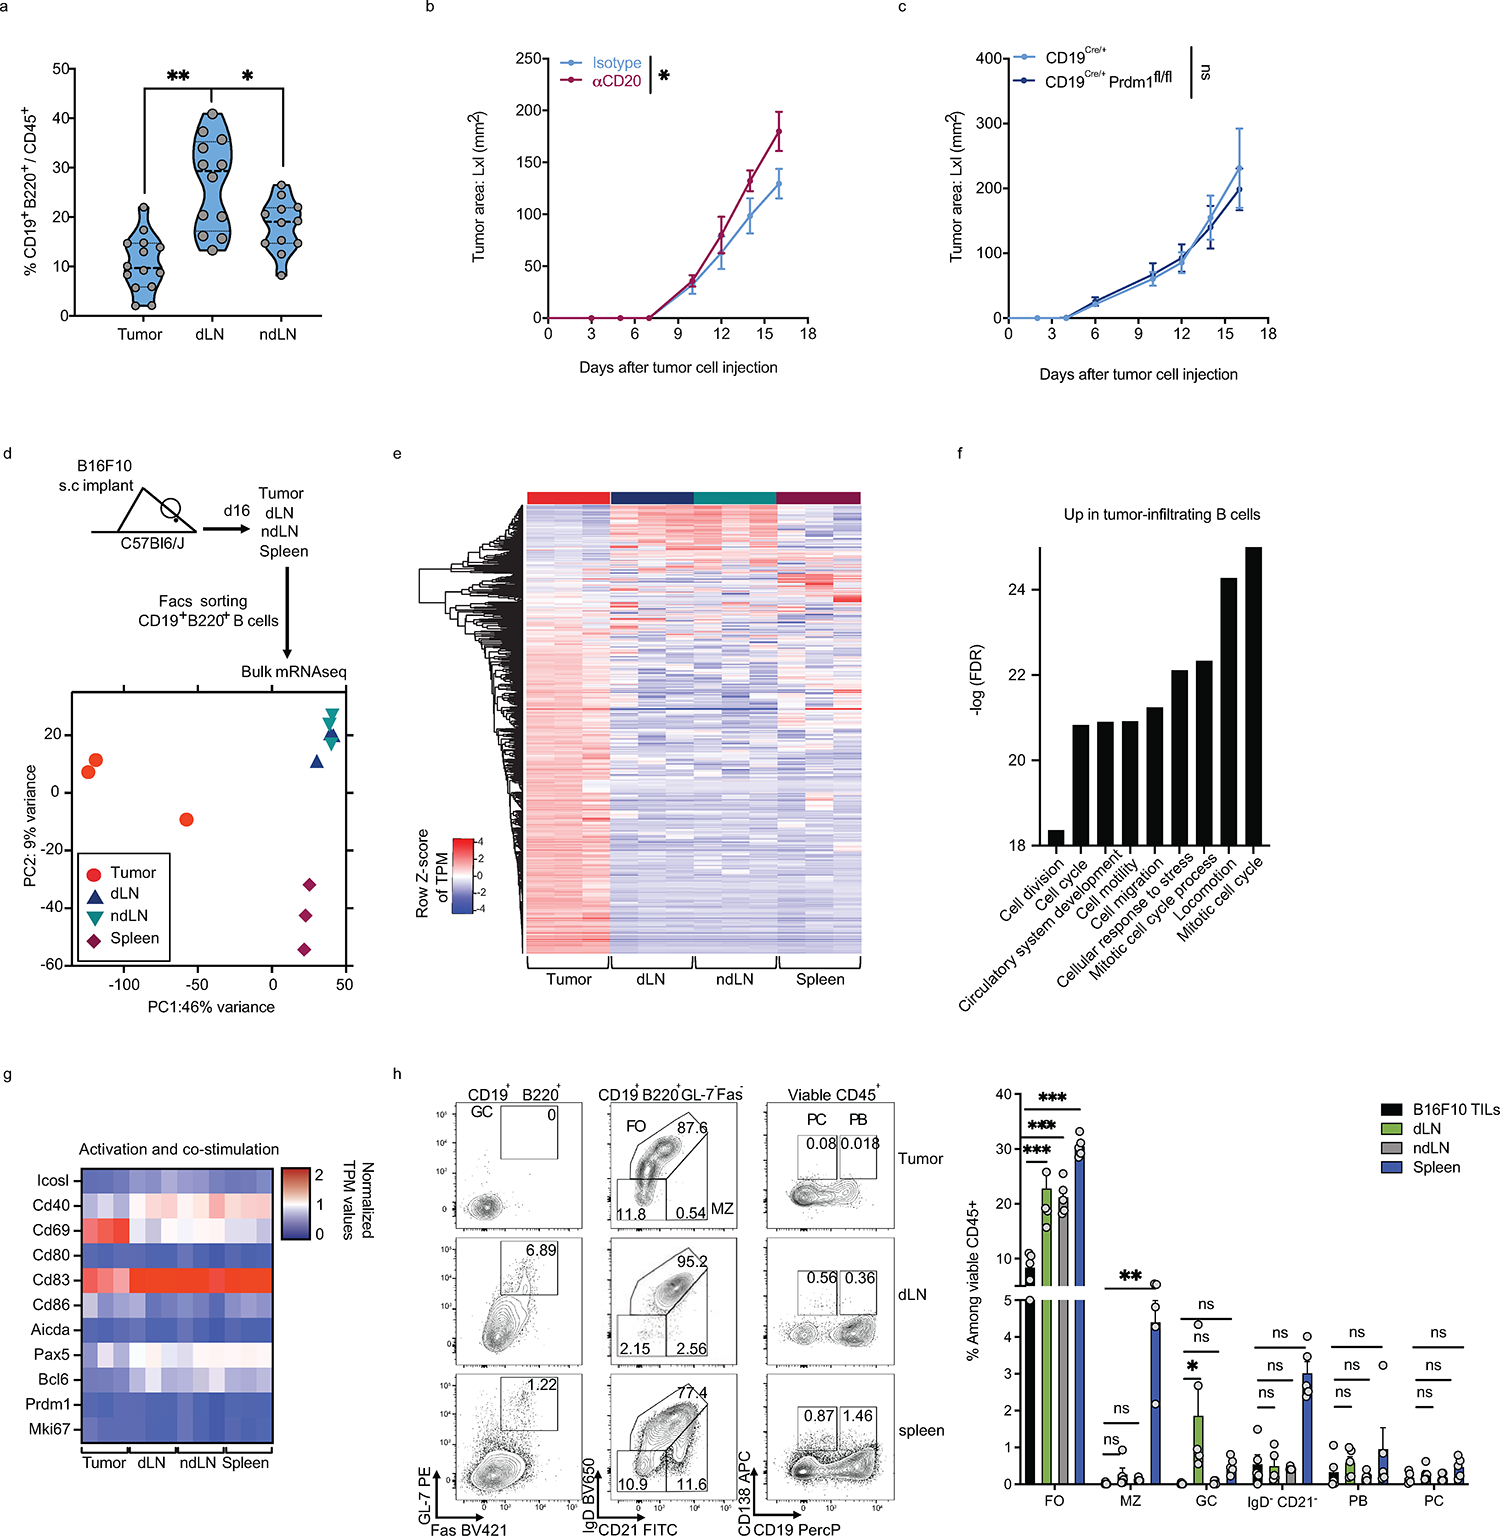
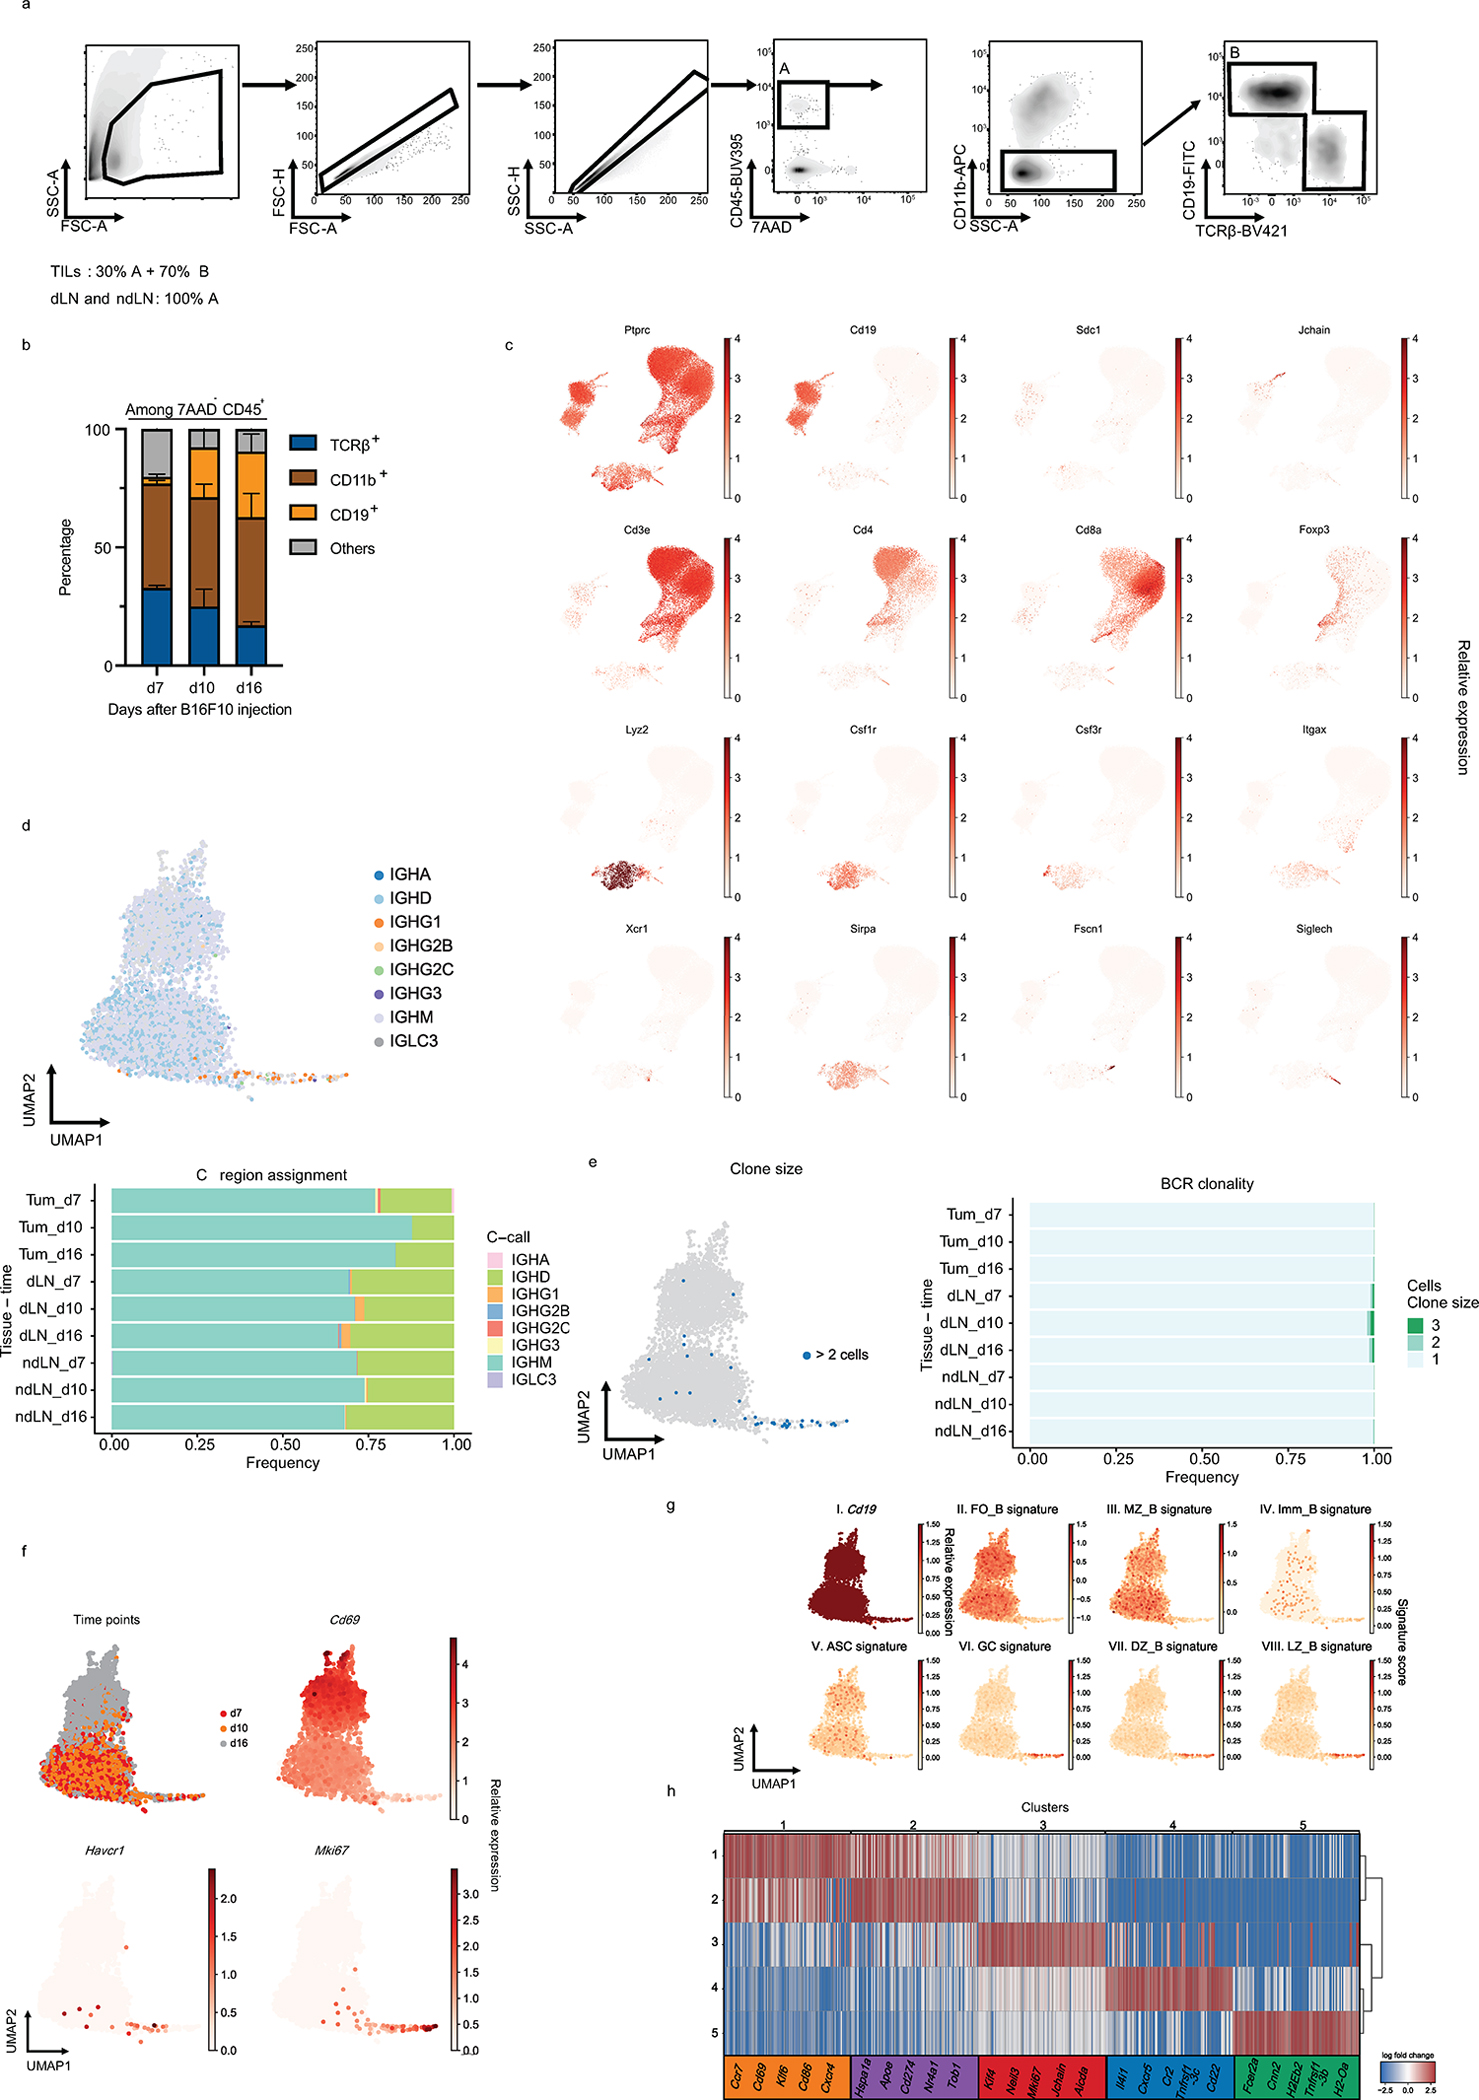
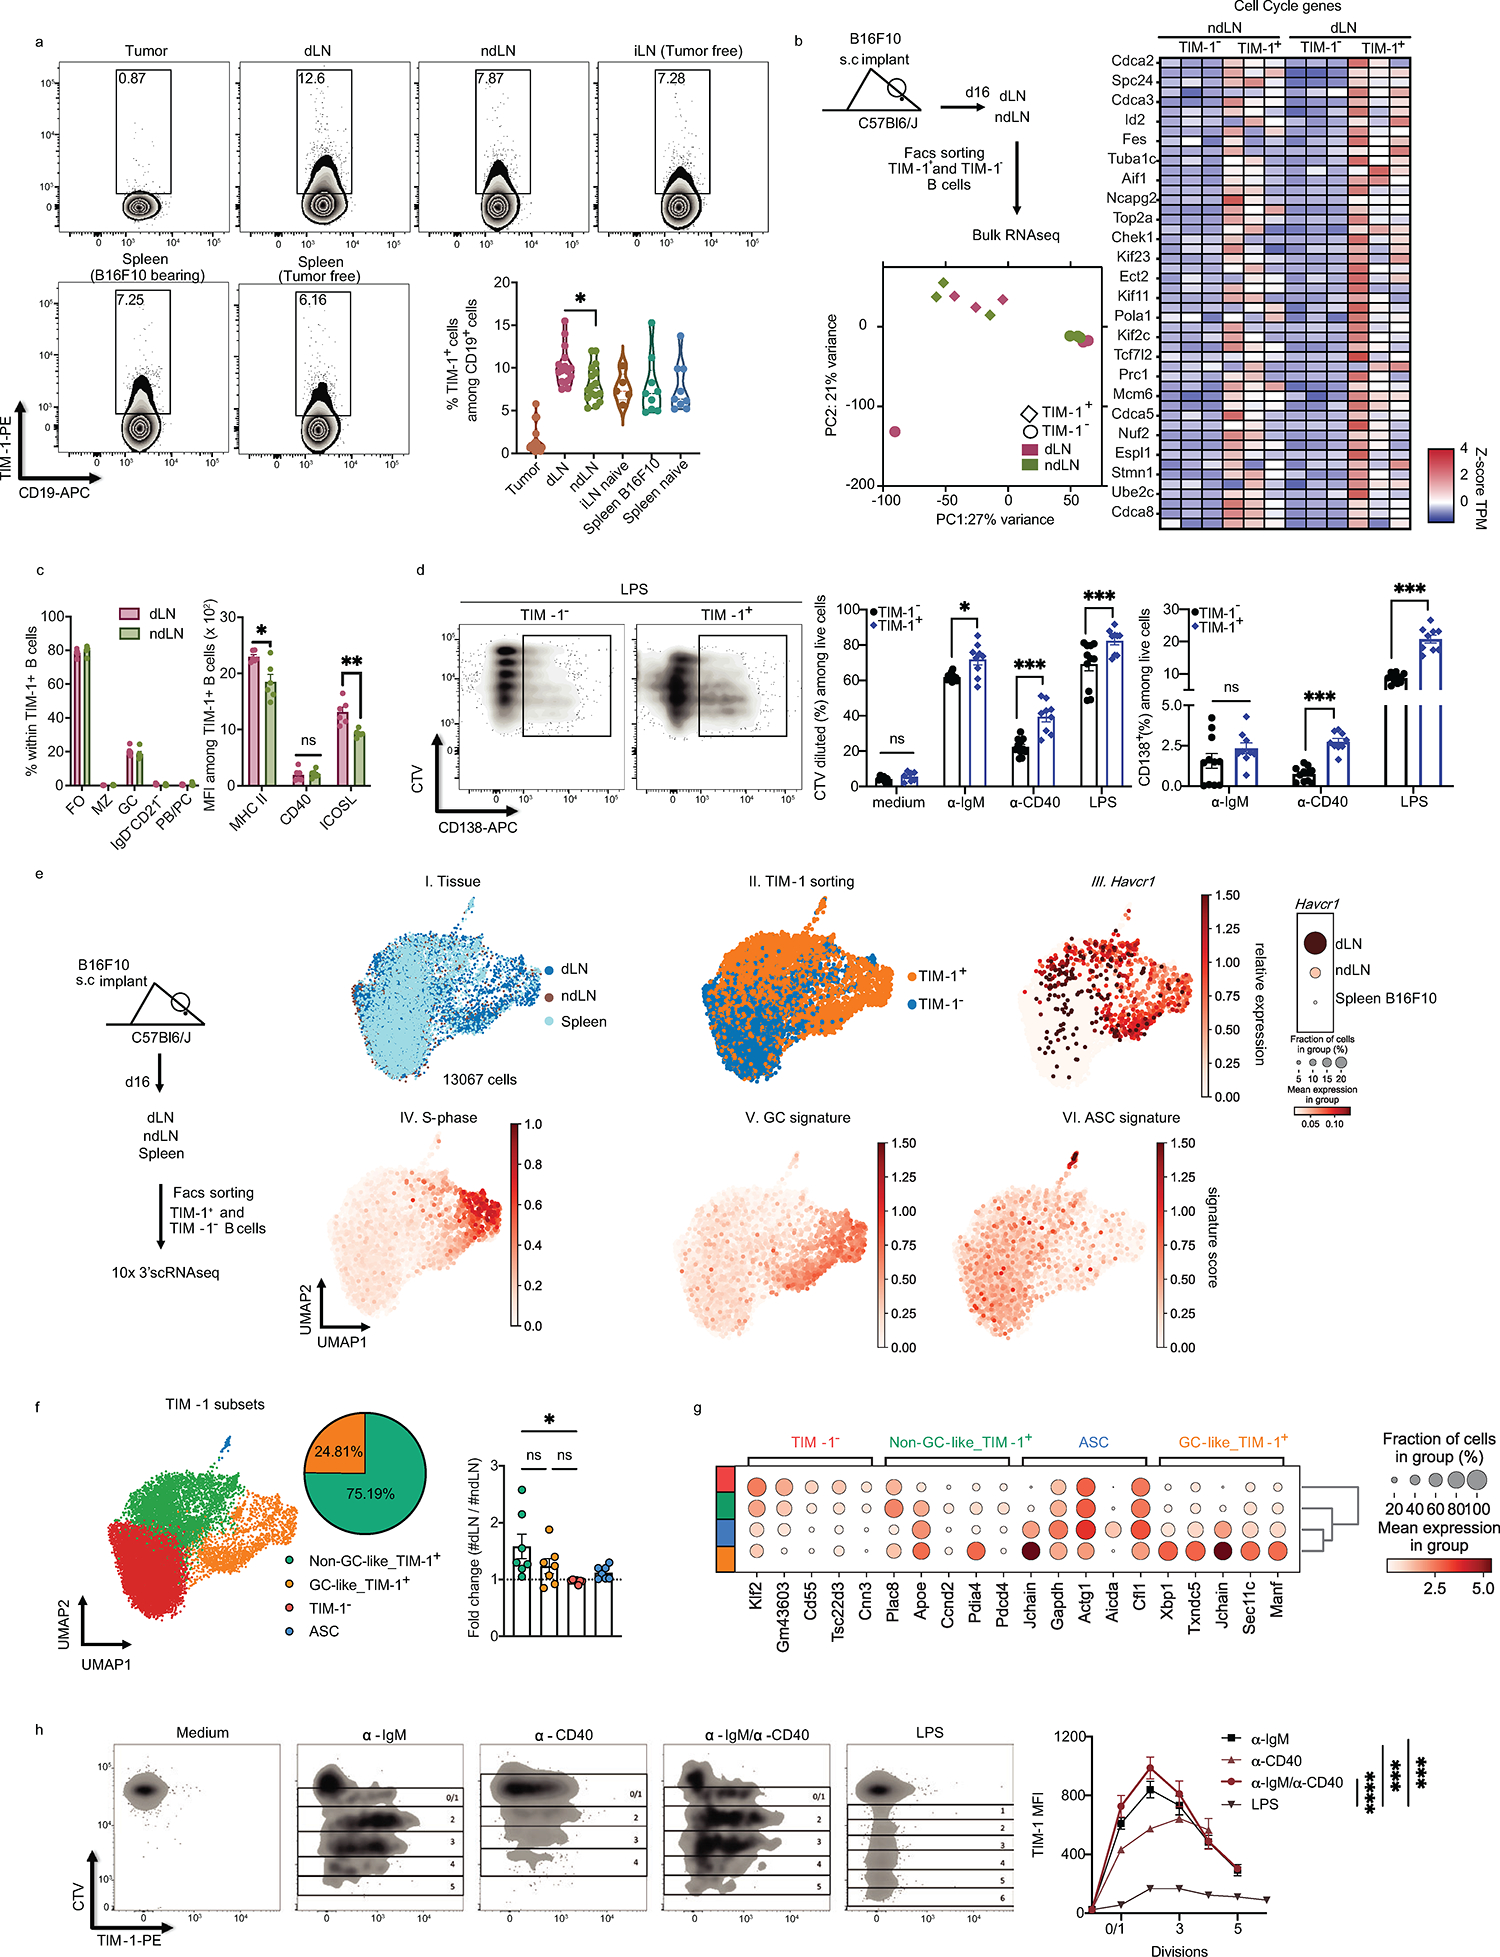
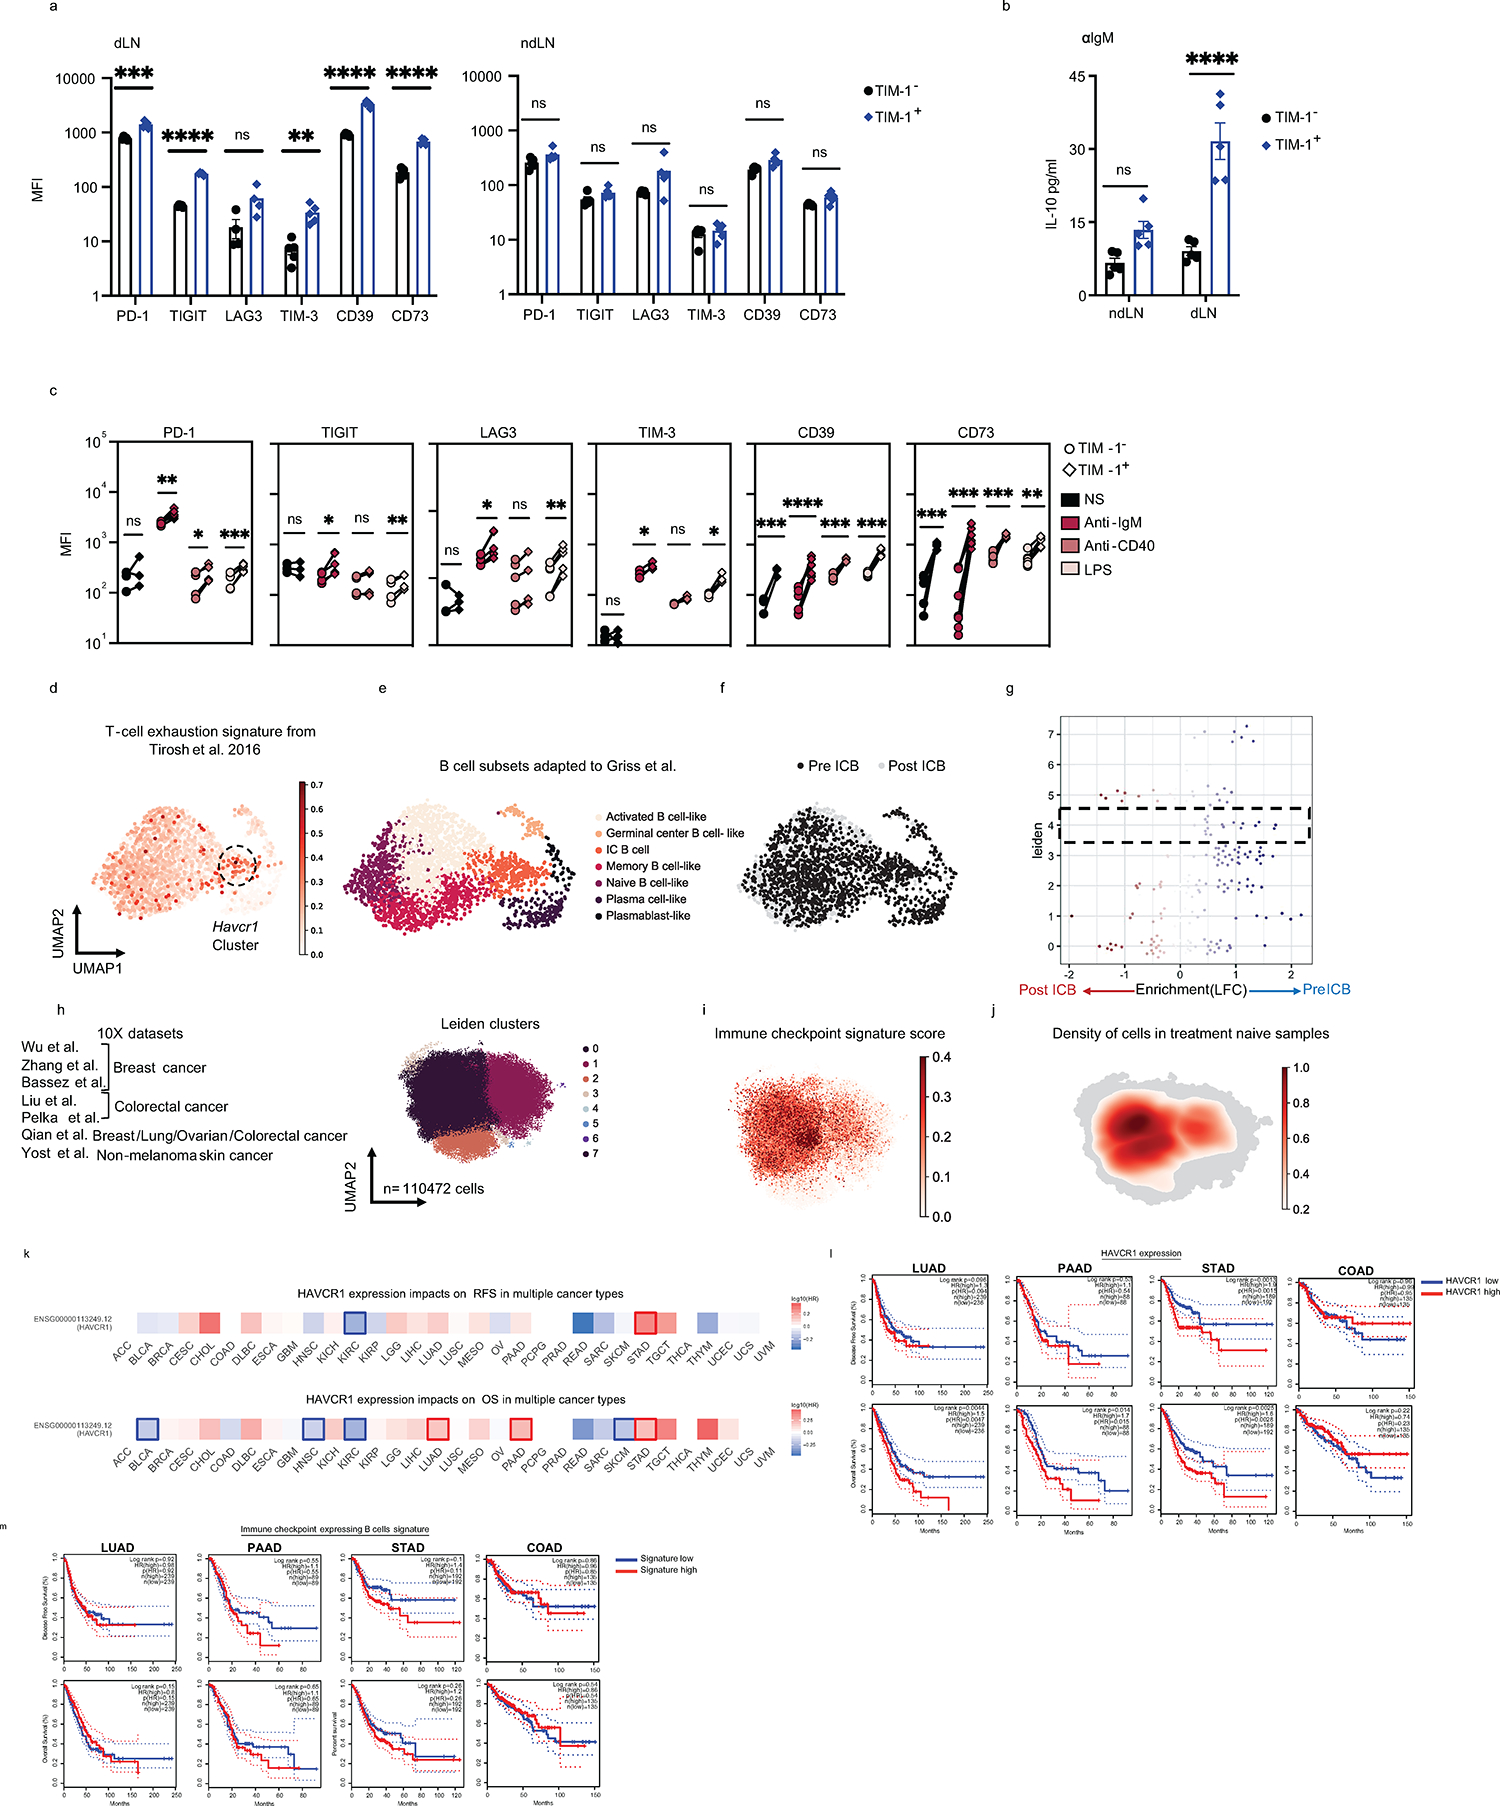
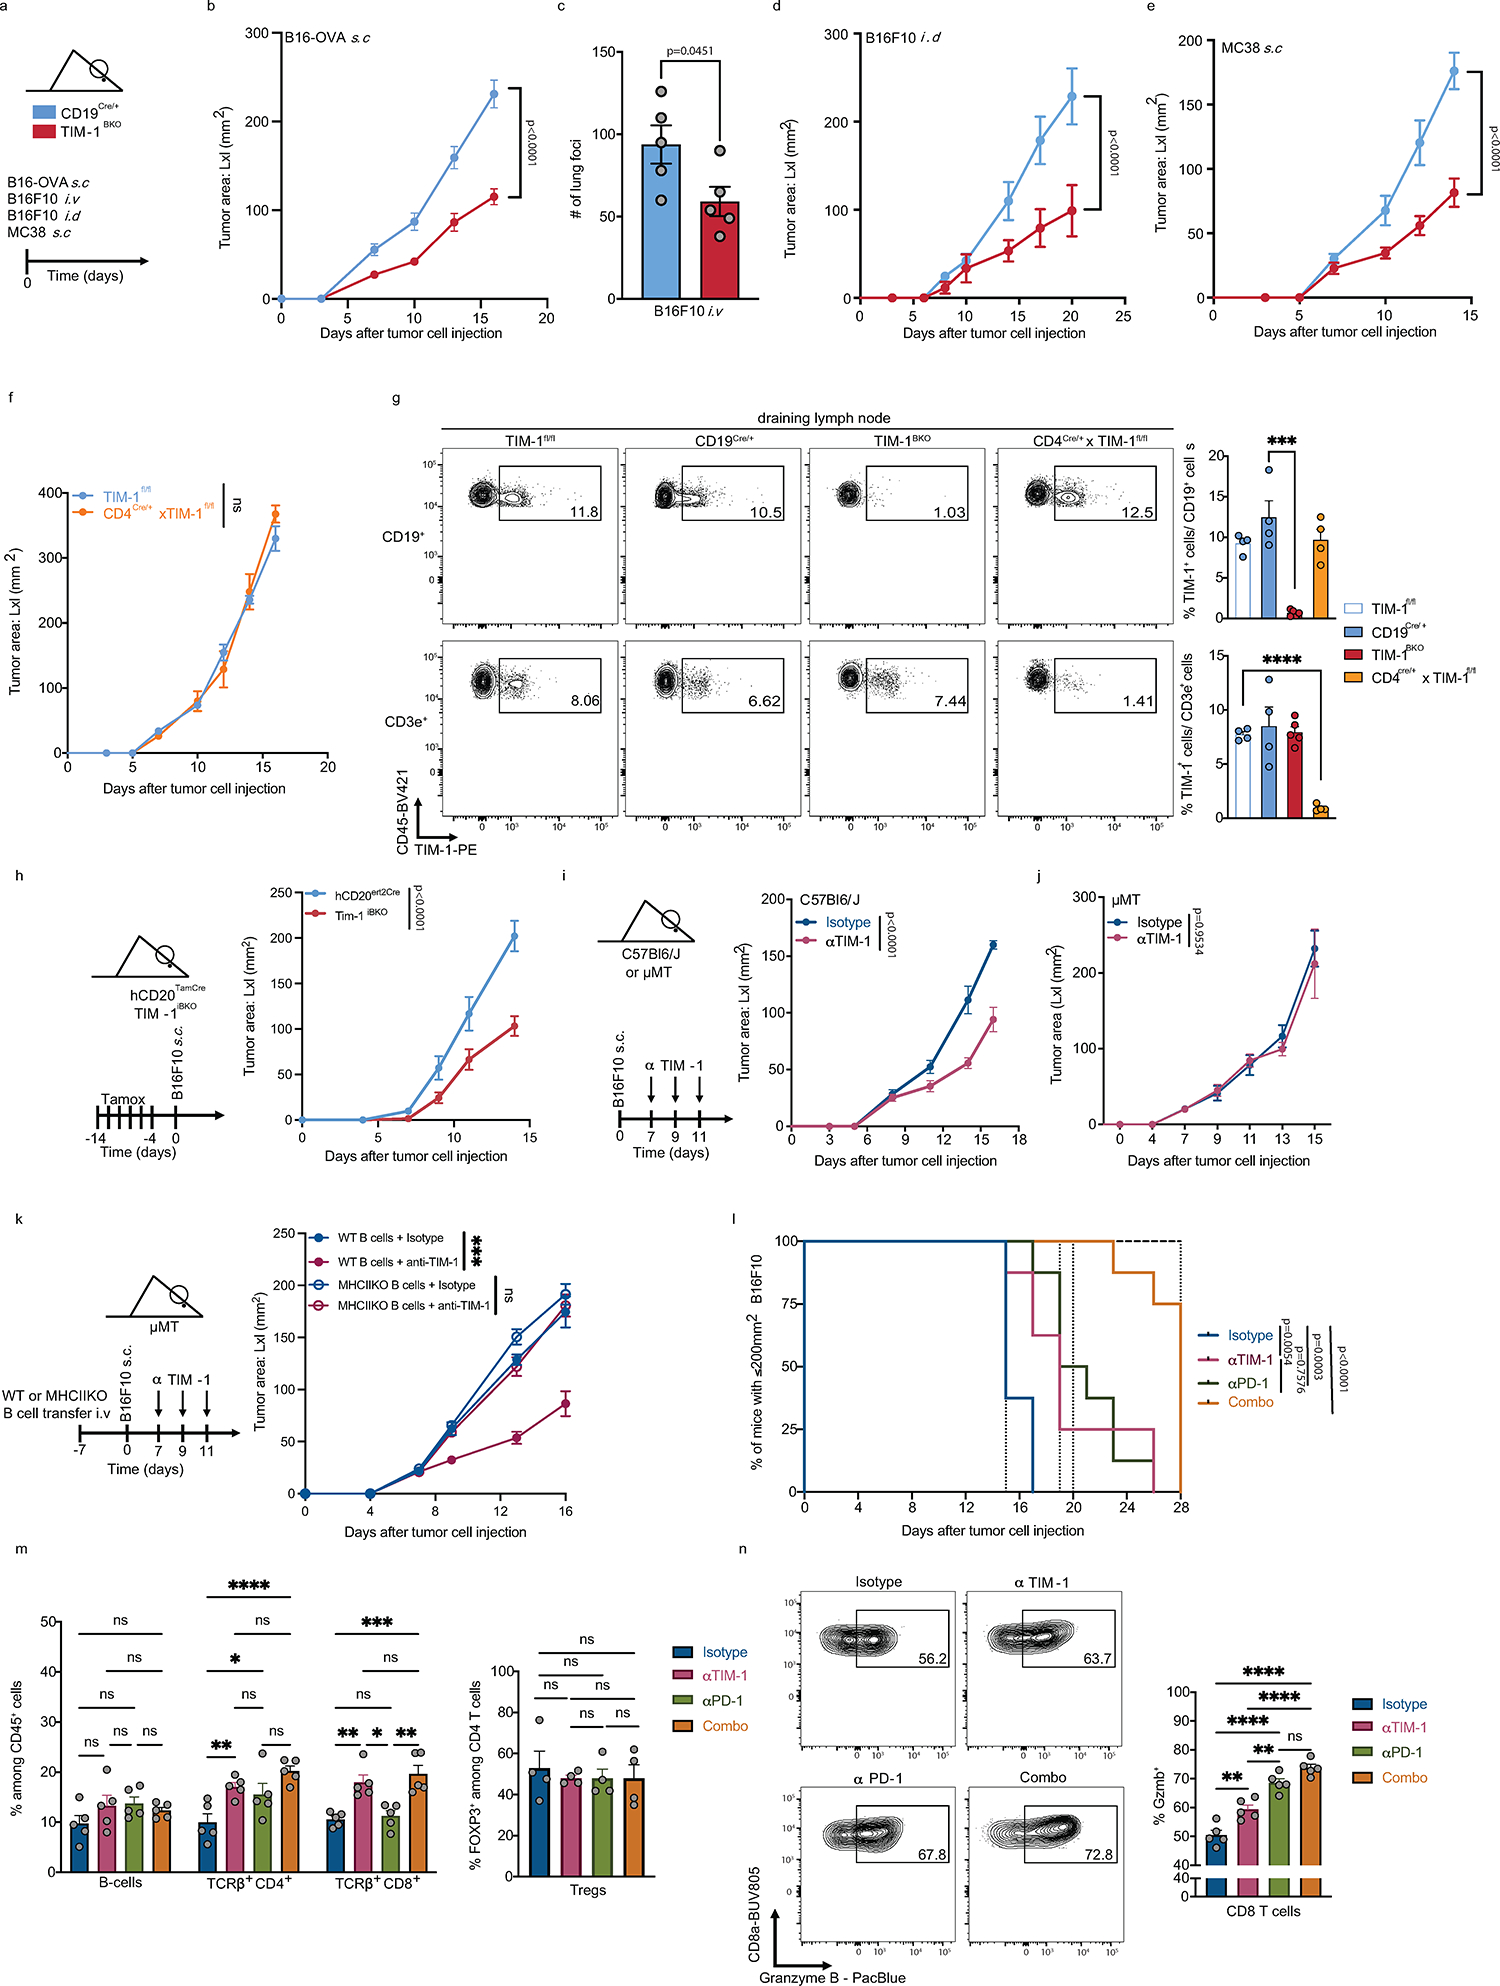
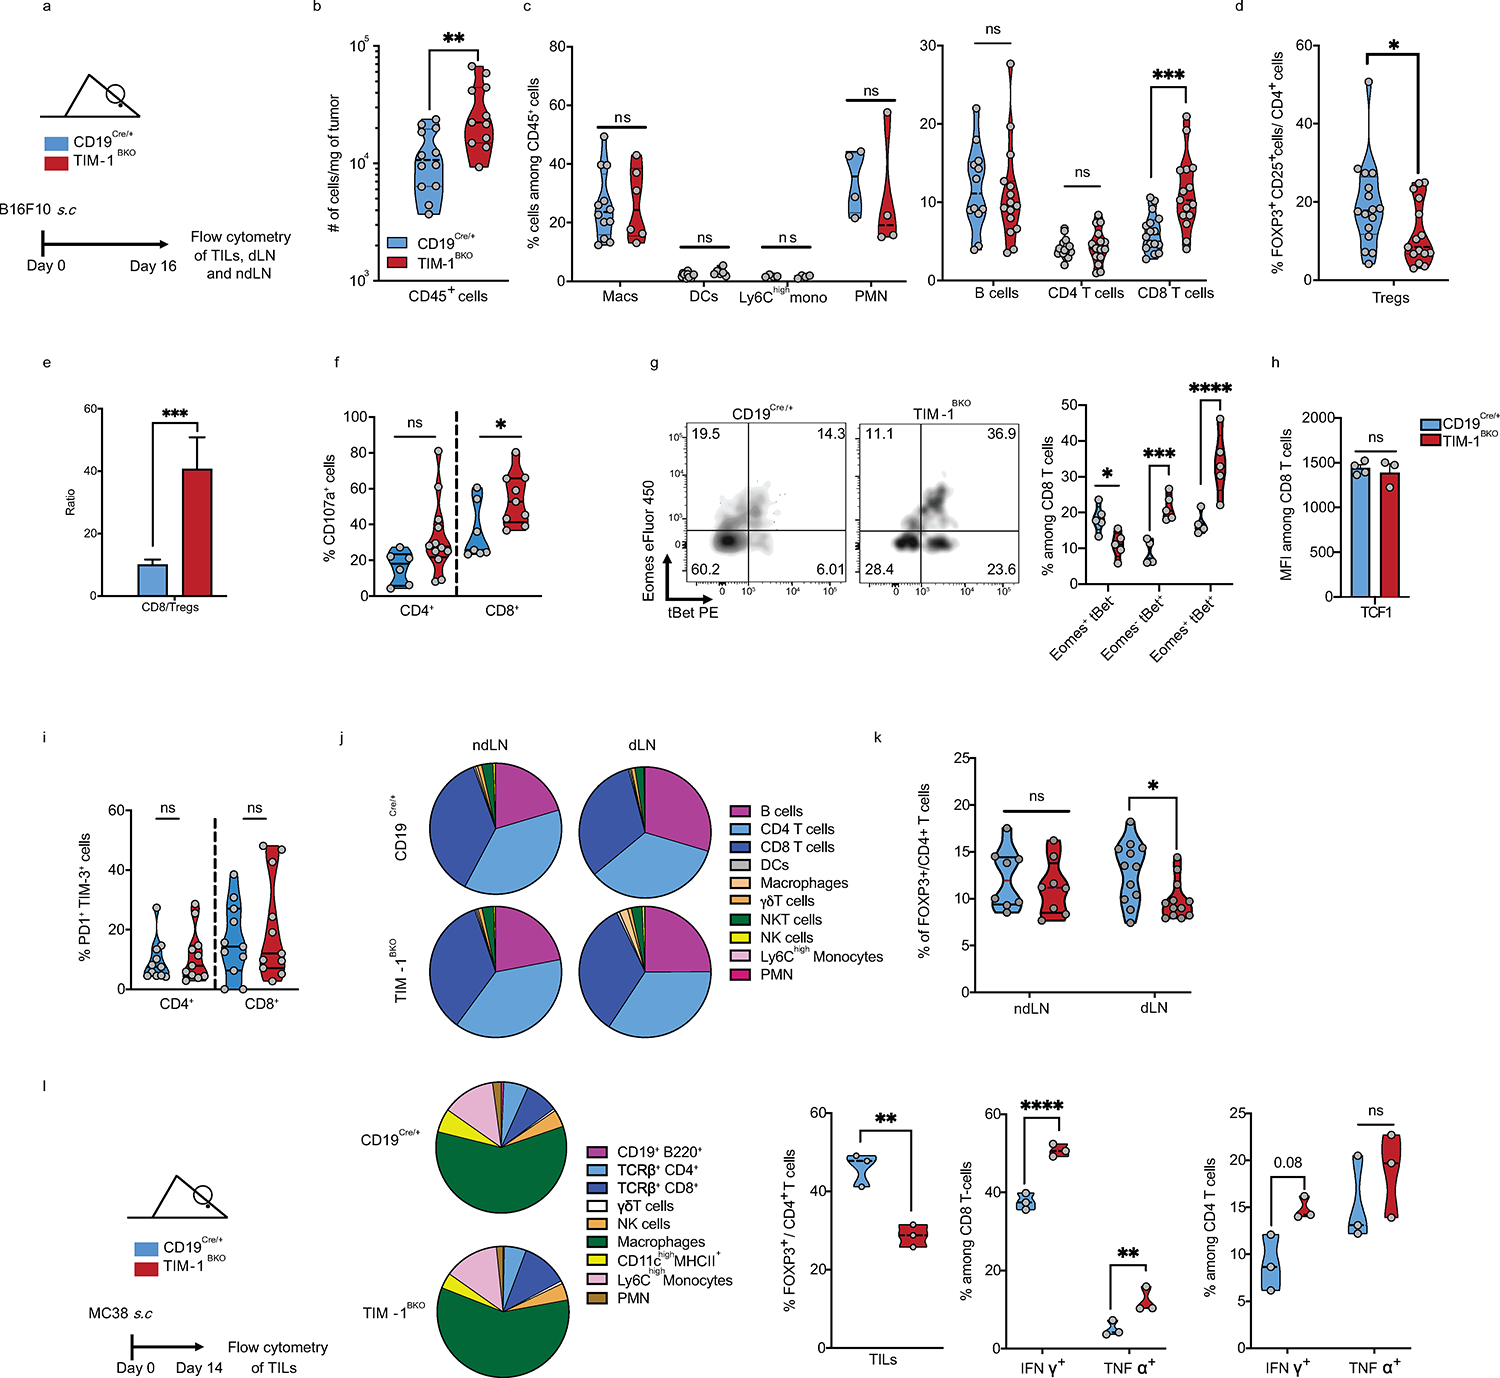
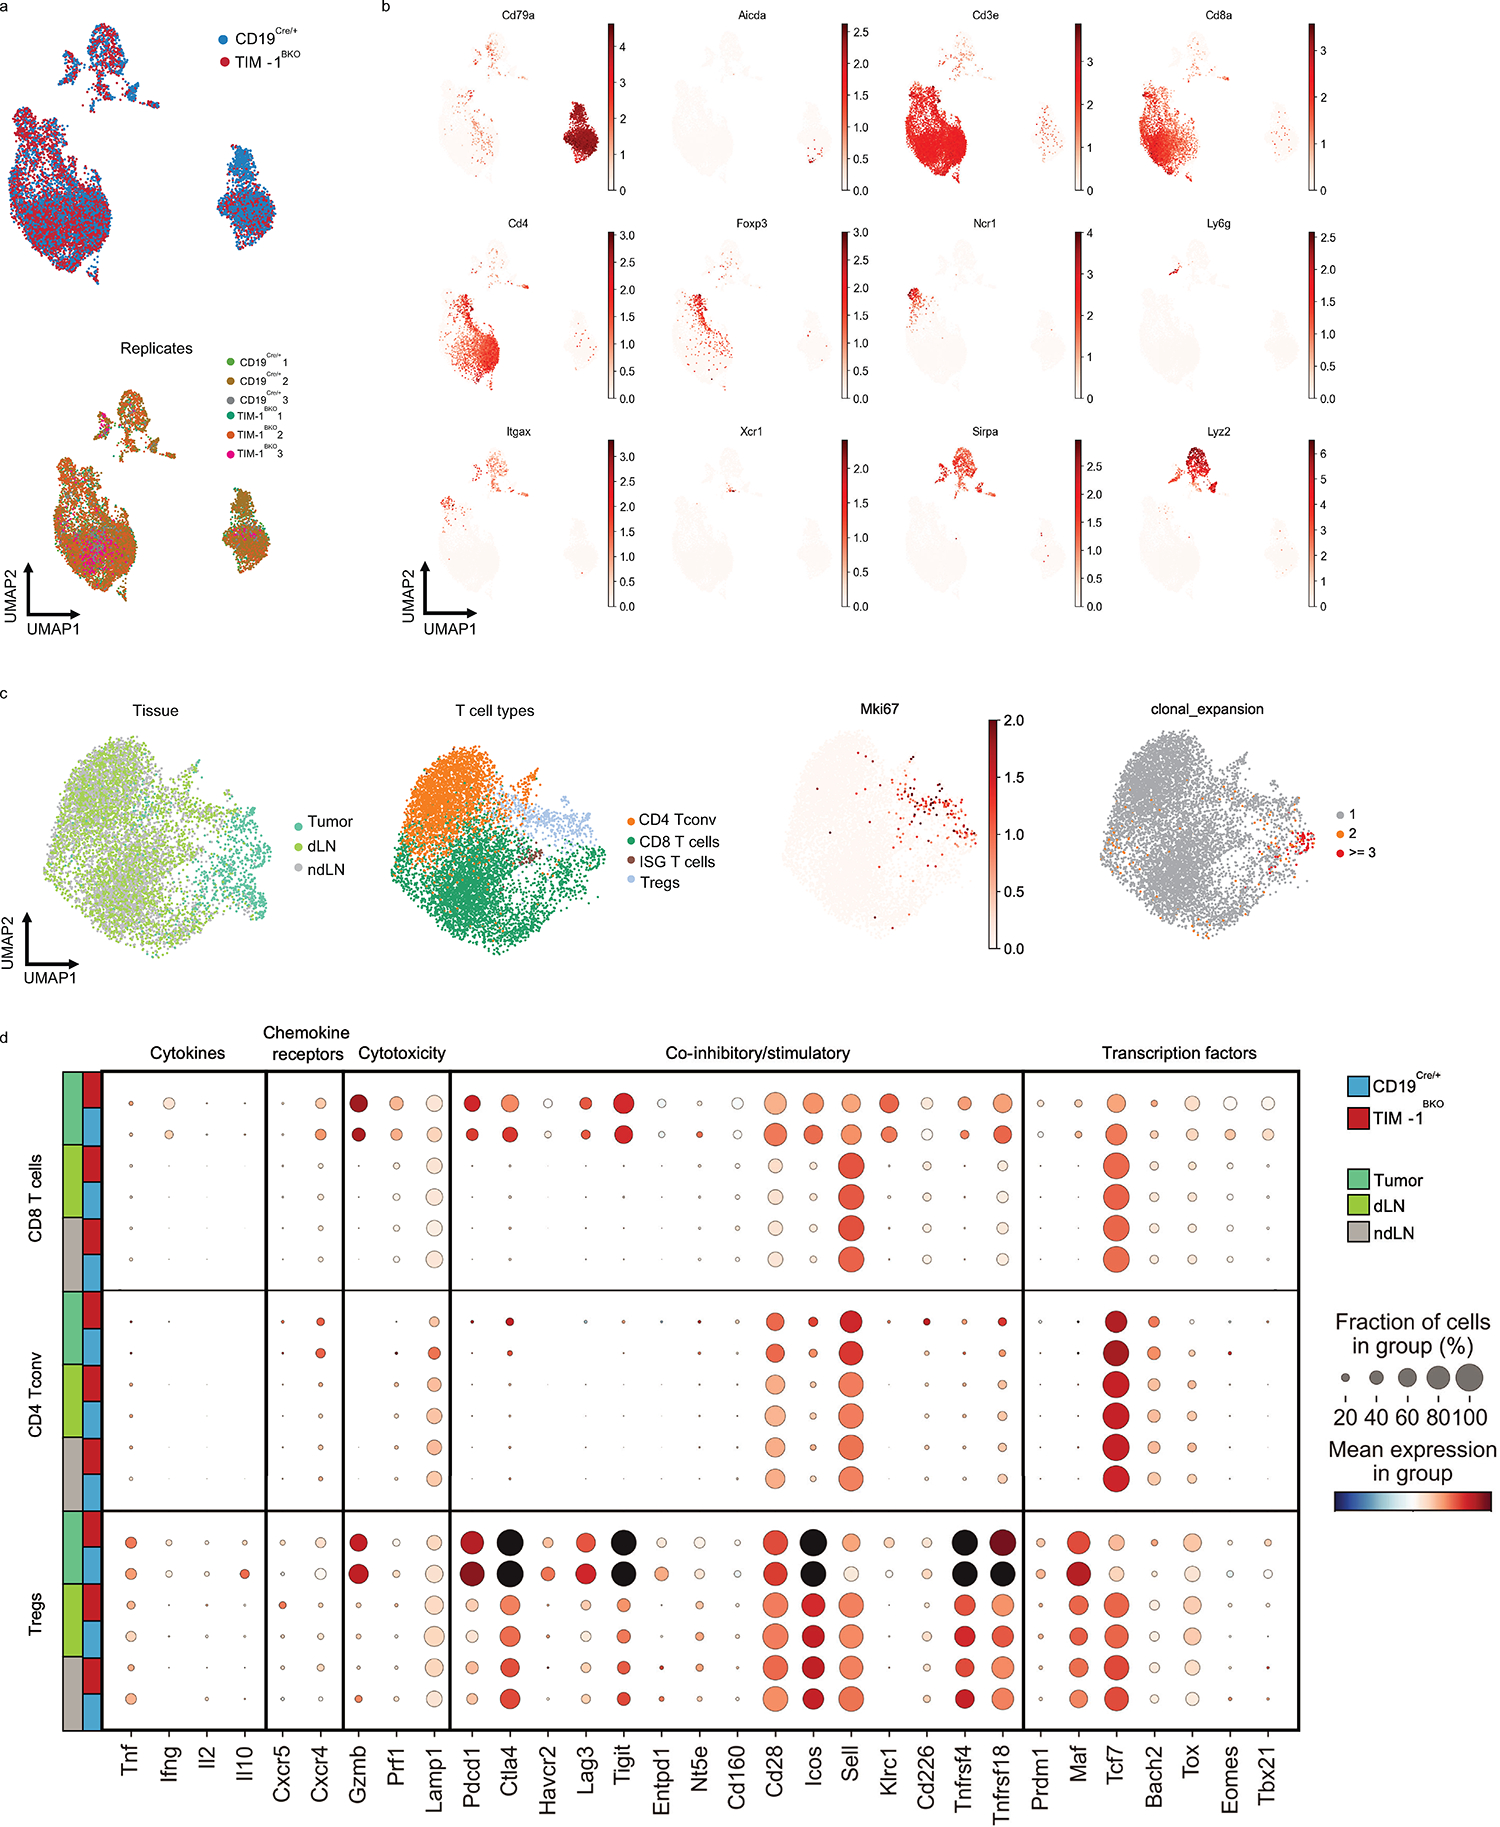
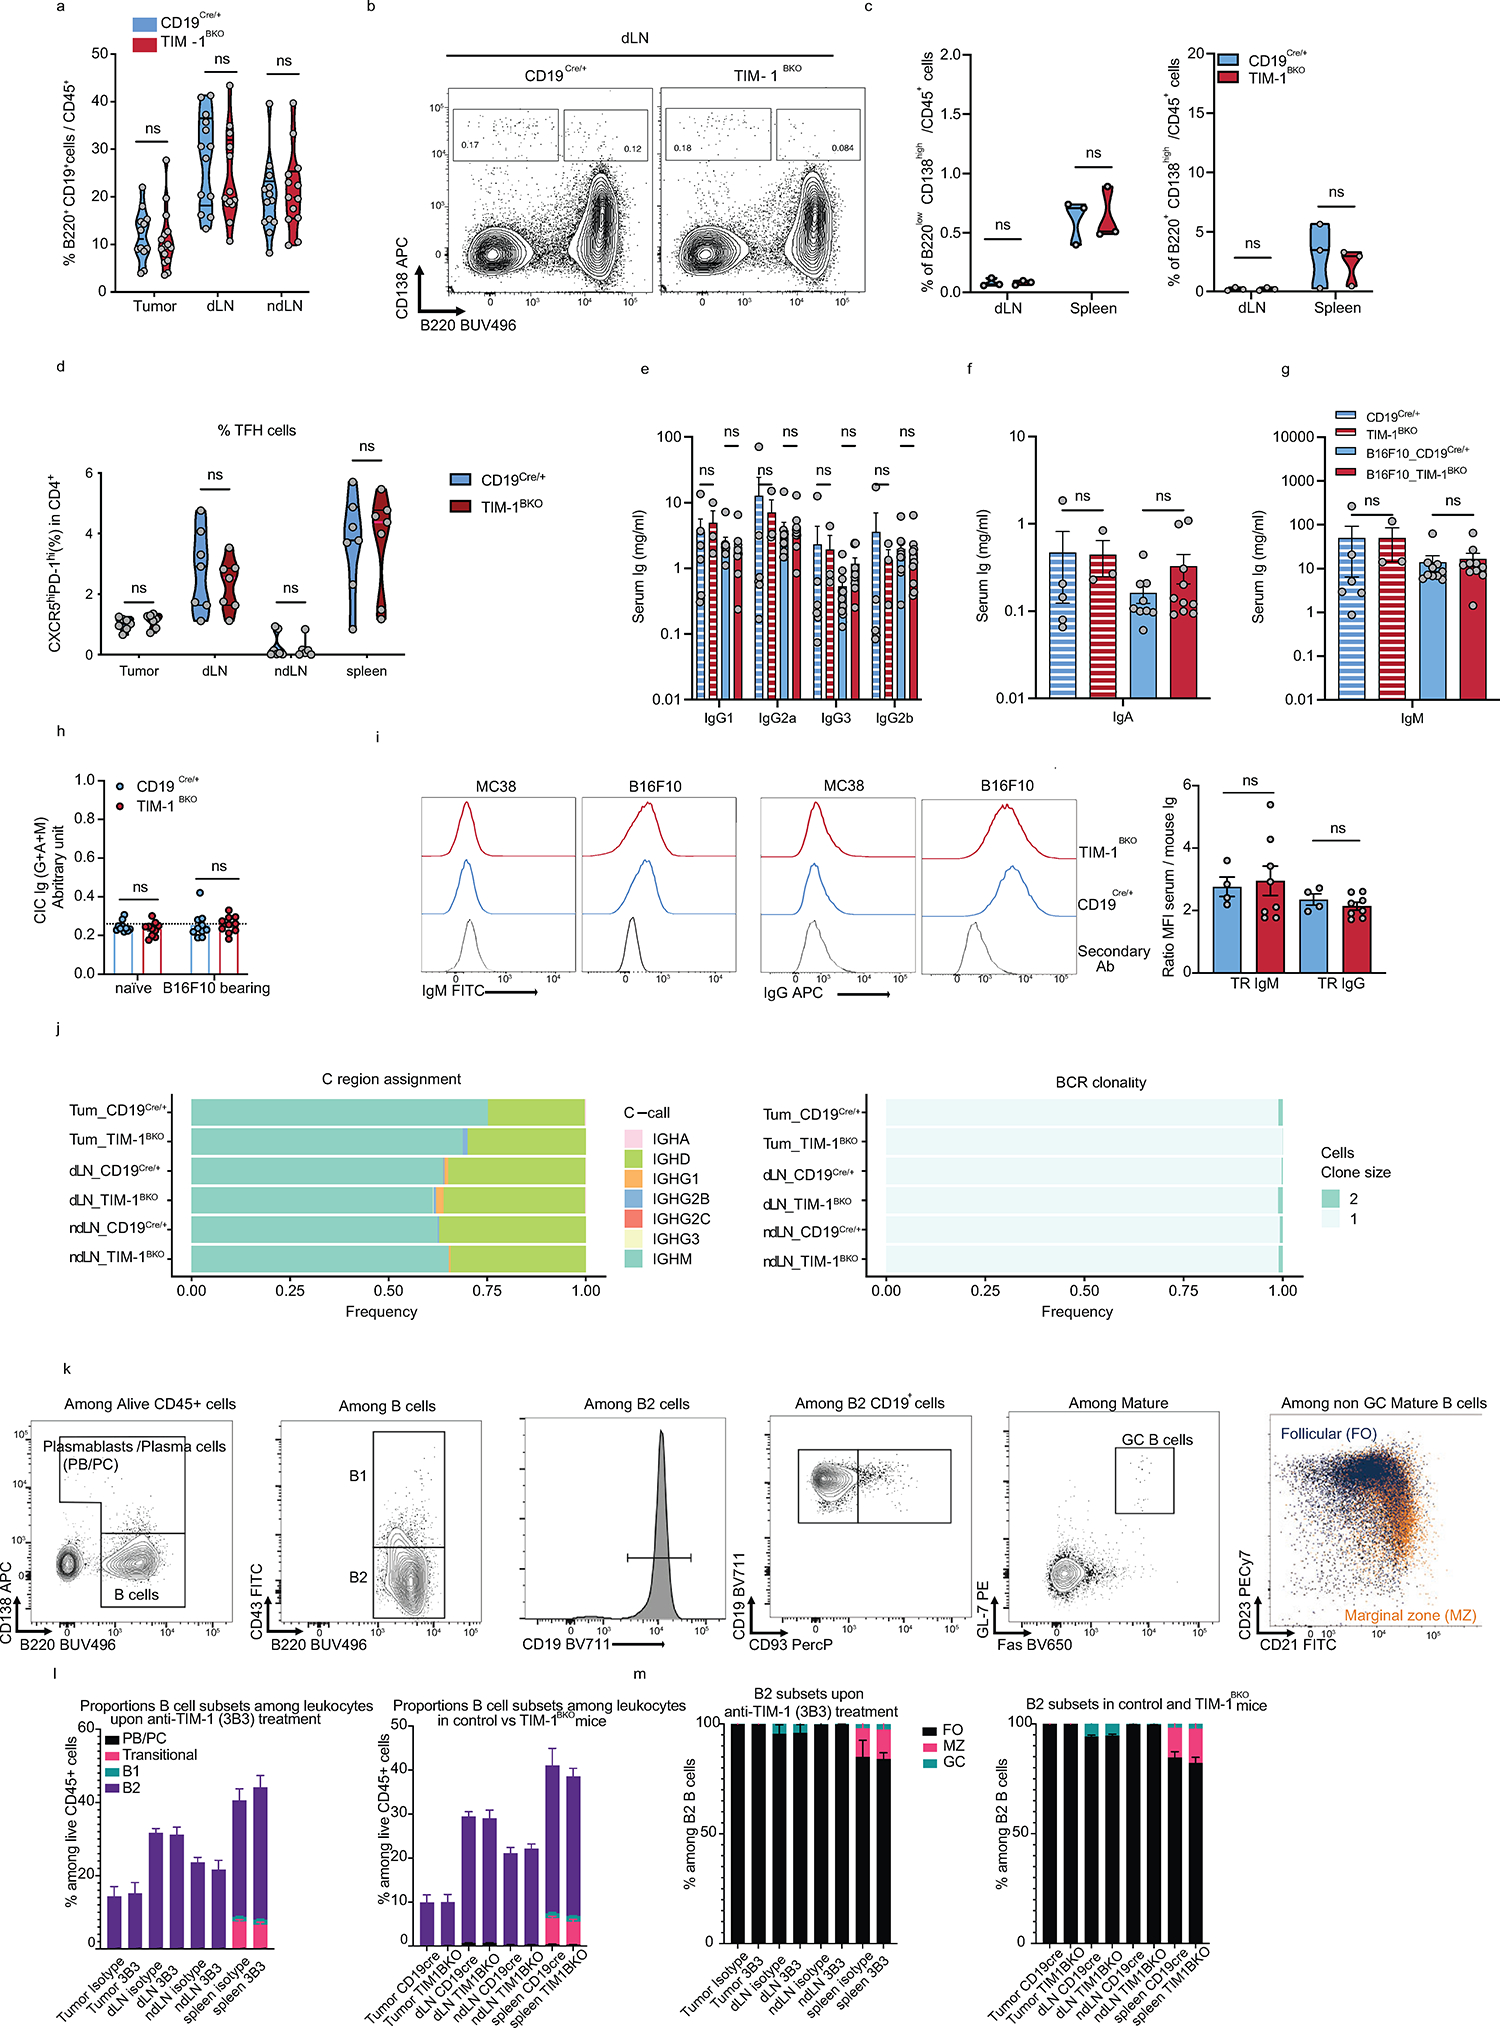
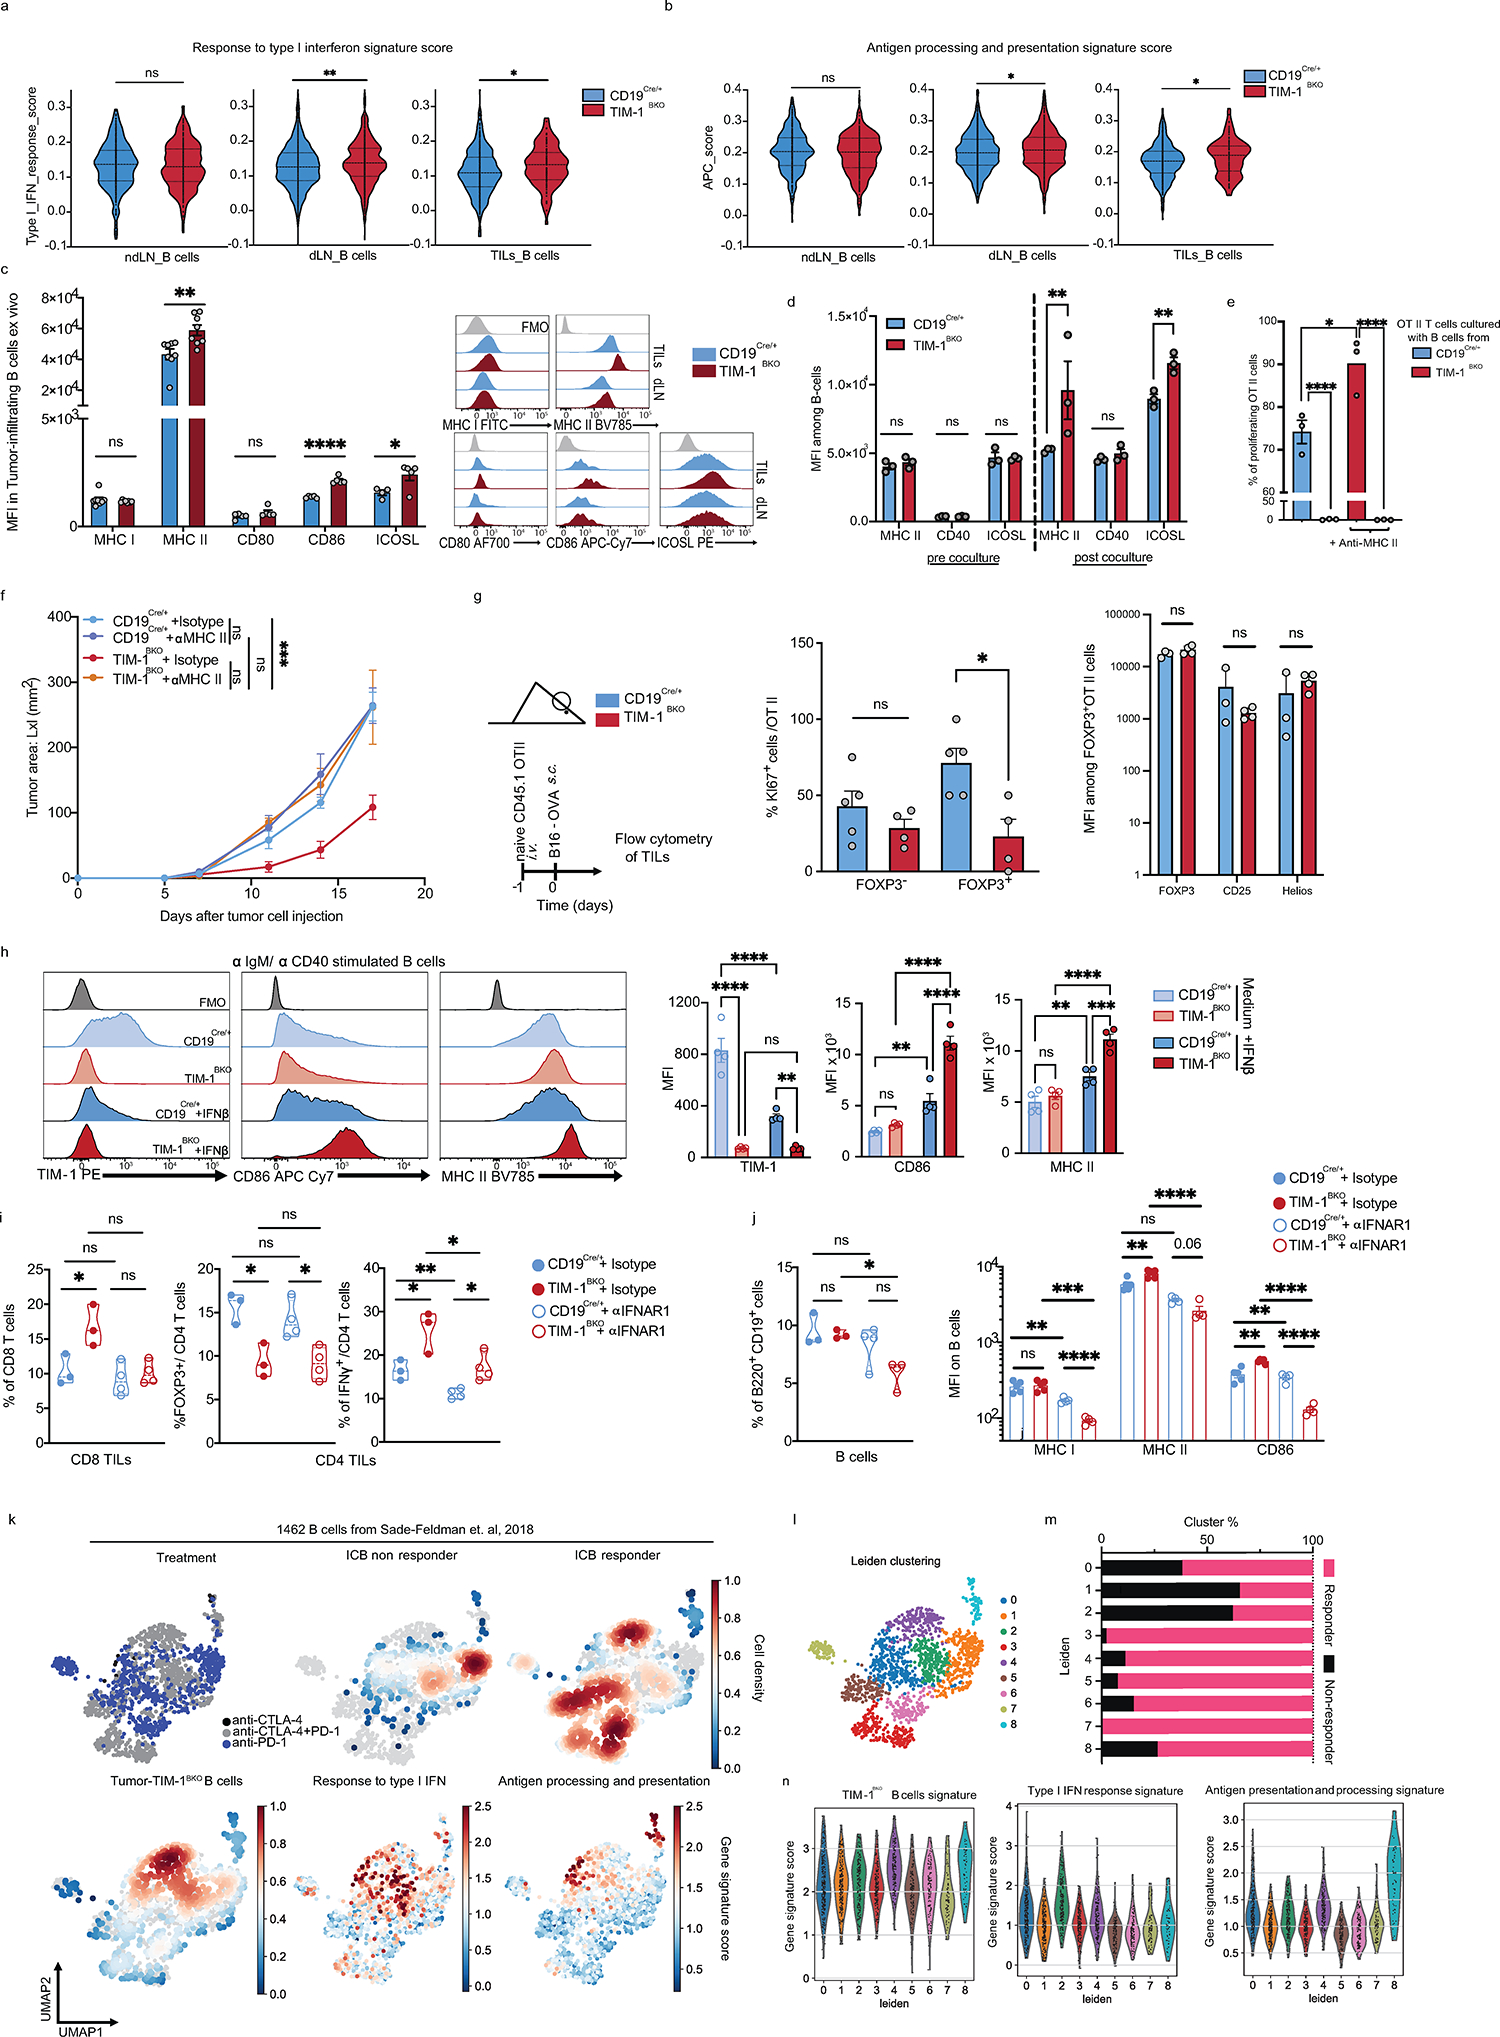
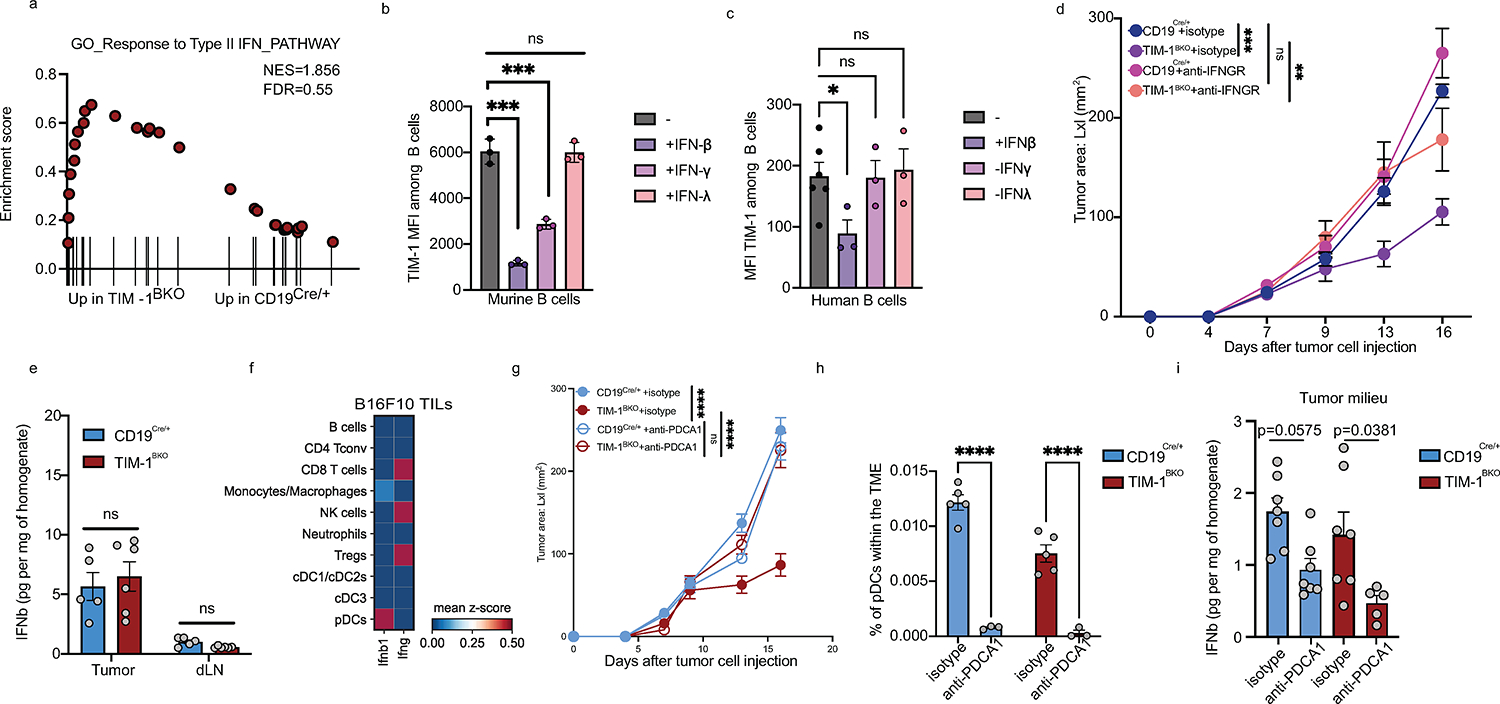
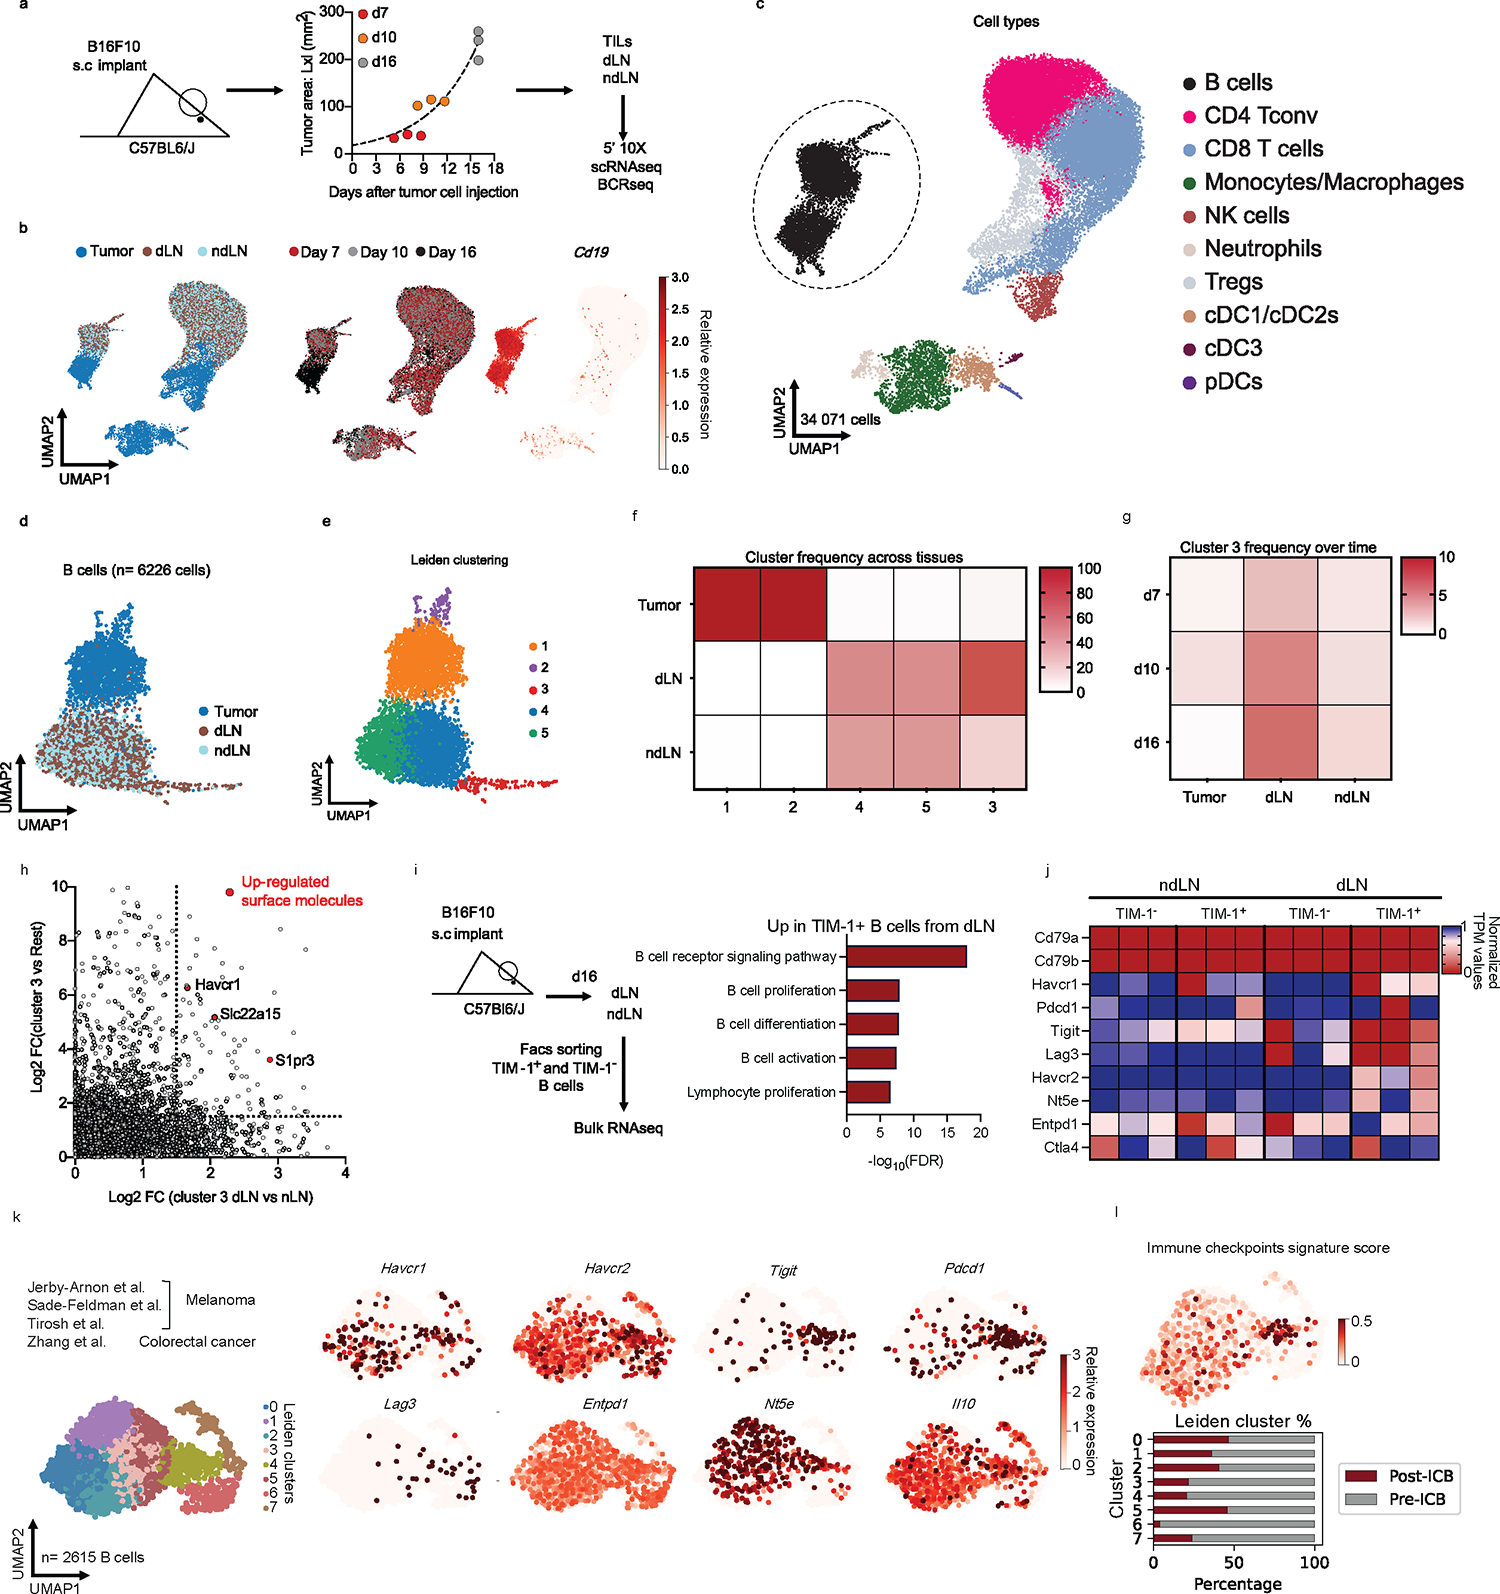
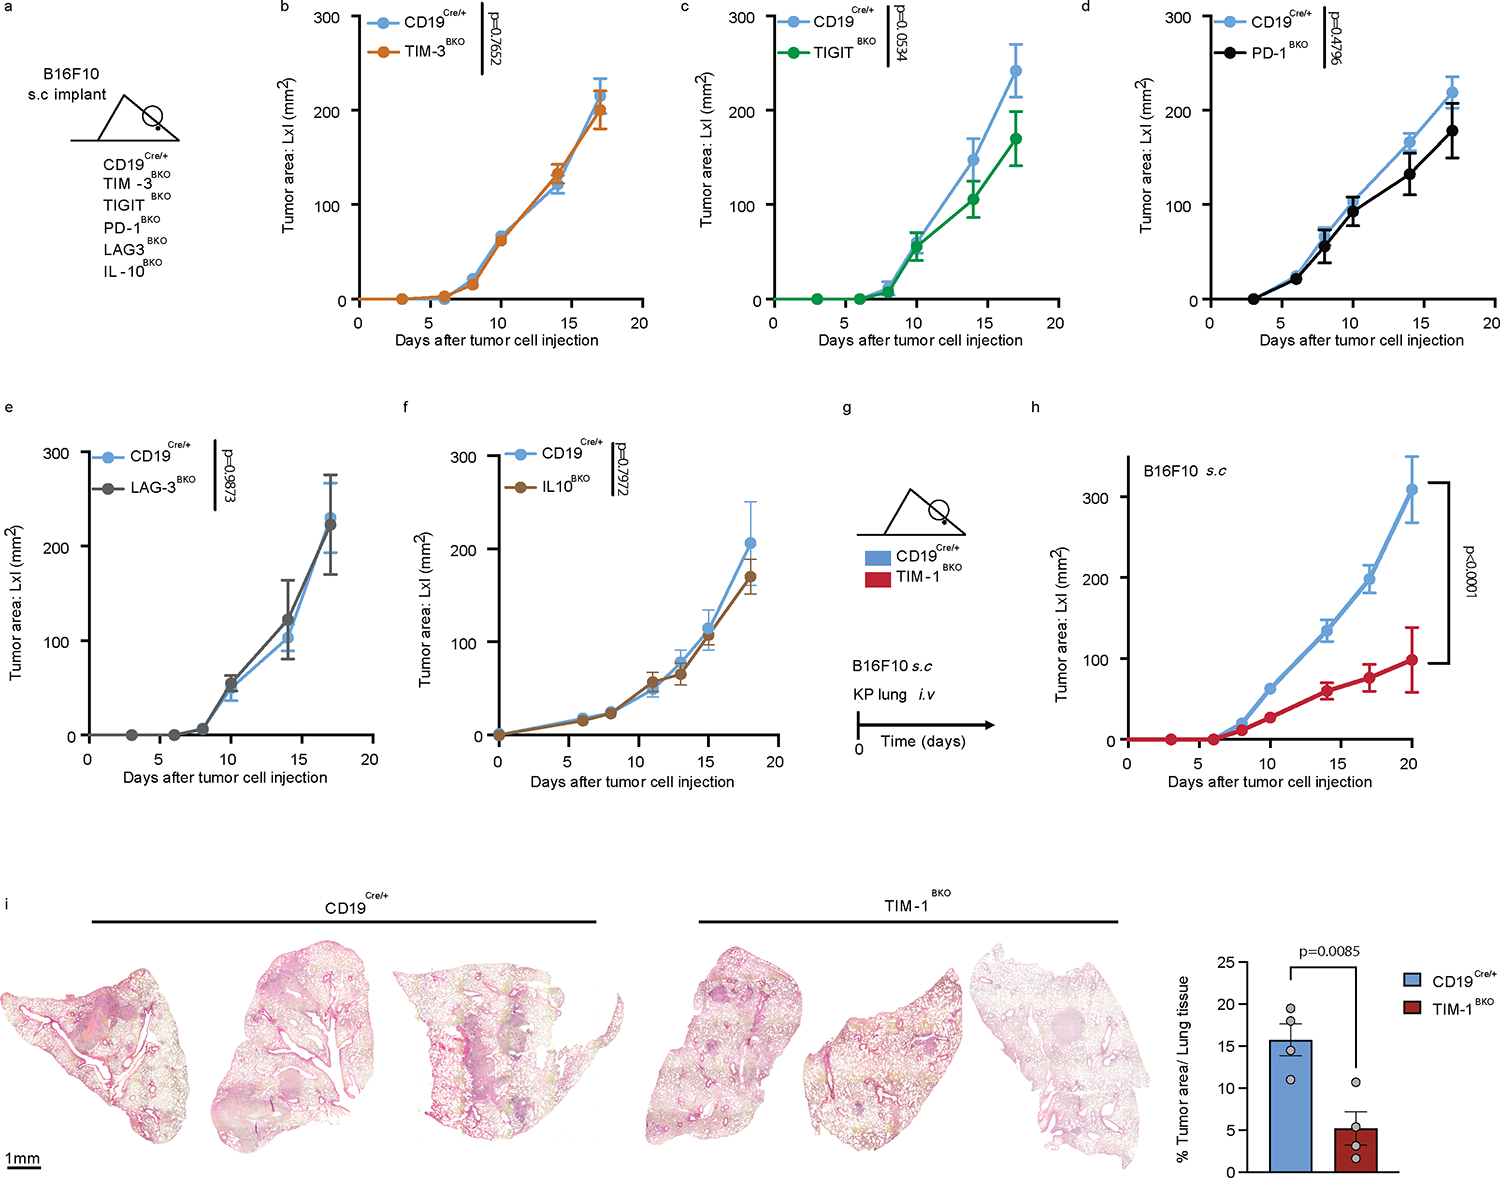
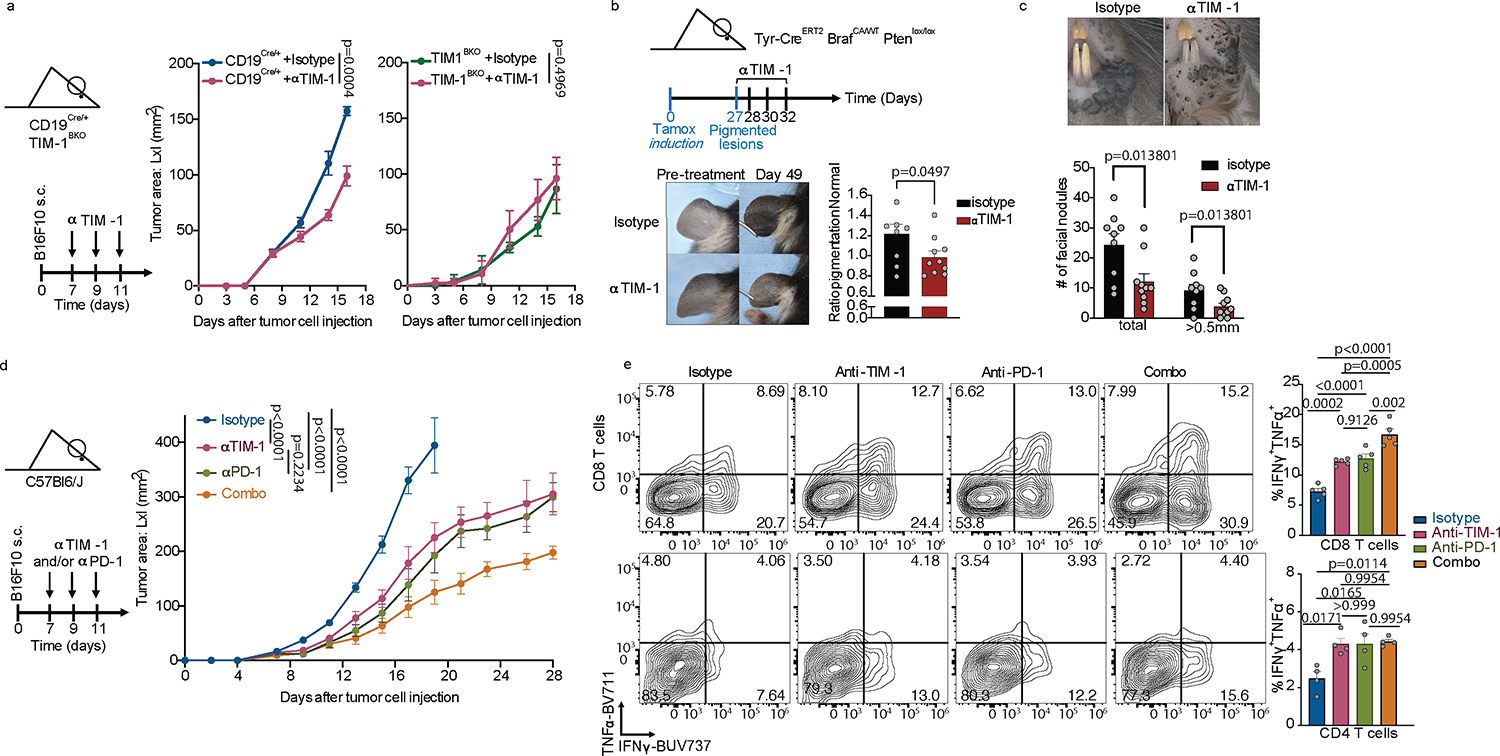
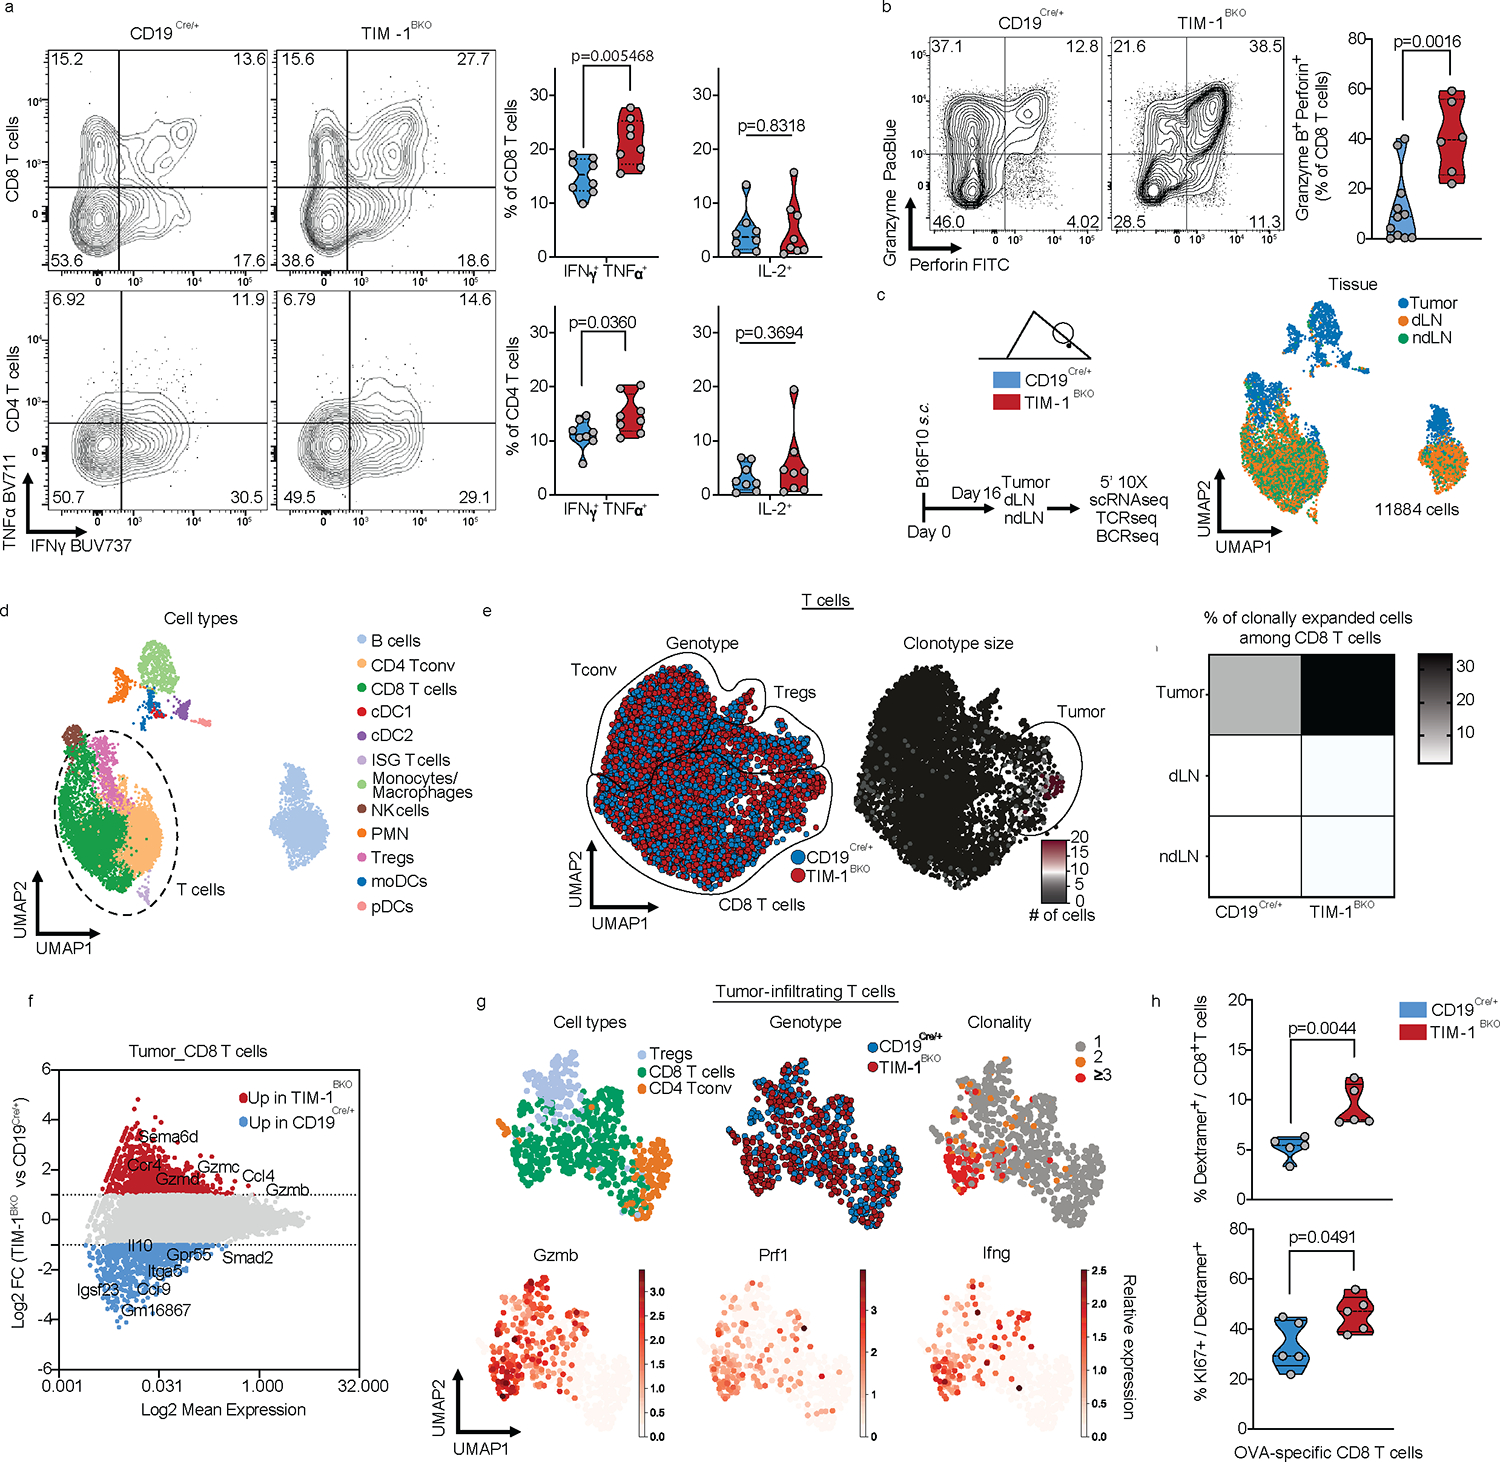
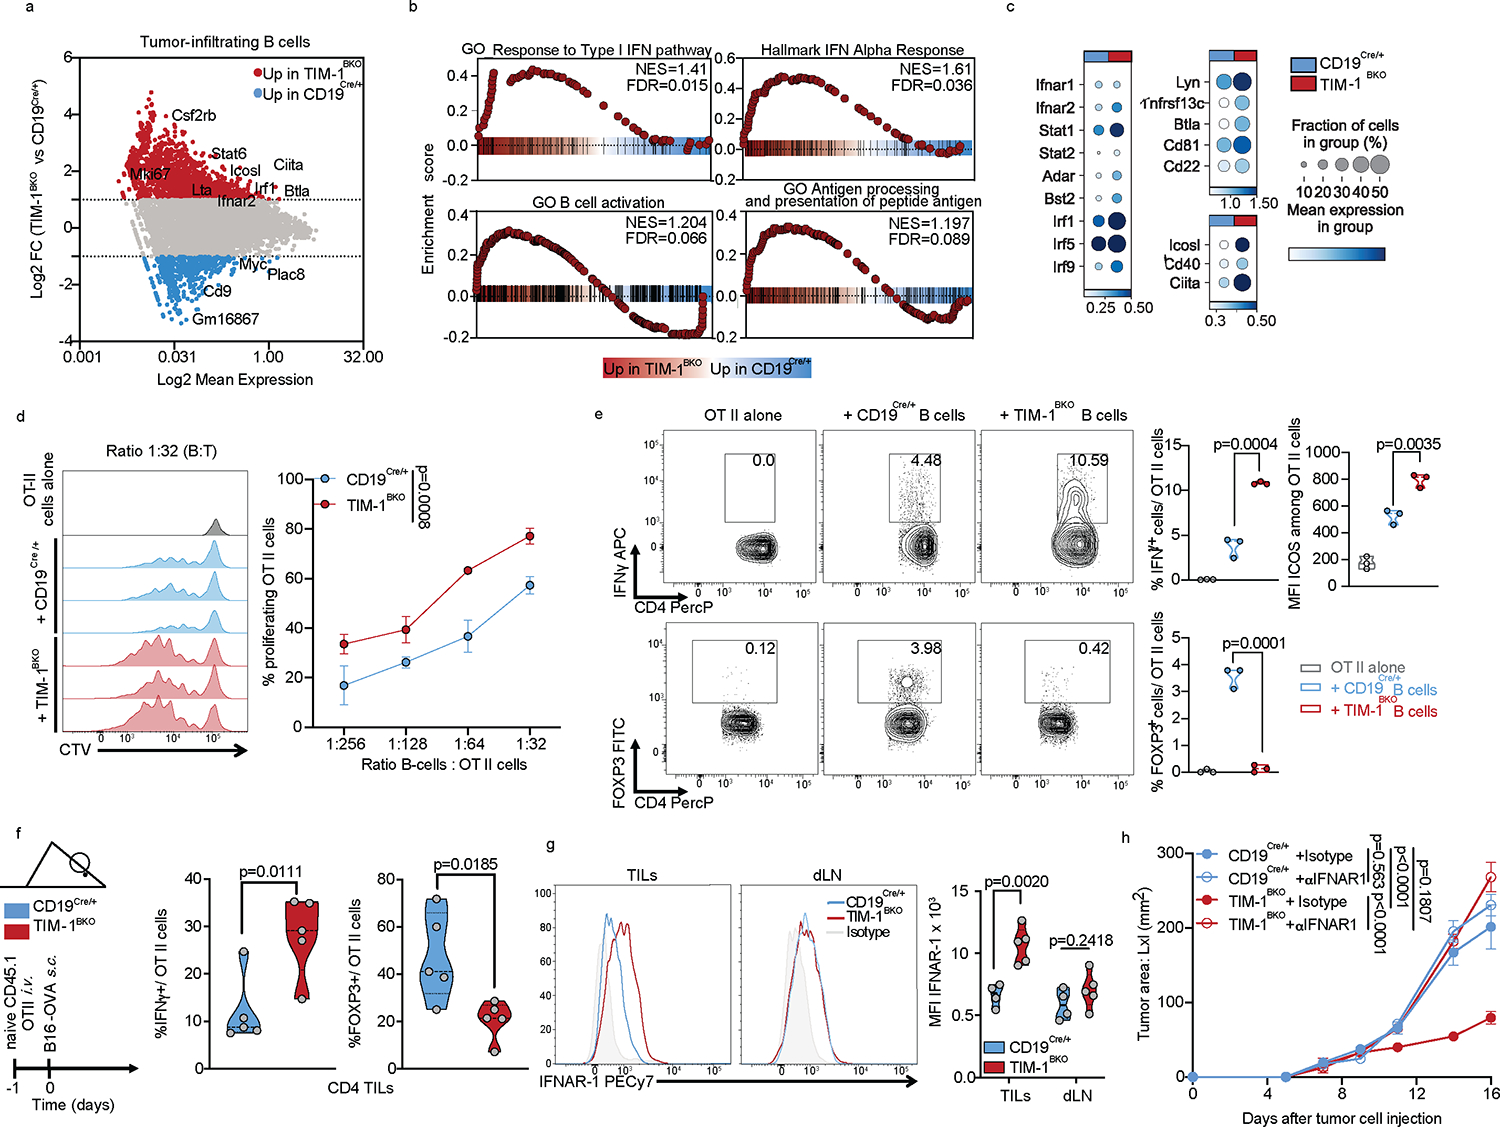
The role of B cells in anti-tumour immunity is still debated and, accordingly, immunotherapies have focused on targeting T and natural killer cells to inhibit tumour growth1,2. Here, using high-throughput flow cytometry as well as bulk and single-cell RNA-sequencing and B-cell-receptor-sequencing analysis of B cells temporally during B16F10 melanoma growth, we identified a subset of B cells that expands specifically in the draining lymph node over time in tumour-bearing mice. The expanding B cell subset expresses the cell surface molecule T cell immunoglobulin and mucin domain 1 (TIM-1, encoded by Havcr1) and a unique transcriptional signature, including multiple co-inhibitory molecules such as PD-1, TIM-3, TIGIT and LAG-3. Although conditional deletion of these co-inhibitory molecules on B cells had little or no effect on tumour burden, selective deletion of Havcr1 in B cells both substantially inhibited tumour growth and enhanced effector T cell responses. Loss of TIM-1 enhanced the type 1 interferon response in B cells, which augmented B cell activation and increased antigen presentation and co-stimulation, resulting in increased expansion of tumour-specific effector T cells. Our results demonstrate that manipulation of TIM-1-expressing B cells enables engagement of the second arm of adaptive immunity to promote anti-tumour immunity and inhibit tumour growth.


Conflict of interest statement

Disclosure of interest

VKK has an ownership interest in and is a member of the scientific advisory board for Tizona Therapeutics, Bicara Therapeutics, Compass Therapeutics, Larkspur Biosciences and Trishula Therapeutics. LB, SX and VKK, are named inventors on a provisional patent that has been filed including work from this study. LA performed consultancy work for Roche, Merck, Bristol-Myers Squibb, and Orega Biotech and was a recipient of a research grant from Sanofi. AR and VKK are co-founders of and have an ownership interest in Celsius Therapeutics. Additionally, AR is a co-founder and equity holder in Immunitas Therapeutics and was a scientific advisory board member of Thermo Fisher Scientific, Syros Pharmaceuticals, Asimov, and Neogene Therapeutics until 31 July 2020. A.R. and O.R.-R. are co-inventors on patent applications filed by the Broad Institute to inventions relating to single-cell genomics. The interests of VKK were reviewed and managed by the Brigham and Women’s Hospital and Partners Healthcare in accordance with their conflict-of-interest policies. The interests of AR were reviewed and managed by the Broad Institute and HHMI in accordance with their conflict-of-interest policies. Since 1 August 2020, AR has been an employee of Genentech, a member of the Roche group. ORR. is currently an employee of Genentech. The authors declare no other competing interests.

Figures

Extended Data Fig. 1:
Extended Data Fig. 1:. Total B cells but not plasma cells limit tumor growth and B16F10-infiltrating B cells have a distinct phenotype.
a, Frequencies of B cells among CD45+ cells derived from tumor, dLN, ndLN from C57Bl6/J mice 16 days post tumor implantation. b, c, B16F10 tumor growth in C57Bl/6J treated with anti-CD20 (48h prior to tumor injections) or isotype control antibodies (n=5 mice per group) (b) or CD19Cre/+ and CD19Cre/+xPrdm1fl/fl (n=5 mice per group). d-g, Bulk RNAseq analysis of B cells derived from tumor, dLN, ndLN and spleen of B16F10-bearing wild-type mice (n=3). Experimental design and PCA plot (d), Heatmap of global gene expression (e), Pathway enrichment analysis of genes up-regulated in tumor-derived B cells (f) and heatmap of a selected set of genes (g). h, Flow cytometry analysis of B cells derived from tumor, dLN, ndLN and spleen of C57Bl6/J mice implanted with B16F10 s.c. Representative FACS plot and percentage of B cell subsets. Heatmap depicting the MFI of various B cell markers in B cells derived from tumors or dLN from C57Bl6/J mice (n=5) (h). Data are mean ± s.e.m and pooled or representative of at least two to three independent experiments. * p<0.05, ** p<0.01, *** p<0.0001. Repeated measures two-way ANOVA test in b and c. two-tailed Student’s t-test in a. two-way ANOVA with Tukey's multiple comparisons test in h.
Extended Data Fig. 2:
Extended Data Fig. 2:. scRNAseq and BCRseq of TILs, dLN and ndLN derived from B16F10 melanoma bearing mice.
a, Gating strategy for the sorting of singlet viable cells prior to scRNAseq. b, Flow cytometry analysis depicting proportions of cell types infiltrating tumors across time. Data are mean ± s.e.m from two experiments. n=3 mice per group. c, UMAP of expression of different lineage marker transcripts. d, e, UMAPs and quantification of immunoglobulin class-switch (d) and clonal expansion (e) in B cells. f and g, UMAPs of B cells colored by time points or relative expression of the indicated genes (f) and g, Panels I-VIII, cells are colored by Cd19 expression (I) or by their signature score that reflects the relative average expression of the genes overlapping with the signatures for several indicated B cell subsets (II-VIII). Follicular (FO_B), Marginal zone (MZ_B), Immature (Imm_B), Antibody secreting cells (ASC), germinal center (GC) B cells derived from the dark zone (DZ_B) or light zone (LZ_B). h, Heatmap depicting the log fold change of the top 100 genes uniquely up-regulated in each Leiden cluster (t-test; fold change >2). Selected genes are shown.
Extended Data Fig. 3:
Extended Data Fig. 3:. TIM-1 expressing B cells characterization.
a, Proportions of TIM-1+ cells among CD19+ cells derived from tumor, dLN, ndLN, and spleen from B16F10 bearing C57Bl6/J mice 16 days post tumor injection together with inguinal LN (iLN) and spleen from tumor-free WT mice (n=5 for pLN, n=9 for spleens, n=16 for Tumor, dLN and ndLN). b, TIM-1+ B cells derived from dLN and ndLN were sorted and analyzed by bulk RNAseq (n=3). Experimental design, PCA plot and heatmap of selected genes are shown. c, Flow cytometry analysis of subsets and marker expression of TIM-1+ B cells derived from dLN vs ndLN from B16F10-bearing WT mice (n=6). d) FACS-sorted TIM-1 and TIM-1+ B cells were stained with CTV and stimulated in vitro with anti-IgM, anti-CD40 or LPS for 72h. Cell proliferation and plasma cell differentiation was analyzed by flow cytometry. Representative FACS plot (left) and quantification (right) are shown (n=7 for medium, for stimulation n=11 for TIM-1- and n=9 for TIM-1+). e, f, scRNAseq analysis depicting the experimental design, UMAPs colored by tissue of origin (I), TIM-1 sorting (II), expression of havcr1 (III) and gene signature score of cell cycle S-phase (IV), germinal center cells (V) and antibody secreting cells (VI). Dotplot of Havcr1 expression (III. right). f, UMAP colored by B cell clusters annotated according to TIM-1 expression. Pie chart depicting the frequency of the two main TIM-1-expressing subsets and foldchange of cell numbers between dLN and ndLN for each subset (n=7). g, Top 5 differentially expressed genes (FDR<0.05 and LFC>1) (x axis) by cluster (y axis). Dot size represents the fraction of cells in the cluster that express the gene; color indicates the mean expression (logTP10K (see Methods)) in all cells, relative to other clusters. h, FACS-sorted TIM-1 B cells were stained with CTV and stimulated in vitro with LPS, anti-IgM, anti-CD40 (n=3) or both anti-IgM+anti-CD40 (n=4) for 72h. TIM-1 surface expression across cell divisions was analyzed by flow cytometry. Representative FACS plot (left) and TIM-1 MFI quantification (right). Flow cytometry data are mean ± s.e.m and pooled or representative of at least two to three independent experiments. * p<0.05, ** p<0.01, *** p<0.001, **** p<0.0001, two-way ANOVA test in h. two-tailed Student’s t-test in a, c, d and f.
Extended Data Fig. 4:
Extended Data Fig. 4:. TIM-1 expressing B cells express higher levels of checkpoint molecules and IL-10.
a-b, TIM-1+ and TIM-1 B cells derived from dLN and ndLN from B16F10 bearing C57Bl6/J mice were analyzed ex vivo. MFI of various checkpoint molecules (n=4 mice per group) (a), IL-10 secretion 24h post anti-IgM stimulation as determined by LegendPlex (n=5 mice per group) (b). c, FACS-sorted TIM-1 and TIM-1+ B cells were stimulated in vitro with anti-IgM, anti-CD40 or LPS for 72h. MFI of checkpoint molecules was analyzed by flow cytometry. d-f, UMAP plot of published scRNAseq data depicting 2615 B cells(dots) isolated from human tumors, colored by their signature score that reflects the relative average expression of the genes overlapping with the signature of human melanoma exhausted T cells from Tirosh et al. 2016 (d), known B-cell subsets (e) or Leiden clusters (f). g, Beeswarm plots of the distribution of log fold change across Pre and Post ICB treatment from the Merge SS2 datasets using miloR. h-j) UMAPs depicting each single cell dots colored by Leiden clusters (h), Immune checkpoint signature score (i) or density plot for treatment naïve samples (j). Flow cytometry data are mean ± s.e.m and pooled or representative of at least two to three independent experiments. k, Survival map depicting the association of HAVCR1 high expression and clinical outcome in 32 cancer types. High log10 Hasard ratio (HR) (Reds) indicates a negative correlation with survival which would be outlined if p≤0.05. l and m, Kaplan Meier disease free (top row) or Overall (bottom row) survival curves for TIM-1 expression (l) or IC B cells signature (m) in Lung (LUAD), pancreatic (PAAD), stomach (STAD) and colon (COAD) adenocarcinomas. For each signature gene set, the cohorts were divided into high and low expression groups by median value (50% cutoff).Analyses were performed with log-rank Mantel-Cox test using web server GEPIA2, based on TCGA and GTEx databases. * p<0.05, ** p<0.01, *** p<0.001, **** p<0.0001, paired two-tailed t-test in a, b, and c.
Extended Data Fig. 5:
Extended Data Fig. 5:. Anti-TIM-1 treatment requires MHC II expression on B cells.
a-e, Tumor growth in CD19Cre/+ and TIM-1BKO mice implanted with B16-OVA (n=5 control vs 5 TIM-1BKO) (b), intravenously (n=5 control vs 5 TIM-1BKO) (c), intradermally (n=4 control vs 5 TIM-1BKO) (d) or subcutaneous MC38 colon adenocarcinoma (n=6 control vs 6 TIM-1BKO) (e). f, Tumor growth curve of B16F10 implanted into TIM-1fl/fl and CD4Cre/+xTIM-1fl/fl mice (n=4). g, Subcutaneous B16F10 melanoma were subcutaneously implanted into CD19Cre/+, TIM-1BKO, TIM-1fl/fl and CD4Cre/WTxTIM-1fl/fl mice. On day 16 dLN were harvested followed by flow cytometric analysis of TIM-1 expression of CD19+ or CD3e+ cells. n=4 mice per group. h, B16F10 melanoma growth in TIM-1iBKO and hCD20ert2Cre mice treated with tamoxifen on days indicated prior to tumor inoculation (n=6 mice per group). i-k, B16F10 tumor growth with anti-isotype control or anti-TIM-1 treatment in C57Bl/6J (n=7 treated with isotype control vs n=9 treated with anti-TIM-1), μMT (n=5 per group) (j) or μMT mice were reconstituted with WT or MHCII KO B cells and treated with anti-TIM-1 antibody (n=5 mice per group) (k). Experimental design (k, left), tumor growth curves (k, right). l-n, Survival curves (l) and flow cytometry immunophenotyping of TILs depicting frequencies of B cells, CD4+ and CD8+ TILs among living CD45+ cells (m, left), FOXP3+ cells among CD4+ TILs (m, right) and granzyme B+ cells among CD8+ TILs (n) of C57Bl/6J implanted with B16F10 melanoma and treated with either anti-TIM-1, anti-PD-1, anti-TIM-1 + anti-PD-1 (combo), or isotype controls (n=8 mice per group for tumor growth analysis and 5 mice per group for flow cytometry analysis). Data are mean ± s.e.m and pooled from two to three independent experiments. * p<0.05, ** p<0.01, *** p<0.001, **** p<0.0001. Repeated measures two-way ANOVA test in b, d, e, f, h, I, j and k. unpaired two-tailed t-test in c and g. Differences between survival curves were analyzed by log-rank (Mantel–Cox) test (l). One or two-way ANOVA with Tukey's multiple comparisons test in m and n.
Extended Data Fig. 6:
Extended Data Fig. 6:. Immunophenotyping of tumor-bearing CD19Cre/+ and TIM-1BKO mice.
a-k, Flow cytometry analysis of TILs, dLN and ndLN derived from CD19Cre/+ and TIM-1BKO mice implanted with B16F10 s.c. Absolute number of live CD45+ cells per gram of tumor (n=12 controls and n=11 TIM-1BKO mice) (b), Macs, DCs (n=12 controls and n=6 TIM-1BKO mice), mono, PMN (n=4 controls and n=4 TIM-1BKO mice), B cells (n=12 controls and n=15 TIM-1BKO mice), CD4+ and CD8+ T cells frequencies among CD45+ cells (n=16 controls and n=15 TIM-1BKO mice) (c), Frequency of Tregs among CD4+ T cells (n=16 mice per group) (d), CD8+ T cells vs Tregs ratio (e). CD107a-expressing CD4+(n=6 controls and n=12 TIM-1BKO mice) and CD8+ T cells (n=7 controls and n=9 TIM-1BKO mice) (f), Eomes and/or Tbet fraction (n=5 mice per group) (g), MFI of TCF1 (n=4 controls and n=3 TIM-1BKO mice) (h) and Frequency PD-1+ TIM-3+ among CD8+ T cells (d). j, pie charts depicting the proportions of various immune cell populations with dLN and ndLN. k, frequencies of FOXP3+ cells among CD4+ T cells (n=8 mice per group). l, Flow cytometry analysis of TILs from derived from CD19Cre/+ and TIM-1BKO mice implanted with MC38 colon adenocarcinoma s.c. Experimental design, pie chart of immune population and frequencies of FOXP3+ CD4+ T cells and of IFNγ or TNFα expressing CD8+ and CD4+ T cells (n=4 mice per group). Data are mean ± s.e.m and pooled from two to three independent experiments. * p<0.05, ** p<0.01, *** p<0.001, **** p<0.0001, two-tailed Student’s t-test in b, c, d, e, f, g, h, i, k and l.
Extended Data Fig. 7:
Extended Data Fig. 7:. scRNAseq of TILs, dLN and ndLN derived from B16F10 bearing CD19Cre/+ and TIM-1BKO mice.
a, b, scRNA/TCR-seq of TILs, dLN and ndLN from CD19Cre/+ and TIM-1BKO mice bearing B16F10 melanoma. UMAPs colored by genotype (a, top), biological replicates (a, bottom) or the relative expression of the indicated genes (b). c, UMAPs of T cells colored by tissue, T cell types, Mki67 relative expression or clonal expansion as indicated. d, Gene expression for functional marker genes in T cells. For each gene (columns) in each group (rows), the proportion of cells in the group expressing the gene (dot size) and the relative mean expression of expressing cells (color) is plotted.
Extended Data Fig. 8:
Extended Data Fig. 8:. Analysis of the humoral immunity and B-cell subsets in B16F10 bearing CD19Cre/+ and TIM-1BKO mice.
a, Frequencies of B cells among CD45+ TILs derived from CD19Cre/+ and TIM-1BKO mice implanted with B16F10 s.c. b, c, Representative FACS plot (b) and percentage (c) of plasma cells (B220low CD138high) or plasmablasts (B220+ CD138high) or TFh cells (d) from CD19Cre/+ and TIM-1BKO mice implanted with B16F10 s.c. e-h, serum immunoglobulins or CICs from naïve (n=5 CD19Cre/+ and n=3 TIM-1BKO) or B16F10-bearing CD19Cre/+ and TIM-1BKO mice (n=9 per group) and measured by LegendPlex (e-g) or ELISA (h). i, Flow-cytometric analysis of the presence of antitumor antibodies in the sera of CD19Cre/+ and TIM-1BKO mice implanted with B16F10 s.c. Representative histograms (light gray, staining with the secondary antibody alone; blue, CD19Cre/+ mice serum (n=4); red, TIM-1BKO mice serum (n=8)), and MFI ratios were calculated by dividing the MFI obtained with a given serum by the MFI obtained with the secondary antibody. j, Quantification of Immunoglobulin class-switch (left) and BCR clonality (right) in CD19Cre/+ and TIM-1BKO B cells. k-m, Flow cytometry analysis of B cell subsets in Tumor, dLN, ndLN and spleen from isotype vs anti-TIM-1 (3B3) treatment mice or in control vs TIM-1BKO mice (n=5 mice per group). k, Gating strategy used. l and m, Bar plots depicting the frequencies of major B-cell subsets (l) or subsets within B2 cells (n=5 mice per group) (m). Data are mean ± s.e.m and pooled from two to three independent experiments. Two-tailed Student’s t-test in a, c, d, h and i. two-way ANOVA with Tukey's multiple comparisons test in e, f, g.
Extended Data Fig. 9:
Extended Data Fig. 9:. TIM-1BKO B cells exhibit enhanced antigen presentation and co-stimulation capacity.
a and b, Violin plots displaying the distribution of the type I interferon response signature score (a) or the antigen processing and presentation of peptide antigen (APC) signature score (b) between TIM-1BKO and CD19Cre/+ B cells derived from ndLN, dLN and TILs. c and d, MFI and histograms of MHC I and II as well as co-stimulation molecules ex vivo (n=8 mice per group) (c) or in vitro co-cultured with OT II CD4+ T cells (n=3) (d). d and e, OVA323–339 peptide-pulsed TIM-1BKO and CD19Cre/+ B cells were co-cultured with CTV-labeled OVA-restricted CD4+ T cells for 4 days with or without anti-MHC II antibody. T cell proliferation was determined by dilution of CTV. Quantitative analysis of proliferation indices is shown (e). f, B16F10 melanoma growth in CD19Cre/+ and TIM-1BKO mice treated with anti-MHC II or isotype control antibodies (n=5 mice per group). g, Naïve CD45.1+ OVA-restricted CD4+ T cells were transferred i.v. 1 day prior to B16-OVA melanoma cells s.c implantation into CD45.2+ CD19Cre/+ and TIM-1BKO mice (n=5 mice per group). Tumor-infiltrating OT II cells were examined for expression of KI67 as proportions of expressing cells or MFI of FOXP3, CD25 and Helios (n=3 CD19Cre/+ and n=4 TIM-1BKO mice). Schematic of the experimental and quantitative results are depicted. h, TIM-1BKO and CD19Cre/+ B cells cultured with anti-IgM/anti-CD40 for 72h in the absence (medium) or with 20ng/ml of IFN-β. Representative histograms (left) and quantitative analysis of the MFI of TIM-1, CD86 and MHC II (n=4 mice per group). i and j, Flow cytometry analysis of TILs of indicated mice implanted with B16F10 melanoma and treated with isotype control (n=3 mice per group) or neutralizing anti-IFNAR-1 antibody (n=4 mice per group). Frequencies of CD8+ T cells (i, left), FOXP3+ and IFNγ+ cells among CD4+ T cells (i, middle and right), B cells (j, left) and MFI of MHC I, MHC II and CD86 among B cells (j, right) are depicted. k-n, Analysis of published scRNAseq data depicting 1462 B cells (dots) isolated from human melanoma tumors, projected onto UMAPs colored by treatment group (top left), density of cells associated with responder, non-responder lesions (top middle and right) or signature scores of tumor-derived TIM-1BKO B cells, GO type I interferon response and GO antigen processing and presentation gene signatures as detailed in Methods. l, UMAP colored by Leiden cell clusters (resolution 1). m, stacked bar graph displaying the frequencies of B cells derived from Responder and Non-responder samples among each Leiden cluster and n, violin plots displaying the signature scores of the indicated signatures across clusters. Data are mean ± s.e.m and pooled from two to three independent experiments. * p<0.05, ** p<0.01, *** p<0.001, ****p<0.0001. Kruskal-Wallis test in a and b. Two-tailed Student’s t-test in c, d, e, g, h, i and j. Repeated measures two-way ANOVA test in f.
Extended Data Fig. 10:
Extended Data Fig. 10:. Source of Interferons in B16F10 tumors and impact on TIM-1-mediated anti-tumor immunity.
a) GSEA analysis for the “Response to type II IFN pathway” of tumor-infiltrating TIM-1BKO and CD19Cre/+ B cells. b and c) Murine (b) or human (c) B cells were stimulated with IgM/CD40 for 3 and 7 days respectively in the presence or not of IFNβ, IFNγ or IFNλ (n=3). TIM-1 expression (MFI) was analyzed by flow cytometry. d) Tumor growth in indicated mice implanted with B16F10 melanoma and treated with isotype control or neutralizing anti-IFNGR-1 antibody (n=5 mice per group). e and i) B16F10 tumor and dLN supernatants derived from CD19Cre/+ and TIM-1BKO mice were collected, and levels of IFNβ were determined by ELISA (n=5 CD19Cre/+ vs n=6 TIM-1BKO mice in e). f) Matrixplot depicting IFNb1 mRNA expression profile across immune populations in B16F10 tumors by scRNAseq. g) Tumor growth in indicated mice implanted with B16F10 melanoma and treated with isotype control or depleting anti-PDCA1 antibody (two i.p injections 48 and 24h prior to tumor injection, n=7 mice per group). h) Flow cytometry analysis of pDC (MHCII+ CD11c+B220+PDCA1+) frequencies in B16F10 CD19Cre/+ and TIM-1BKO tumors (n=5 istoype treated and n=3 anti-PDCA1 treated mice). Data are mean ± s.e.m and pooled from two to three independent experiments. Two-tailed Student’s t-test in b, c, e, h and i. * p<0.05, ** p<0.01, *** p<0.001, ****p<0.0001, repeated measures two-way ANOVA test in d and g.
Fig. 1:
Fig. 1:. Characterization of B cells expressing TIM-1 and several checkpoint molecules in murine models and human tumors.
a, Workflow for single-cell transcriptome profiling of 34,071 viable leukocytes from the TME, dLN and ndLN samples. n=3 mice per time point (days 7 (early), 10 (intermediate) and 16 (late)). b, Uniform manifold approximation and projection (UMAP) embedding of all cells sequenced with each color representing tissues of origin (left), time point (center) and expression of Cd19 gene (right). c, UMAP visualization of the immune cell types. CD4+ Tconv, conventional CD4+ T cells, cDC1/2/3, type 1, 2 and 3 conventional dendritic cells; pDCs, plasmacytoid dendritic cells; Tregs, regulatory T cells; NK, Natural killer cells. d and e, UMAPs visualization of the 6,226 B cells (dots) collected from wild-type mice bearing B16F10 melanoma depicting tissues of origin (d), or Leiden cell clusters (resolution 0.85) (e). f, g, Heatmap displaying the frequencies of cells from each cluster within the tissues of origin (f) or from cluster 3 over time and tissues of origin (g). h, the log2 fold change (FC) in RNA levels between B cells derived from cluster 3 with the rest of the clusters and between the dLN and ndLN. i, j, Bulk RNAseq analysis of TIM-1+ and TIM-1 B cells derived from dLN and ndLN of B16F10-bearing wild-type mice (n=3). Pathway enrichment analysis of dLNderived TIM-1+ B cells (i). Heatmap depicting the expression pattern of a set of selected genes (j). k and l, UMAP plot of published scRNAseq,,, data depicting 2615 B cells(dots) isolated from human tumors, colored by cell clusters (k, left), selected gene expression (k, right), Immune checkpoint signature score (l, top) and stacked bar graph displaying the frequencies of B cells derived from Responder and Pre- and Post- ICB samples among each Leiden cluster (l, bottom).
Fig. 2:
Fig. 2:. In vivo regulatory molecules screening reveals TIM-1 as a B cell immune checkpoint controlling tumor growth.
a-f, Subcutaneous B16F10 melanoma growth in CD19Cre/+ (n=5) and TIM-3BKO (n=5) (b), TIGITBKO (n=6) (c), PD1BKO (n=4) (d), LAG3BKO (n=4) (e), IL10BKO (n=4 controls vs 4 IL10BKO) (f) mice. g-i, tumor growth in CD19Cre/+ and TIM-1BKO mice implanted with B16F10 subcutaneous (n=6 control vs 9 TIM-1BKO) or with KP1.9 cells were injected i.v. into CD19Cre/+ and TIM-1BKO mice (n=4 mice per group) (i). Tumor burden was assessed by histological analyses of lung tissue harvested 4 weeks post injection. Data are mean ± s.e.m and pooled from two to three independent experiments. Repeated measures two-way ANOVA test in b, c, d, e, f and h; two-tailed Student’s t-test in i.
Fig. 3:
Fig. 3:. TIM-1 targeting reduces B16F10 growth, depends on TIM-1 expression on B cells and augments PD-1 blockade therapy.
a, B16F10 tumor growth in CD19Cre/+ and TIM-1BKO mice (n=8 mice per group) treated with anti-TIM-1 or isotype control antibodies. b and c, Tyr-CreERT2 BRafCA/WT Ptenlox/lox mice were painted with 4-hydroxytamoxifen on one ear and treated with anti-TIM-1 antibody beginning 27 days later when visible lesions were apparent. Shown are representative photographs and pigmentation (b) or number of facial (c) measurements of Isotype (n=9 mice) or anti-TIM-1 (n=10 mice) treated ears at treatment and 3 weeks after treatment initiation/7 weeks after tumor induction. Data are mean ± s.e.m and pooled from two to three independent experiments. d and e, tumor growth (d) and flow cytometry immunophenotyping of TILs depicting frequencies of IFNγ+TNFα+ cells among CD8+ and CD4+ TILs (e) of C57Bl/6J implanted with B16F10 melanoma and treated with either anti-TIM-1, anti-PD-1, anti-TIM-1 + anti-PD-1 (combo), or isotype controls (n=8 mice per group for tumor growth analysis and 5 mice per group for flow cytometry analysis). Repeated measures two-way ANOVA test in a and d. One way ANOVA with Tukey's multiple comparisons test in e.
Fig. 4:
Fig. 4:. TIM-1 deletion in B cells enhances anti-tumor T cell immunity.
a and b, Flow cytometry analysis of TILs derived from CD19Cre/+ and TIM-1BKO mice implanted with B16F10 s.c. Representative FACS plot and percentage of IFNγ and TNFα double-producing cells and IL-2 within tumor-infiltrating CD8+ (top) and CD4+ (bottom) T cells (n=8 mice per group) (a), Representative FACS plot and percentage of Granzyme B and perforin double-expressing CD8+ T cells (n=11 controls and n=6 TIM-1BKO mice) (b). c-g, scRNA/BCR and TCR-seq of the TME, dLN and ndLN from CD19Cre/+ and TIM-1BKO mice bearing B16F10 melanoma. Schematic of the experimental design and UMAP of 11,884 CD45+ cells colored by their tissue of origin (c) and immune cell types (d). e, UMAP projection of CD19Cre/+ (blue) and TIM-1BKO (red) T cells delineated between CD4+ conventional T cells (Tconv), Tregs and CD8+ T cells (left panel) and clonally expanded T cells (middle panel). Frequencies of clonally expanded CD8+ T cells in different compartments (e, right panel). f, MA plot of gene expression comparing CD19Cre/+ versus TIM-1BKO CD8+ TILs. Positive log2 fold change corresponds to up-regulation within TIM-1BKO CD8+ TILs and vice versa. g, UMAP of TILs colored by cell types (top left), genotypes (top middle), clonal expansion (top right) and bottom panels show expression of the indicated markers. h, Frequencies of OVA-specific cells among CD8+ TILs (top) and KI67-expressing OVA-specific CD8+ TILs (bottom) (n=5 mice per group). Data are mean ± s.e.m and pooled from at least two to three independent experiments. two-tailed Student’s t-test in a, b and h.
Fig. 5:
Fig. 5:. TIM-1-deficiency in B cells unleashes B cell activation, antigen presentation and co-stimulatory function.
a-c, scRNAseq analysis of B cells derived from TILs, dLN and ndLN from CD19Cre/+ and TIM-1BKO mice bearing B16F10 melanoma. MA plot of gene expression comparing tumor-derived CD19Cre/+ and TIM-1BKO B cells (a), GSEA analysis (b) and dotplots depicting selected genes (c) between tumor-infiltrating TIM-1BKO and CD19Cre/+ B cells. Selected genes are annotated. d, OVA323–339 peptide-pulsed TIM-1BKO and CD19Cre/+ B cells were co-cultured with CTV-labeled OVA-restricted CD4+ T cells at different ratios for 4 days. T cell proliferation was determined by dilution of CTV. Representative histograms and quantitative analysis of proliferation indices are shown (n=3 mice per group). e, T cells were analyzed for expression of IFNγ, ICOS and FOXP3. Representative and quantitative data are shown. Circles denote data points from individual mice (n=3). f, Naïve CD45.1+ OVA-restricted CD4+ T cells were transferred i.v. 1 day prior to B16-OVA melanoma cells s.c implantation into CD45.2+ CD19Cre/+ and TIM-1BKO mice (n=5 mice per group). Tumor-infiltrating OT II cells were examined for expression of IFNγ and FOXP3. Schematic of the experimental and quantitative results are depicted. g, Quantification and representative histogram of IFNAR-1 surface expression of B cells derived from CD19Cre/+ and TIM-1BKO TILs and dLN implanted with B16F10 s.c. (n=5 mice per group). h, Tumor growth in indicated mice implanted with B16F10 melanoma and treated with isotype control (n=3 mice per group) or neutralizing anti-IFNAR-1 antibody (n=4 mice per group). Data are mean ± s.e.m and pooled or representative of at least two to three independent experiments. Repeated measures two-way ANOVA test in d and h. two-tailed Student’s t-test in e, f, and g.

Comment in

Similar articles

Cited by

References

    1. Topalian SL et al. Safety, activity, and immune correlates of anti-PD-1 antibody in cancer. The New England journal of medicine 366, 2443–2454, doi: 10.1056/NEJMoa1200690 (2012). - DOI - PMC - PubMed
    1. Wolchok JD et al. Nivolumab plus ipilimumab in advanced melanoma. The New England journal of medicine 369, 122–133, doi: 10.1056/NEJMoa1302369 (2013). - DOI - PMC - PubMed
    1. Thorsson V et al. The Immune Landscape of Cancer. Immunity 48, 812–830 e814, doi: 10.1016/j.immuni.2018.03.023 (2018). - DOI - PMC - PubMed
    1. Griss J et al. B cells sustain inflammation and predict response to immune checkpoint blockade in human melanoma. Nature communications 10, 4186, doi: 10.1038/s41467-019-12160-2 (2019). - DOI - PMC - PubMed
    1. Ladanyi A et al. Prognostic impact of B-cell density in cutaneous melanoma. Cancer immunology, immunotherapy: CII 60, 1729–1738, doi: 10.1007/s00262-011-1071-x (2011). - DOI - PMC - PubMed

MeSH terms

Substances