. 2023 Sep;621(7979):620-626.
doi: 10.1038/s41586-023-06239-6. Epub 2023 Jun 21.

Structural basis of mitochondrial protein import by the TIM23 complex

Affiliations

Structural basis of mitochondrial protein import by the TIM23 complex

Sue Im Sim et al. Nature. 2023 Sep.

Abstract

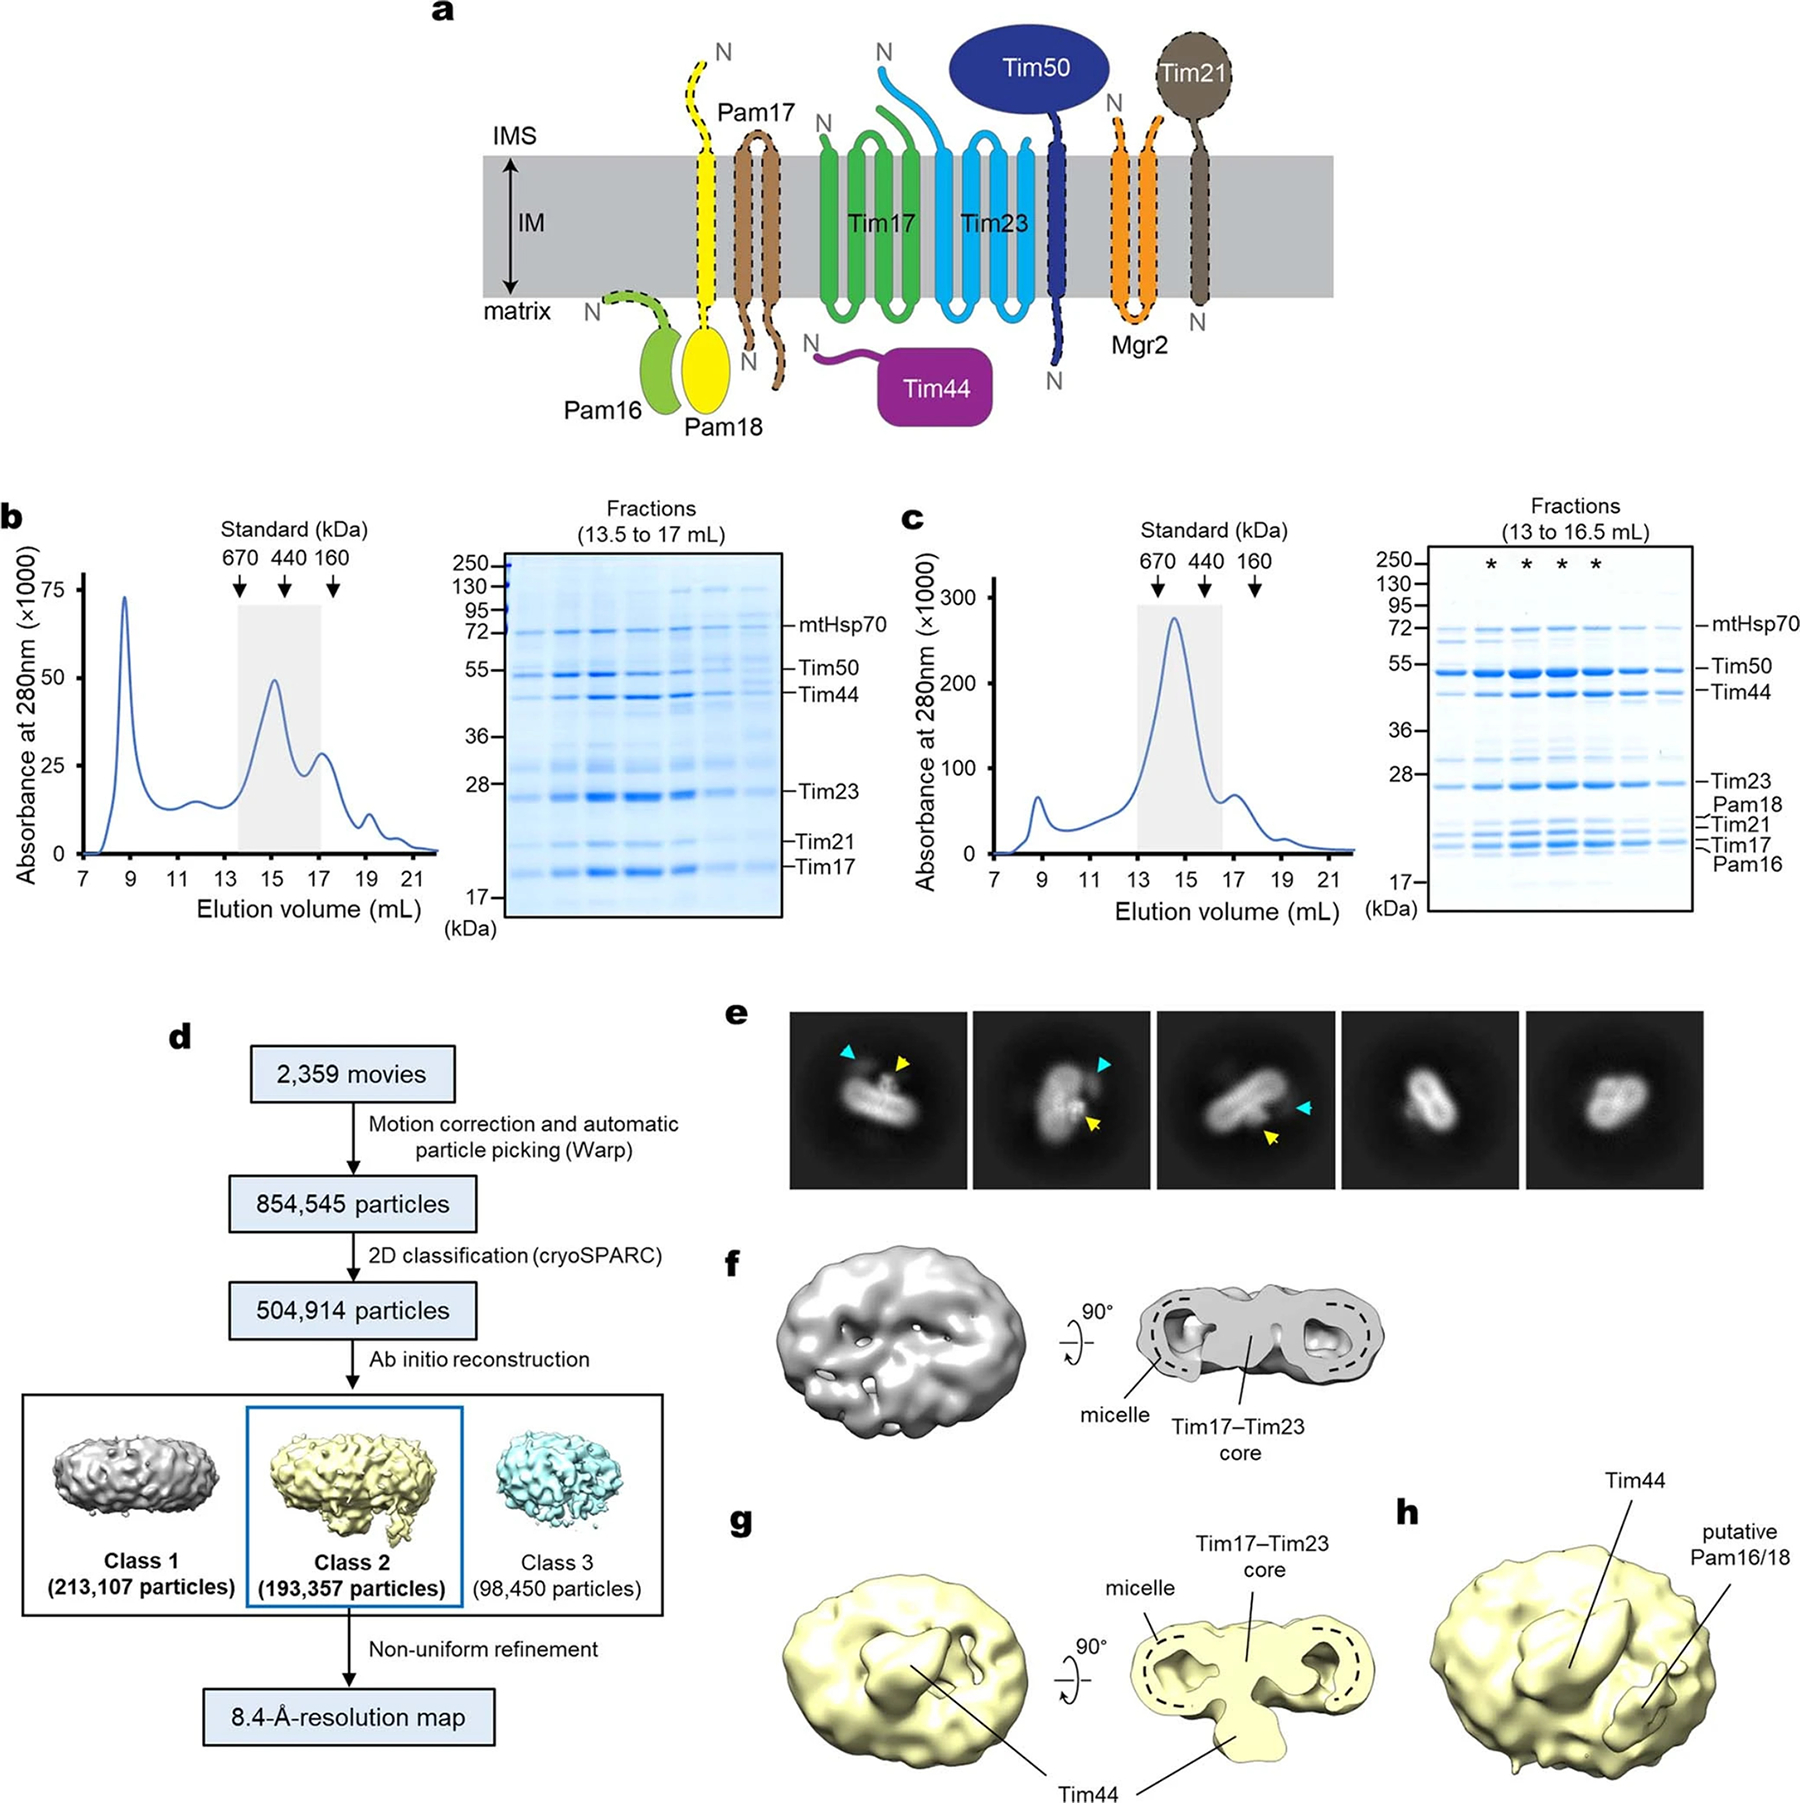
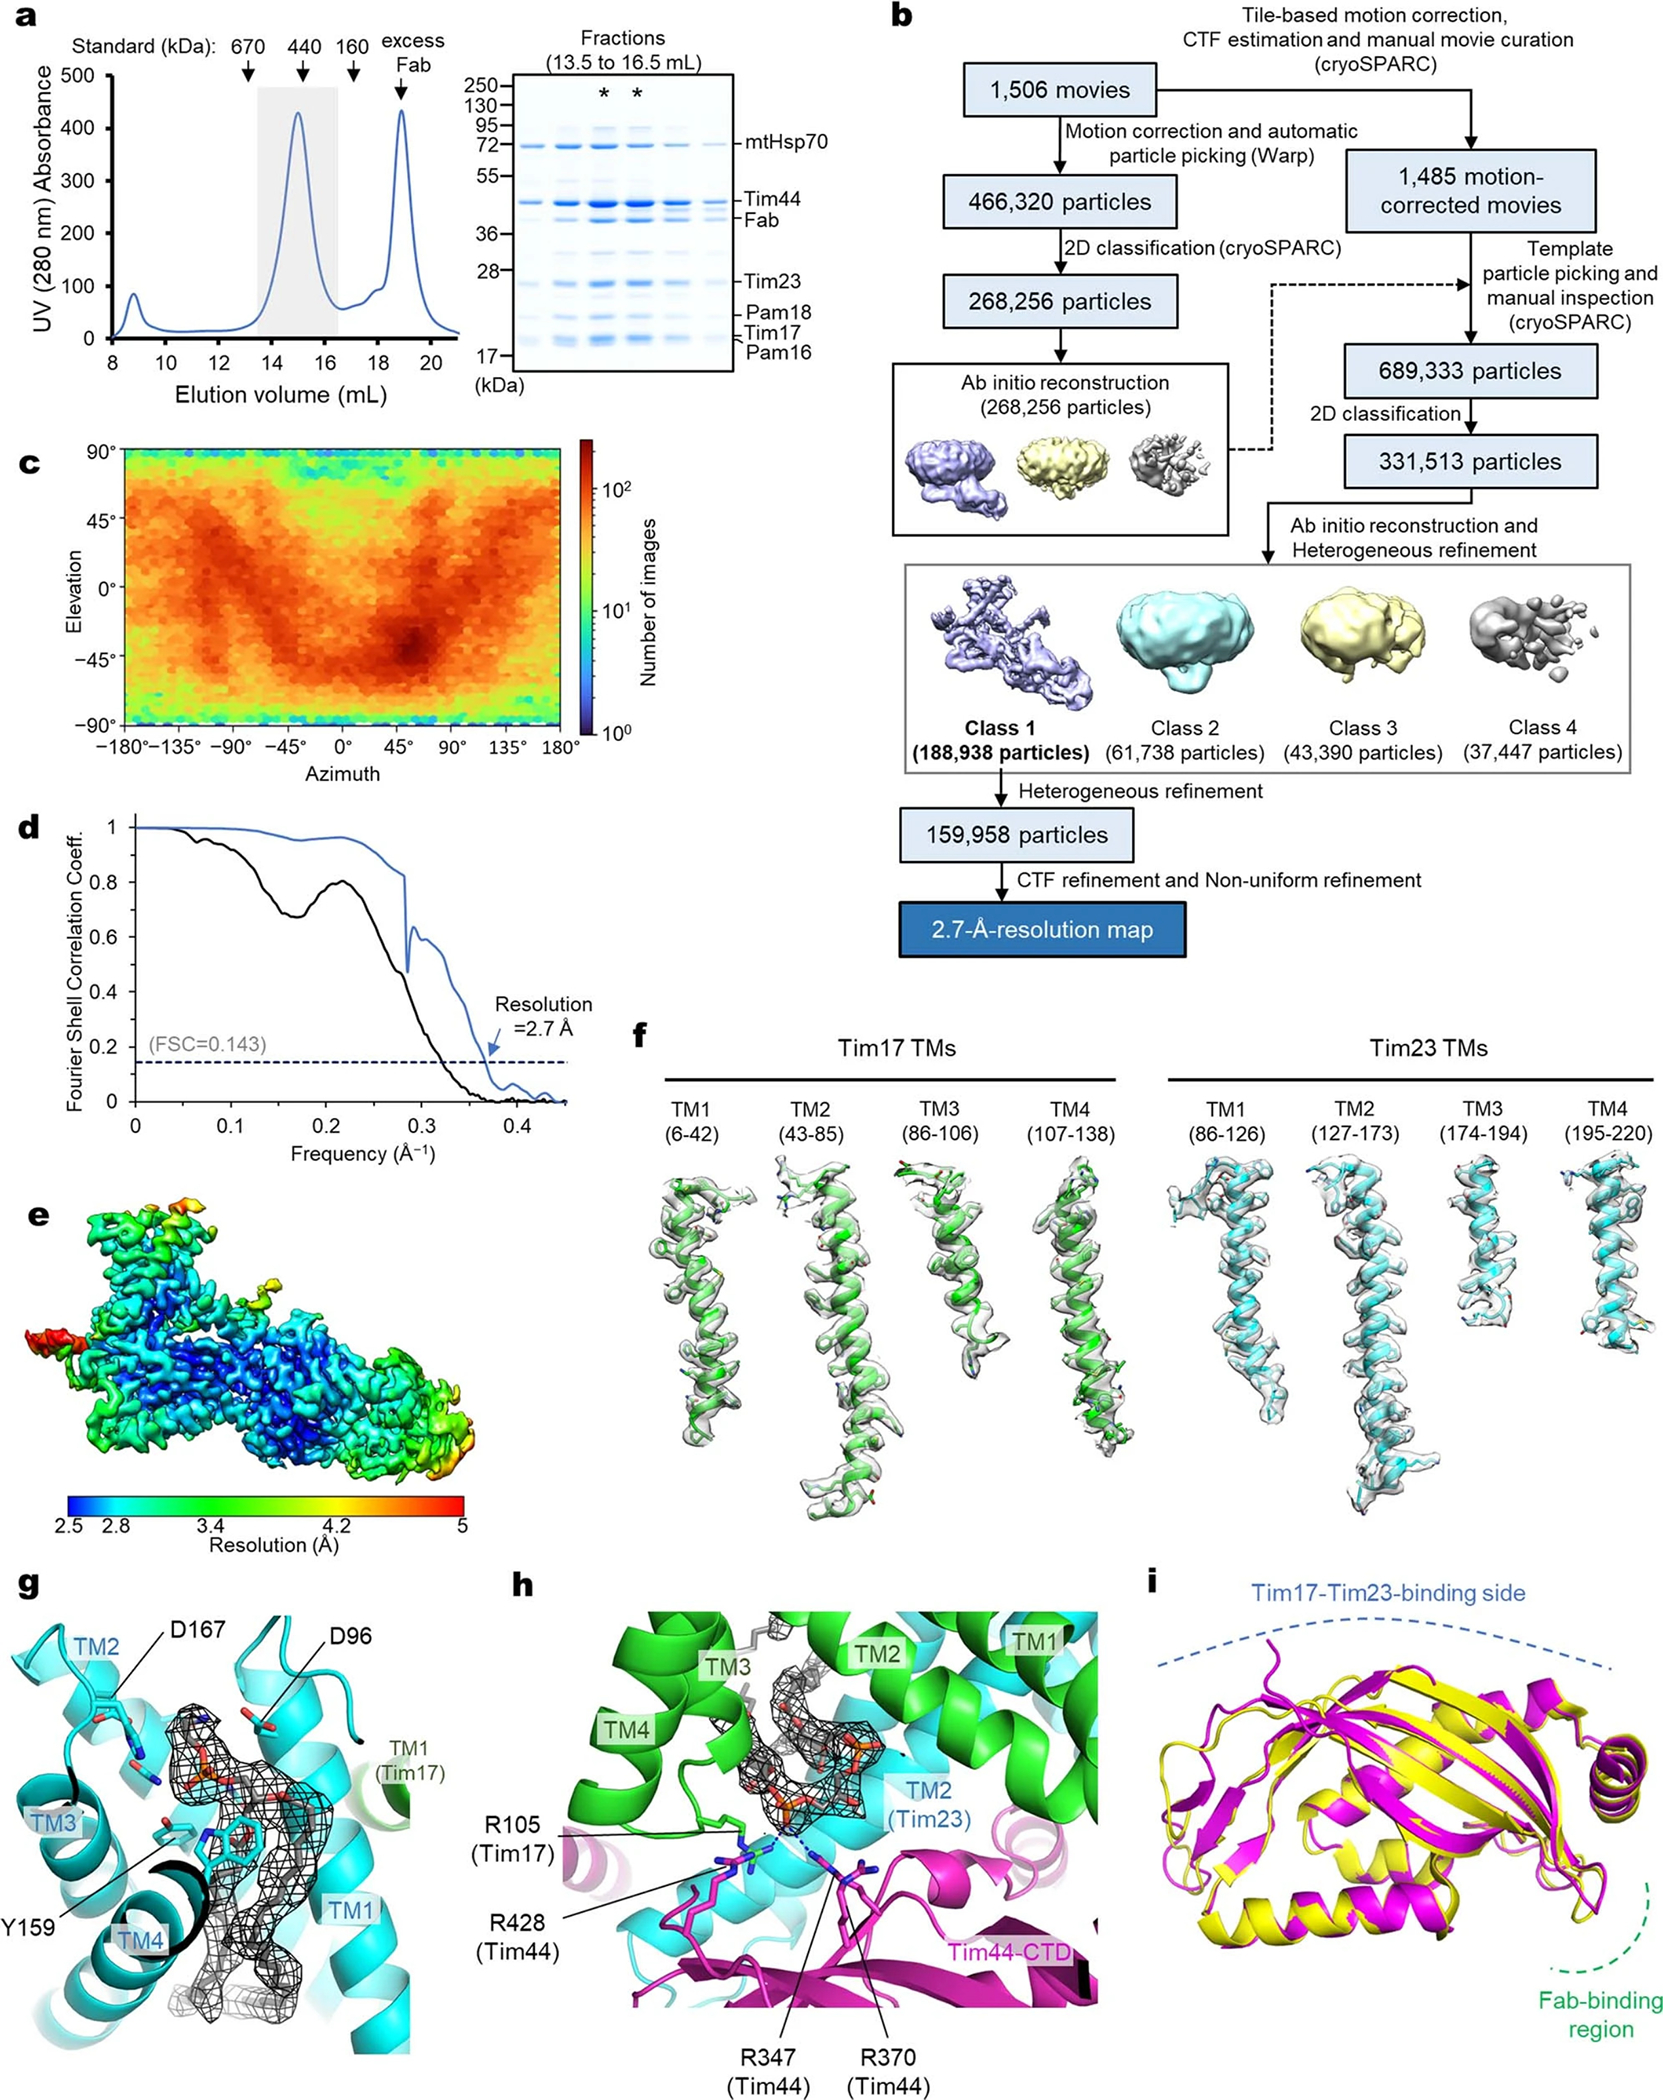
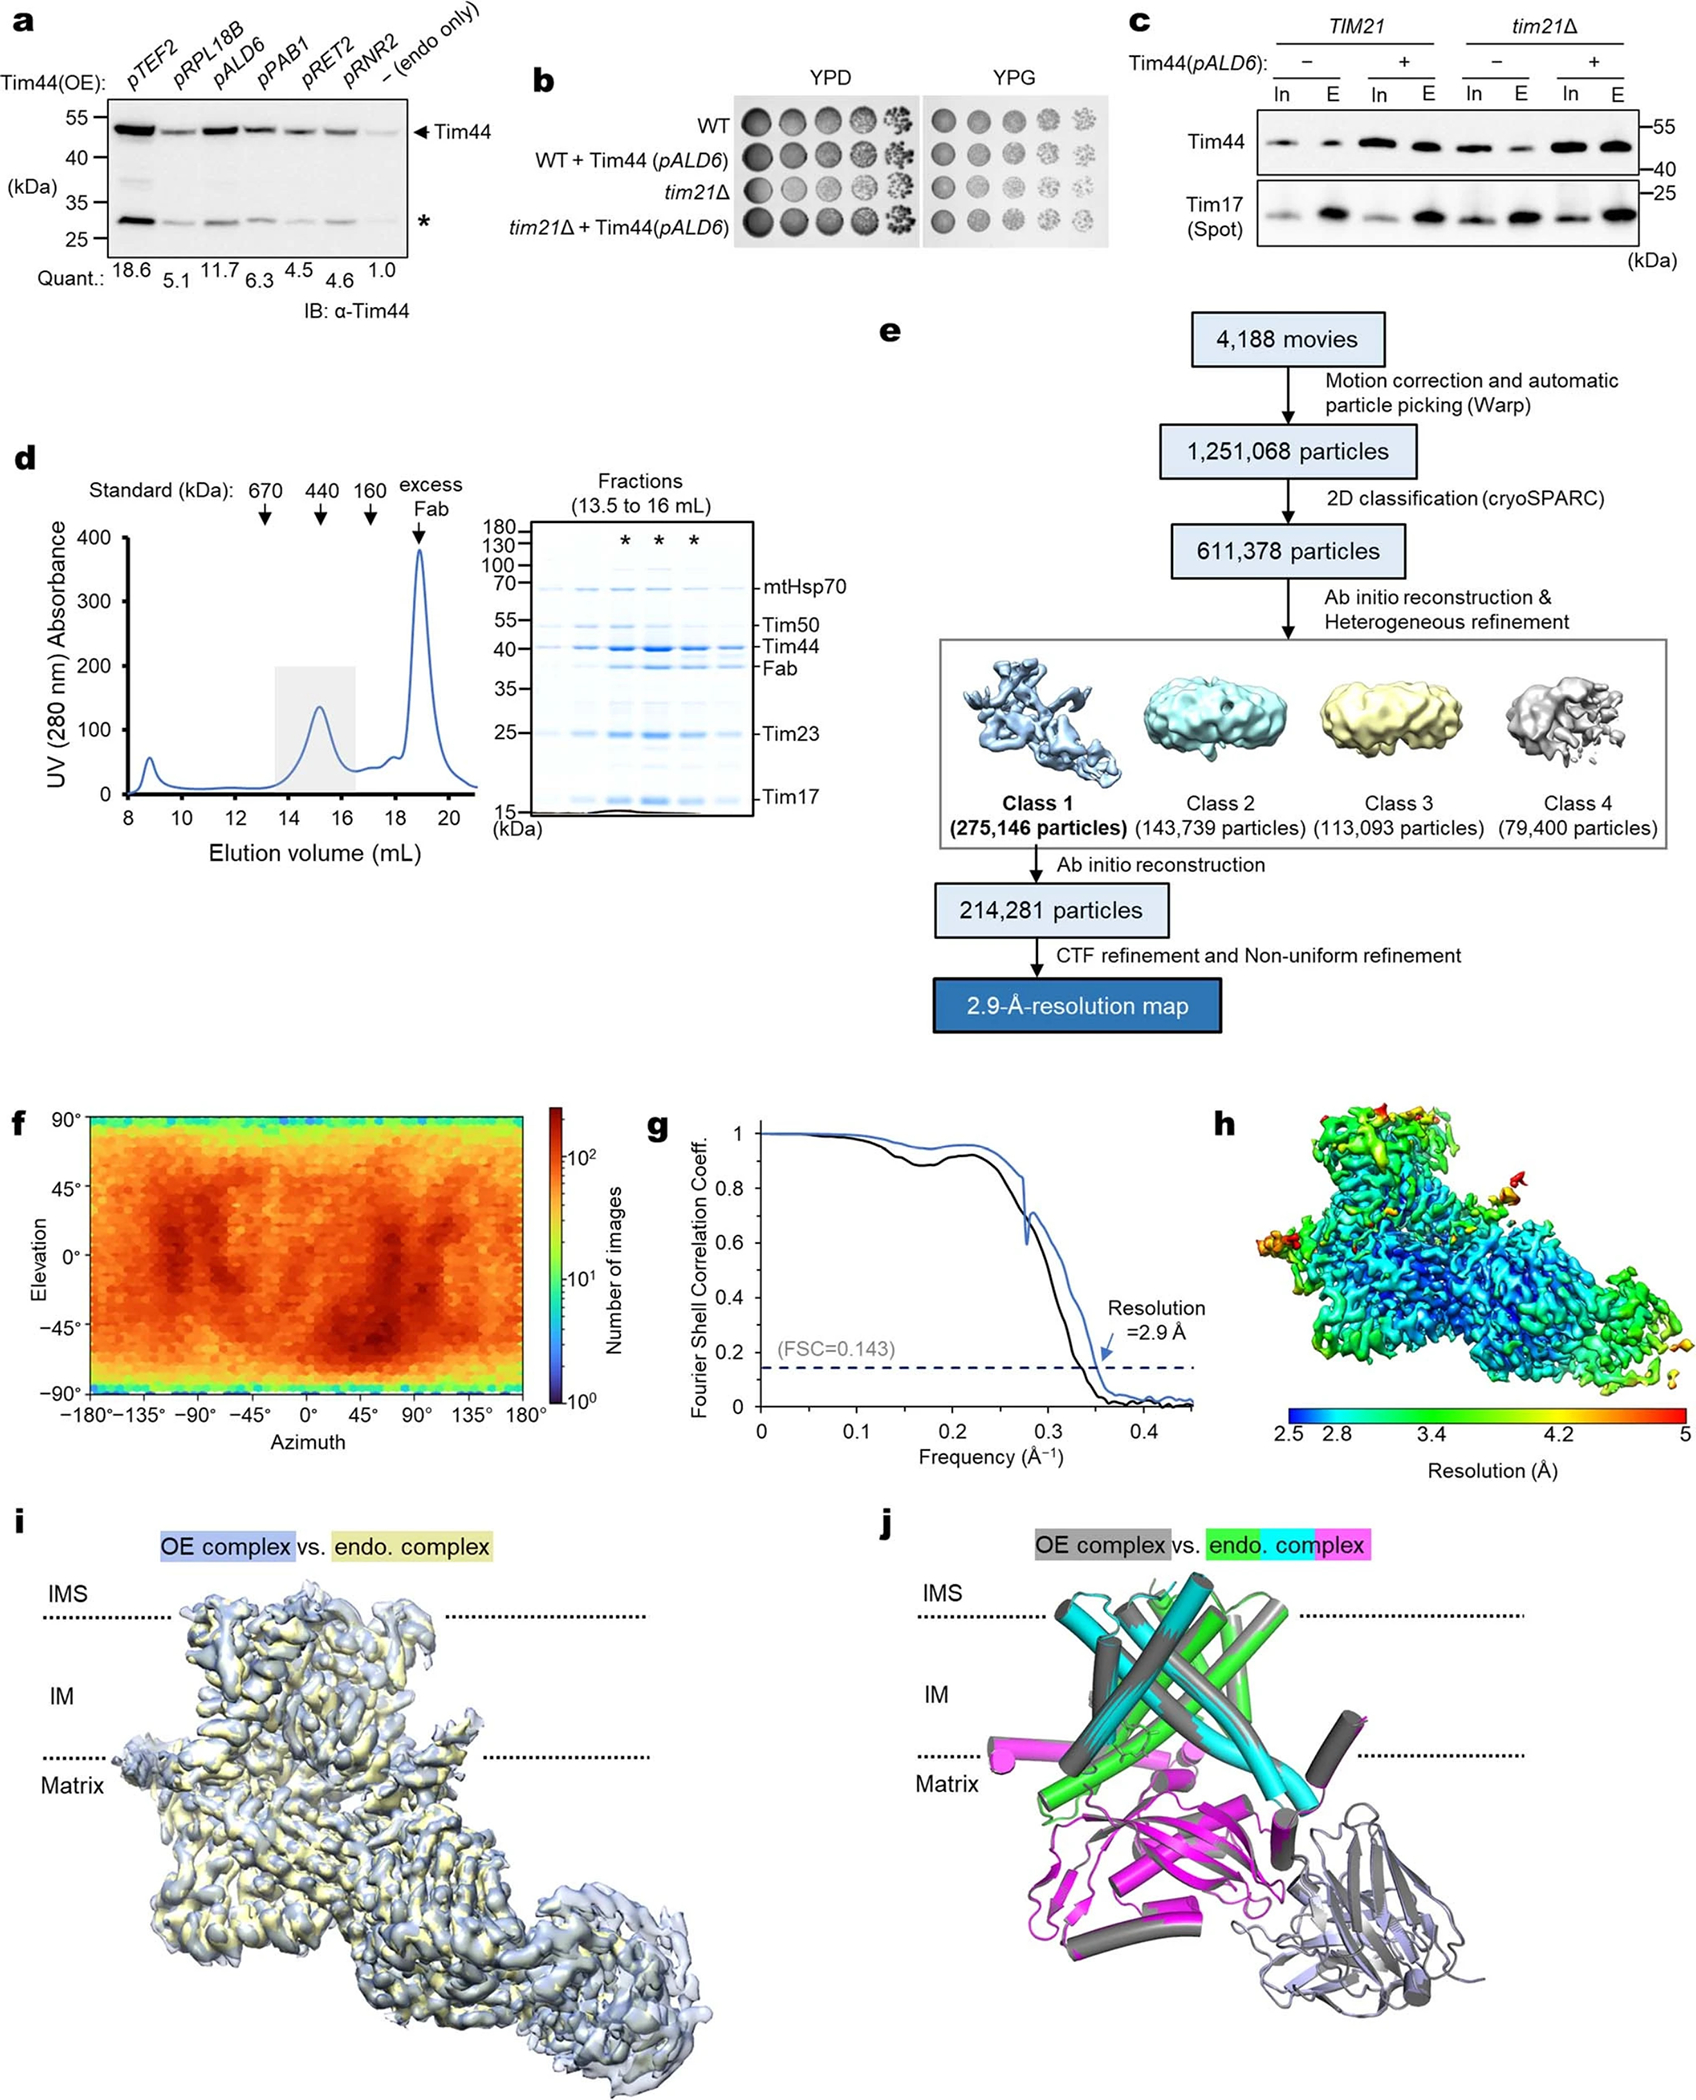
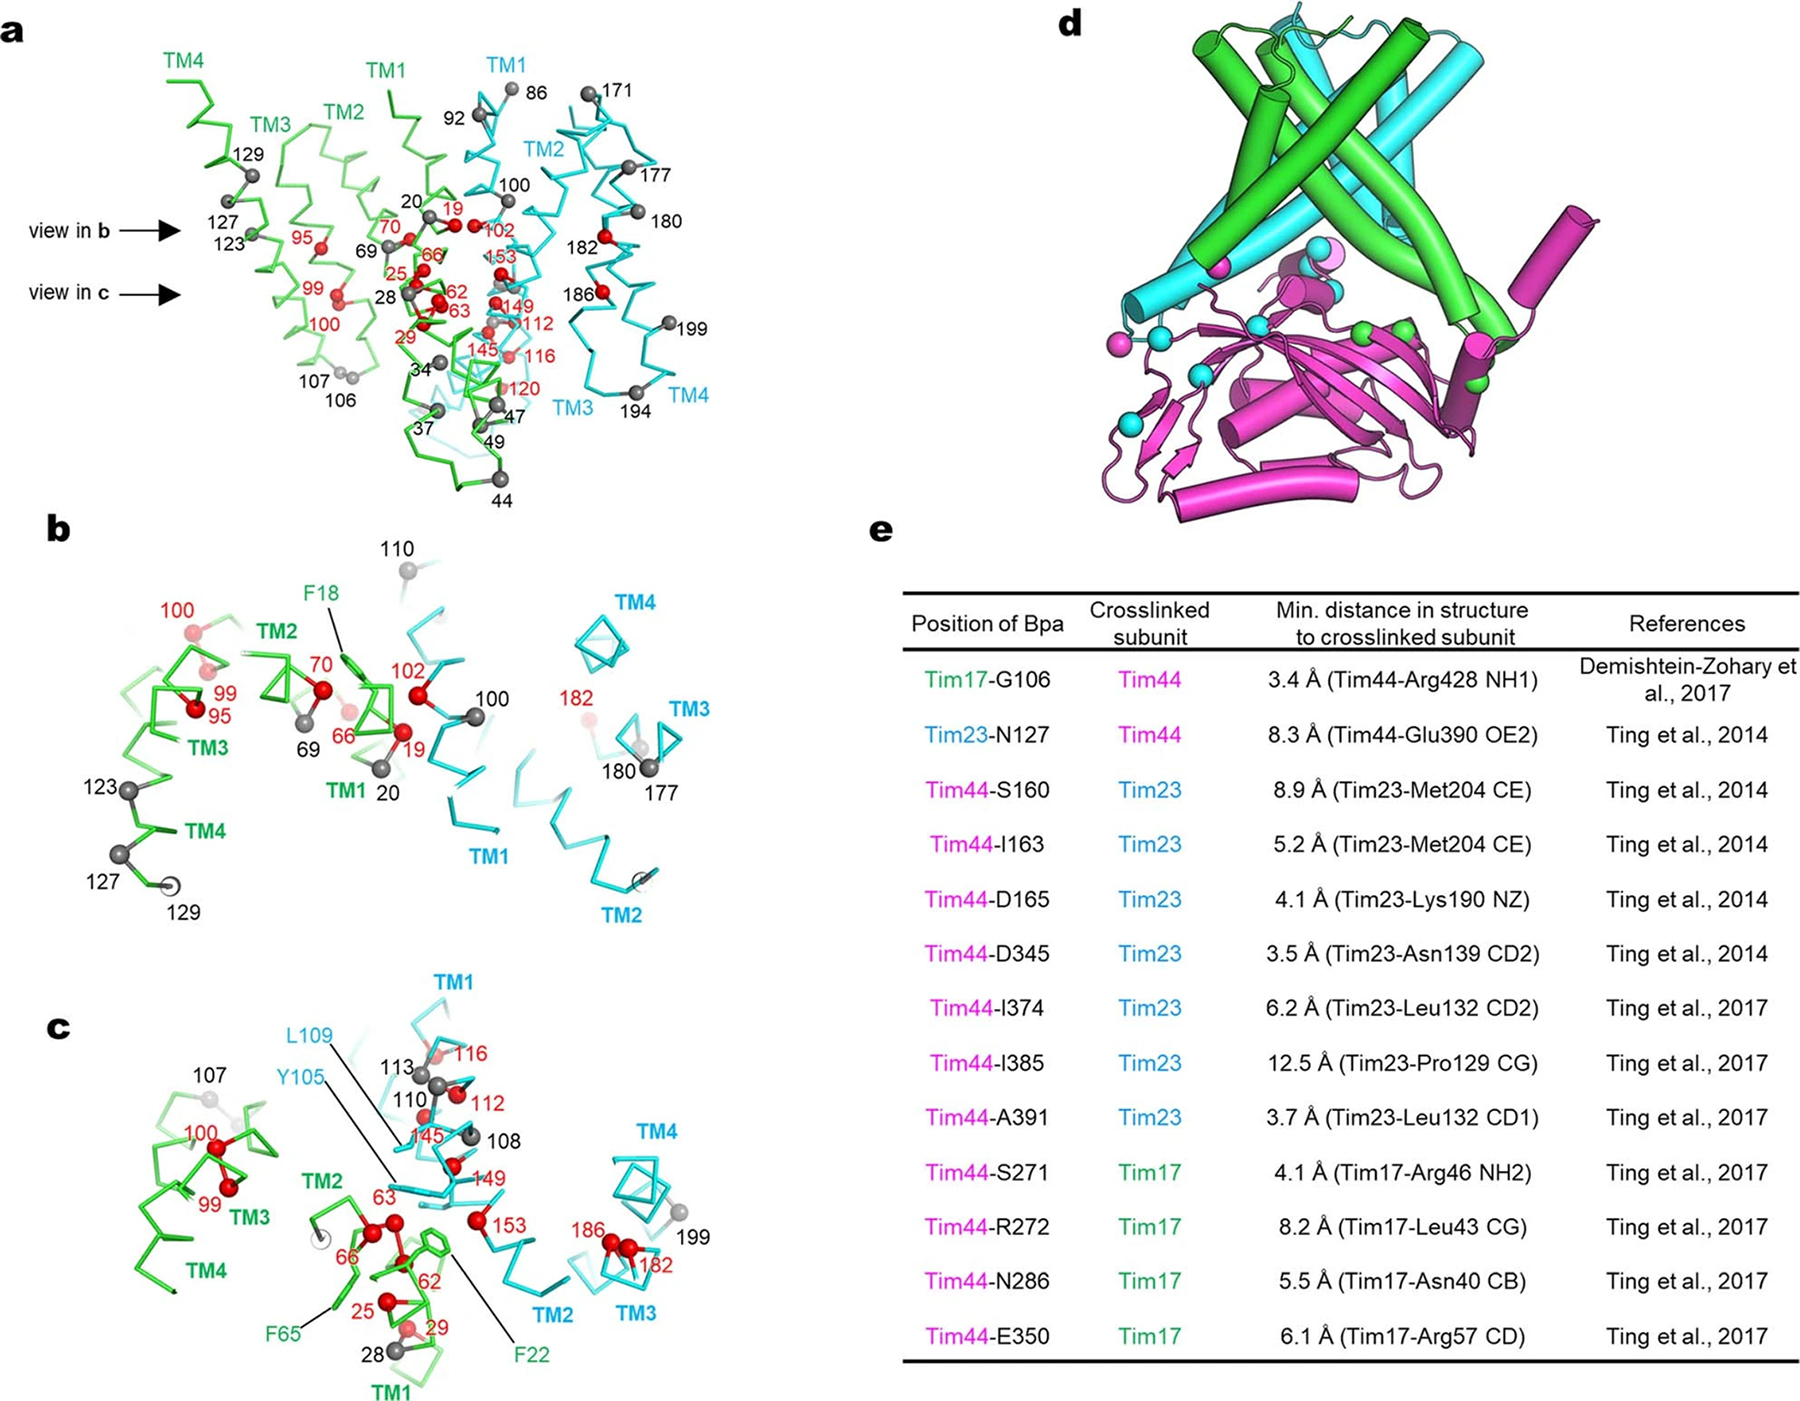
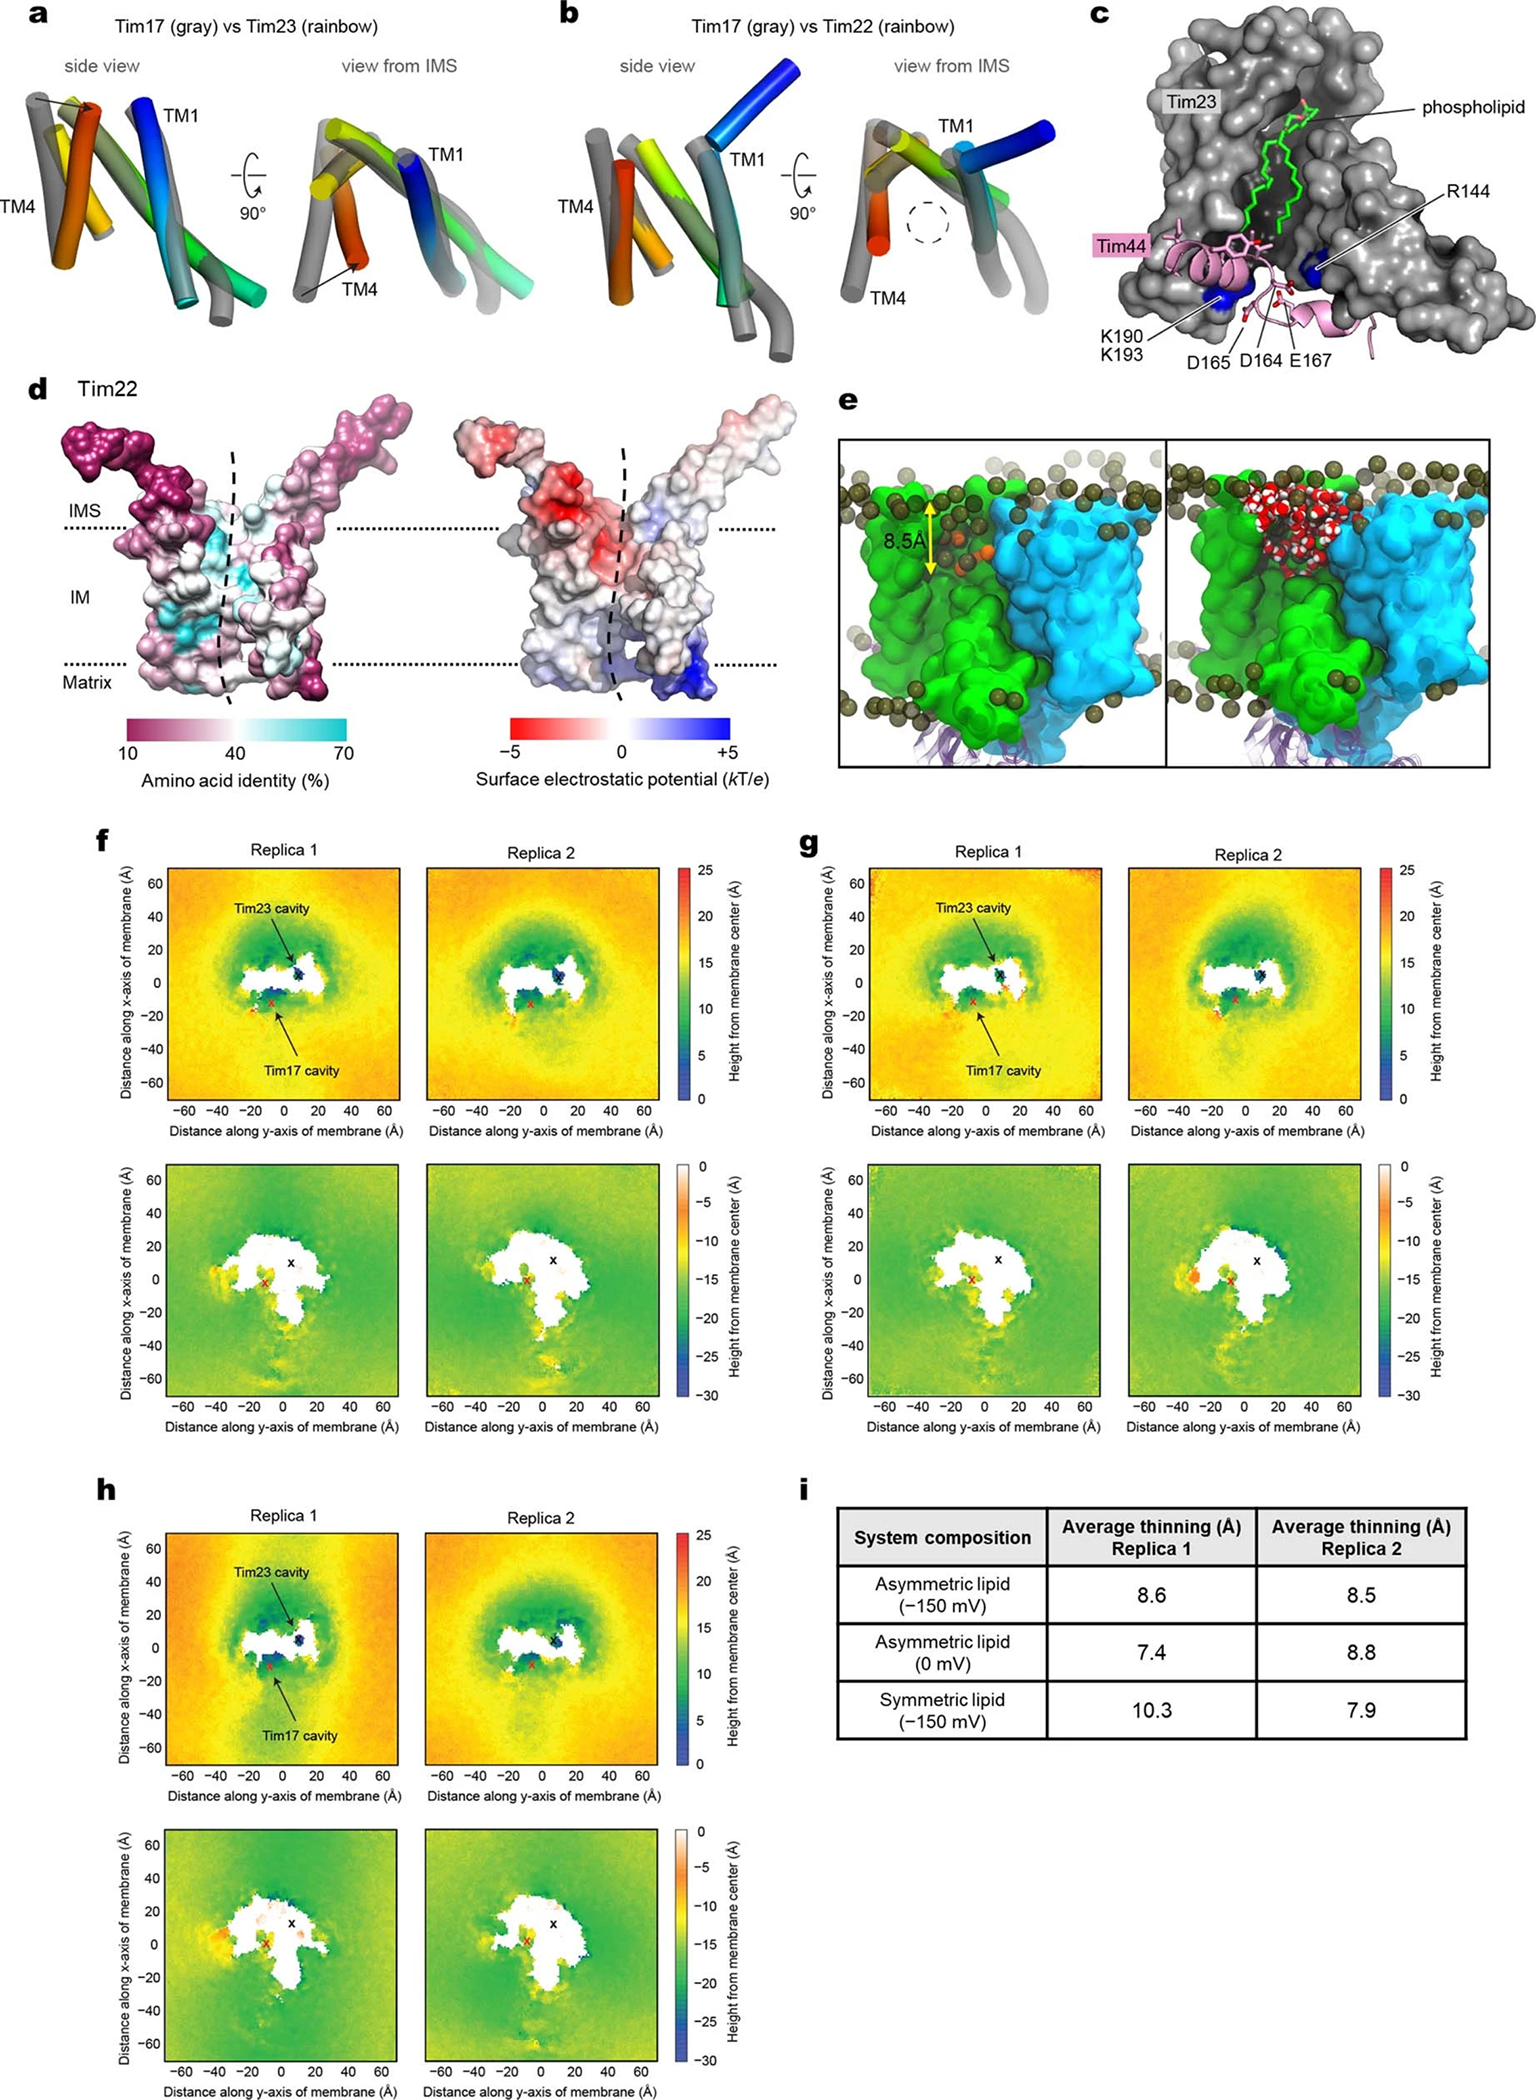
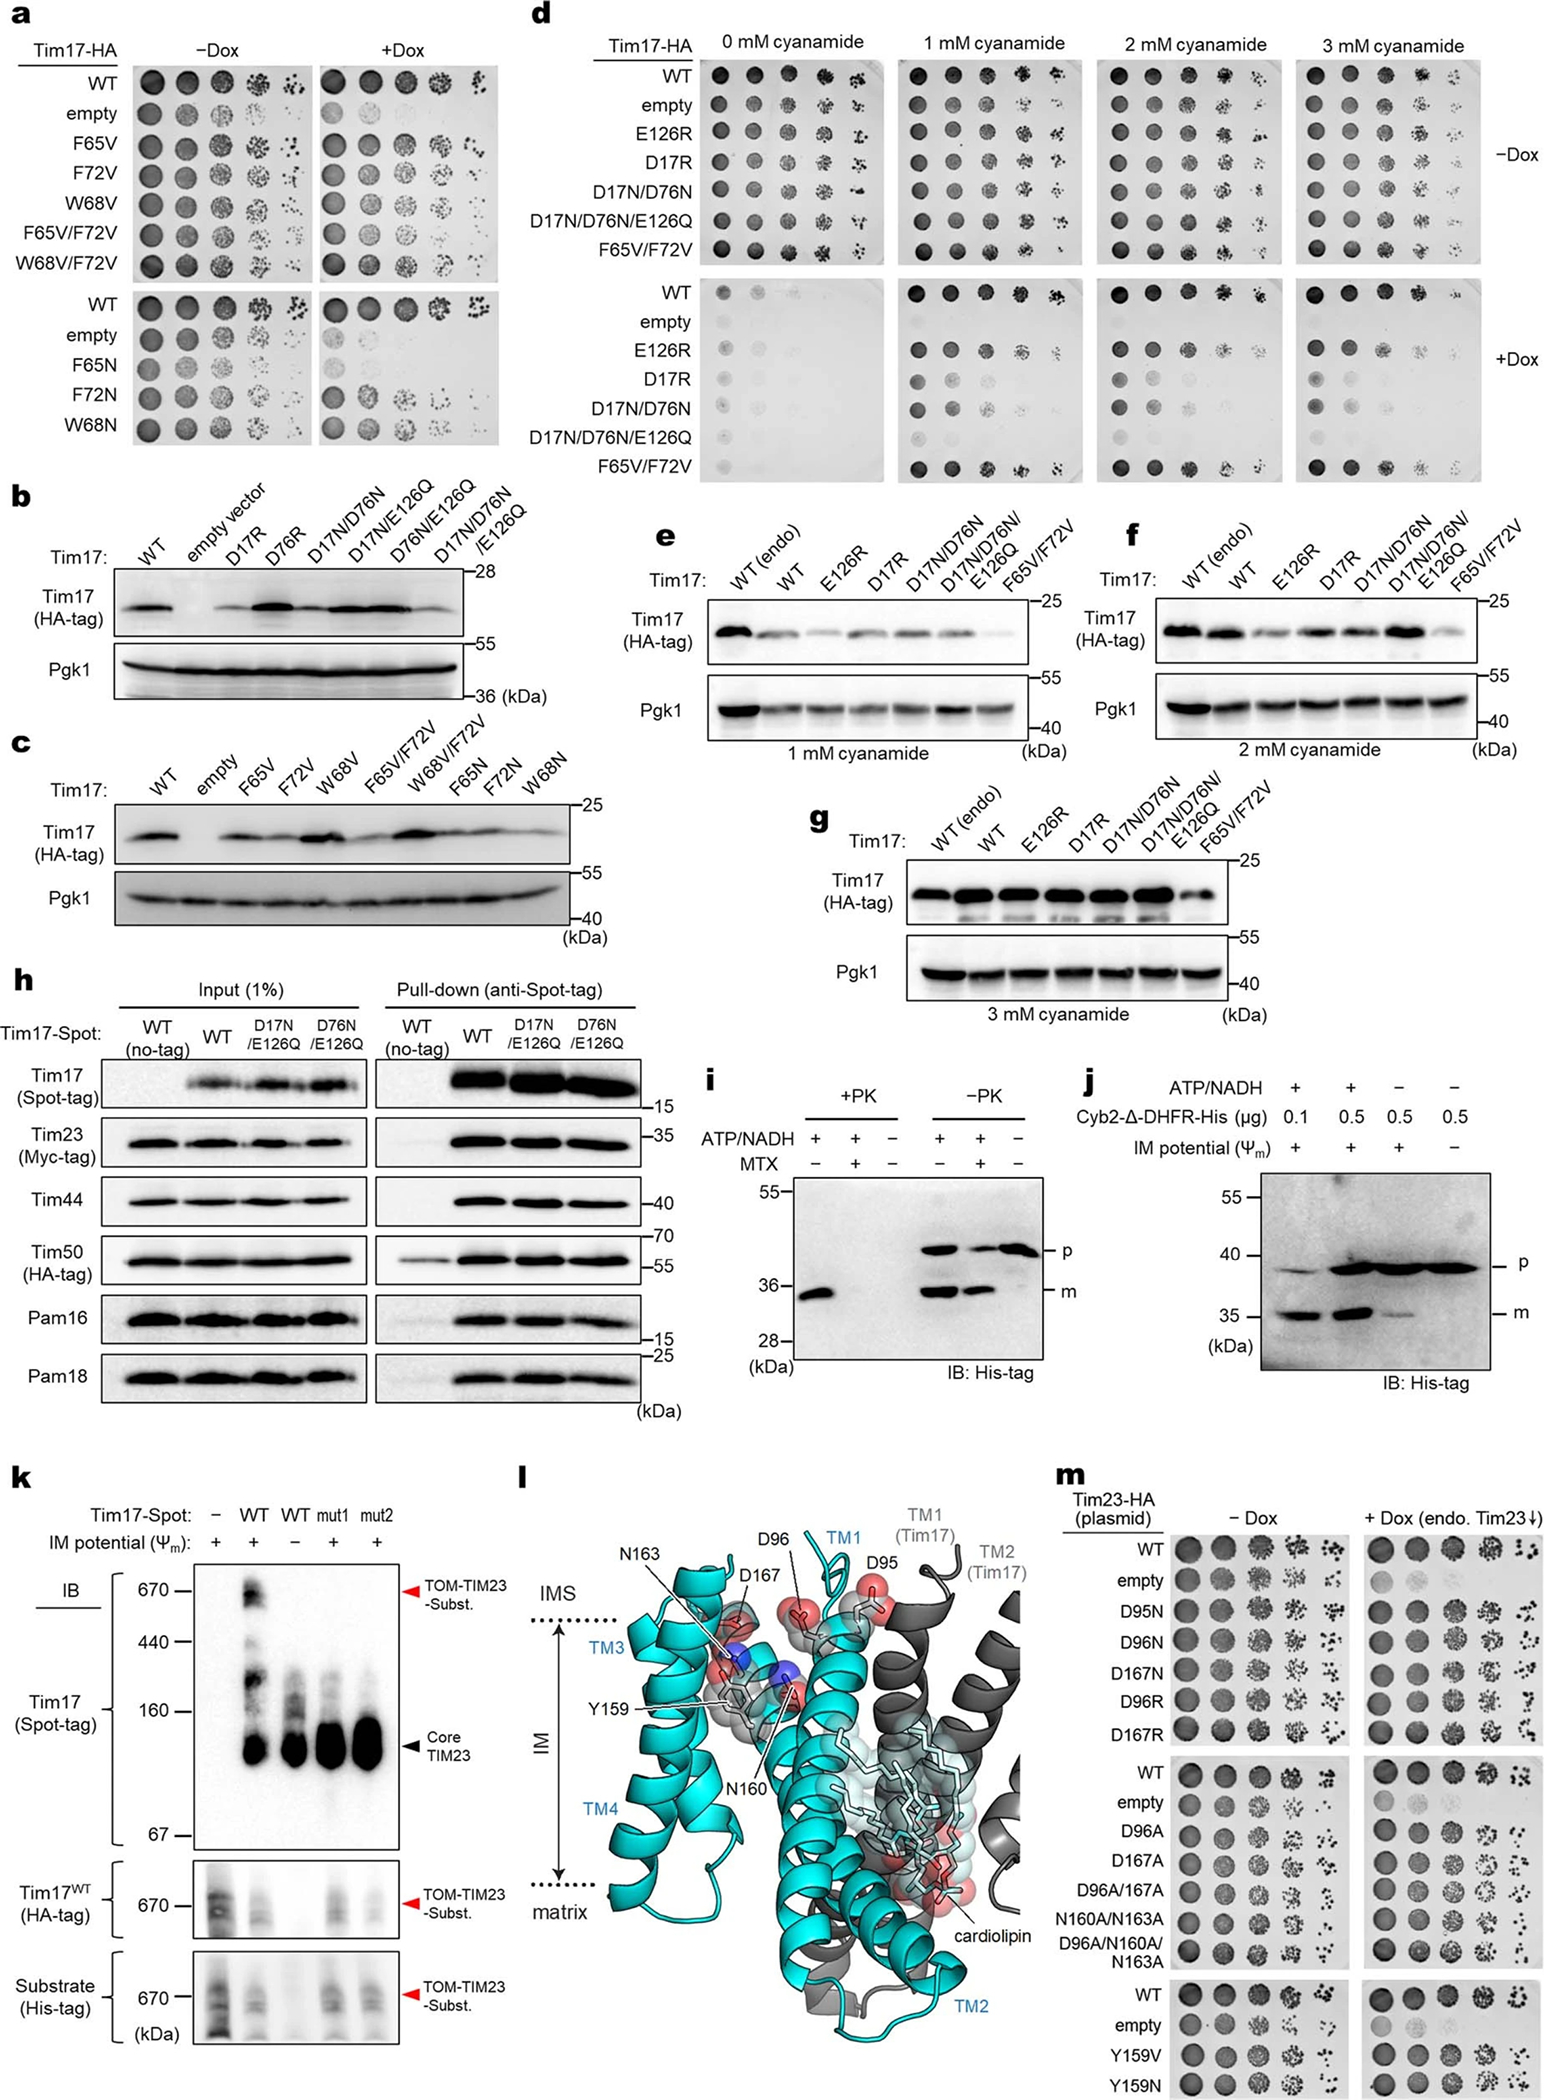
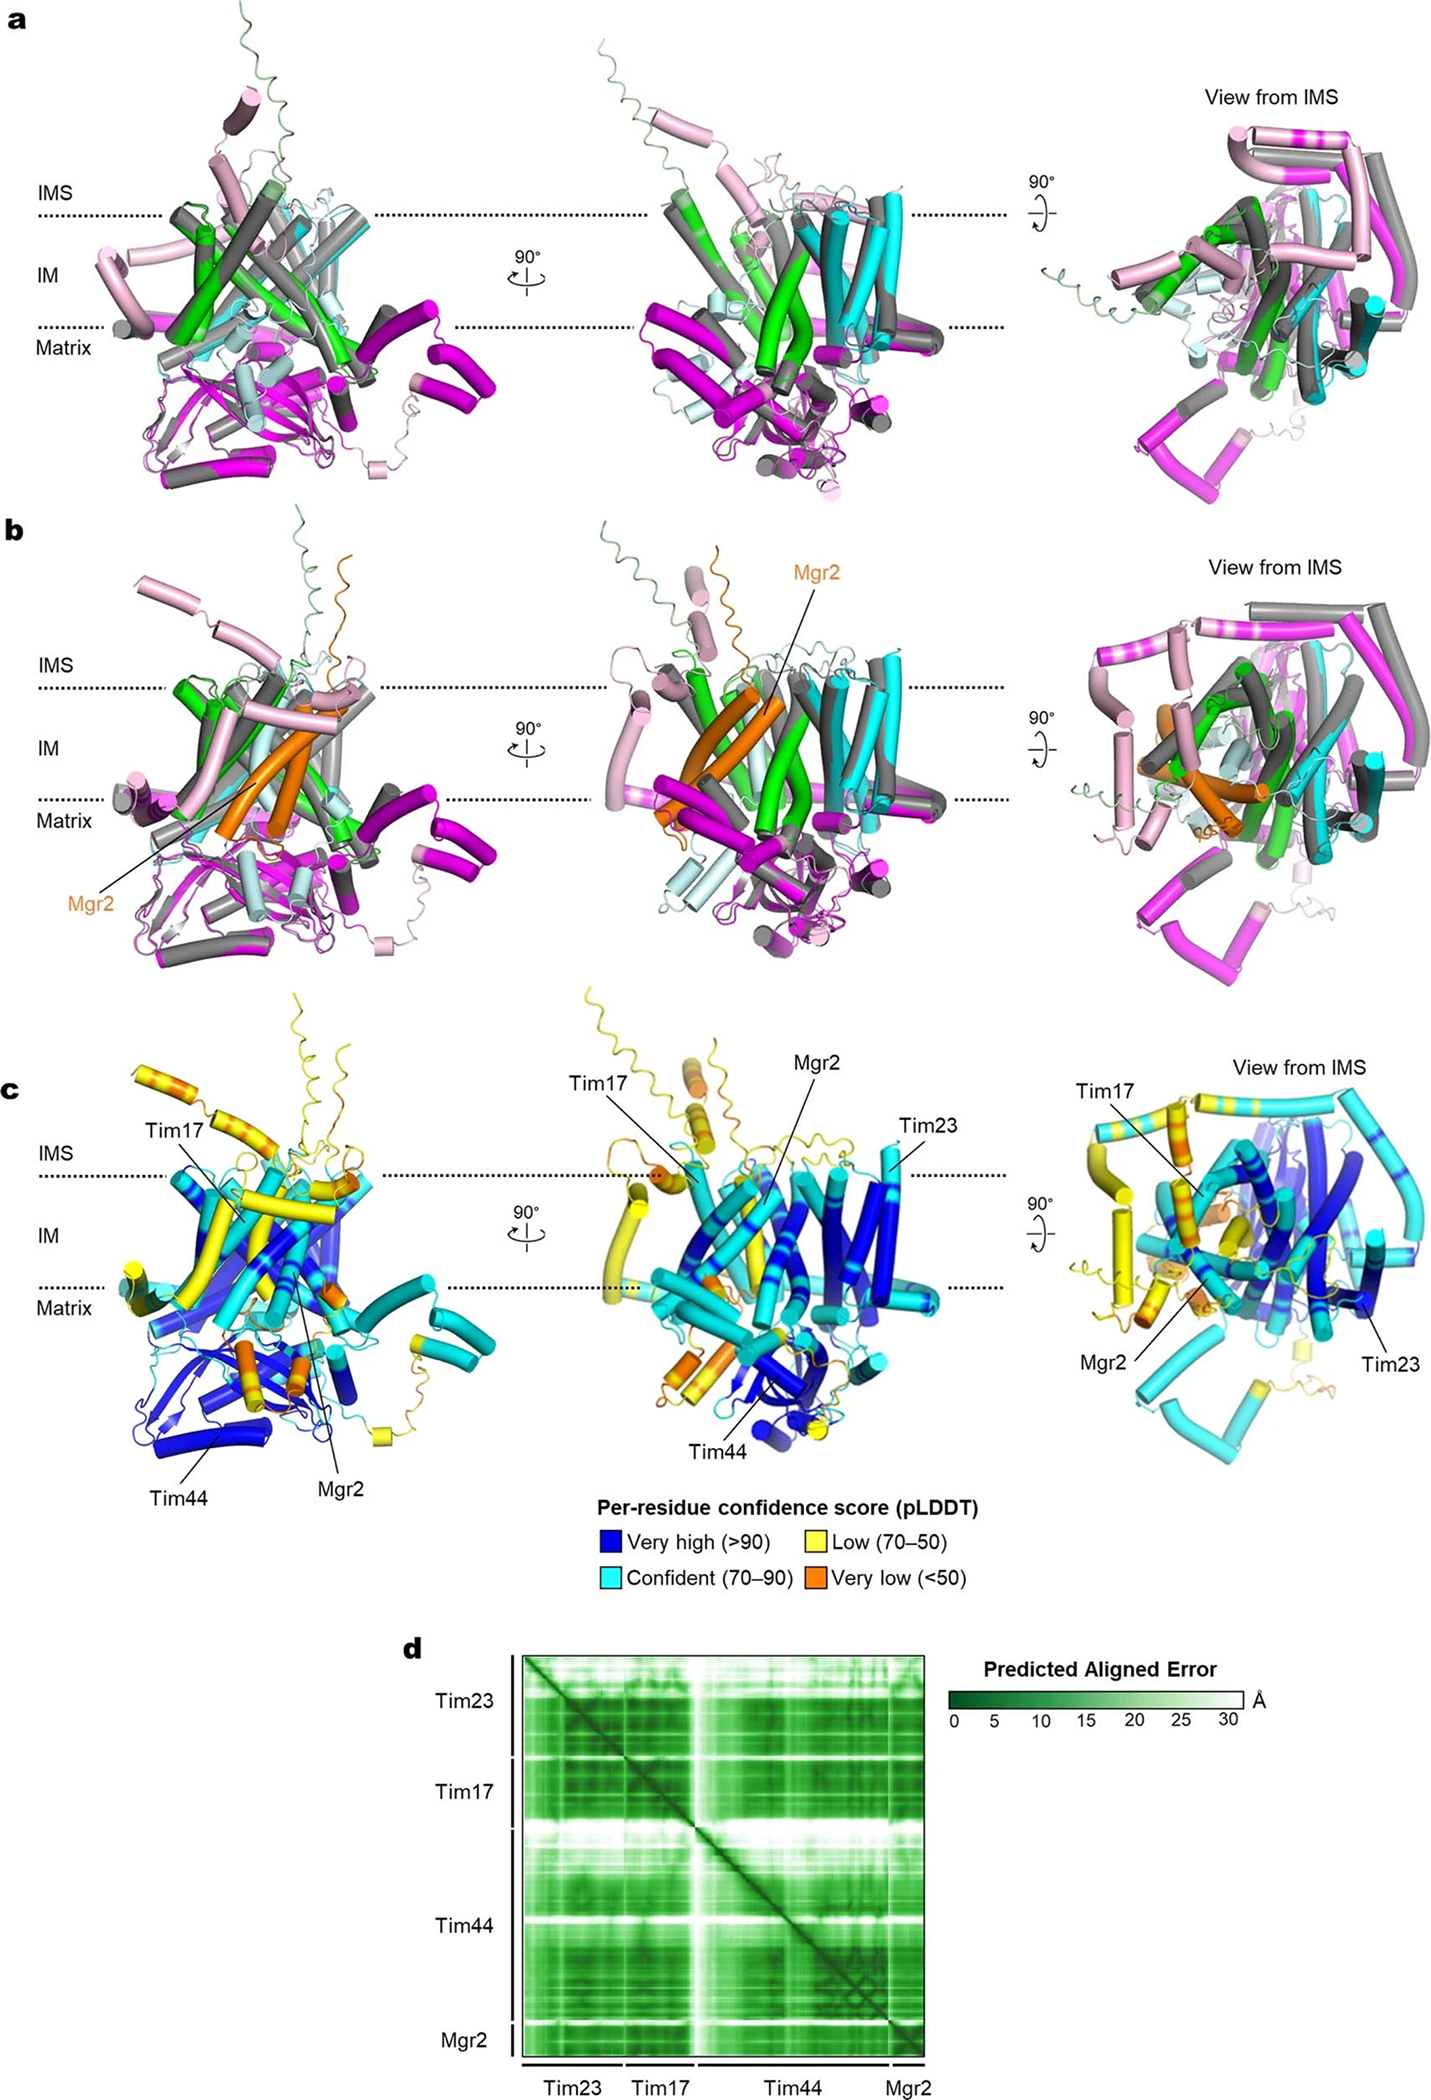
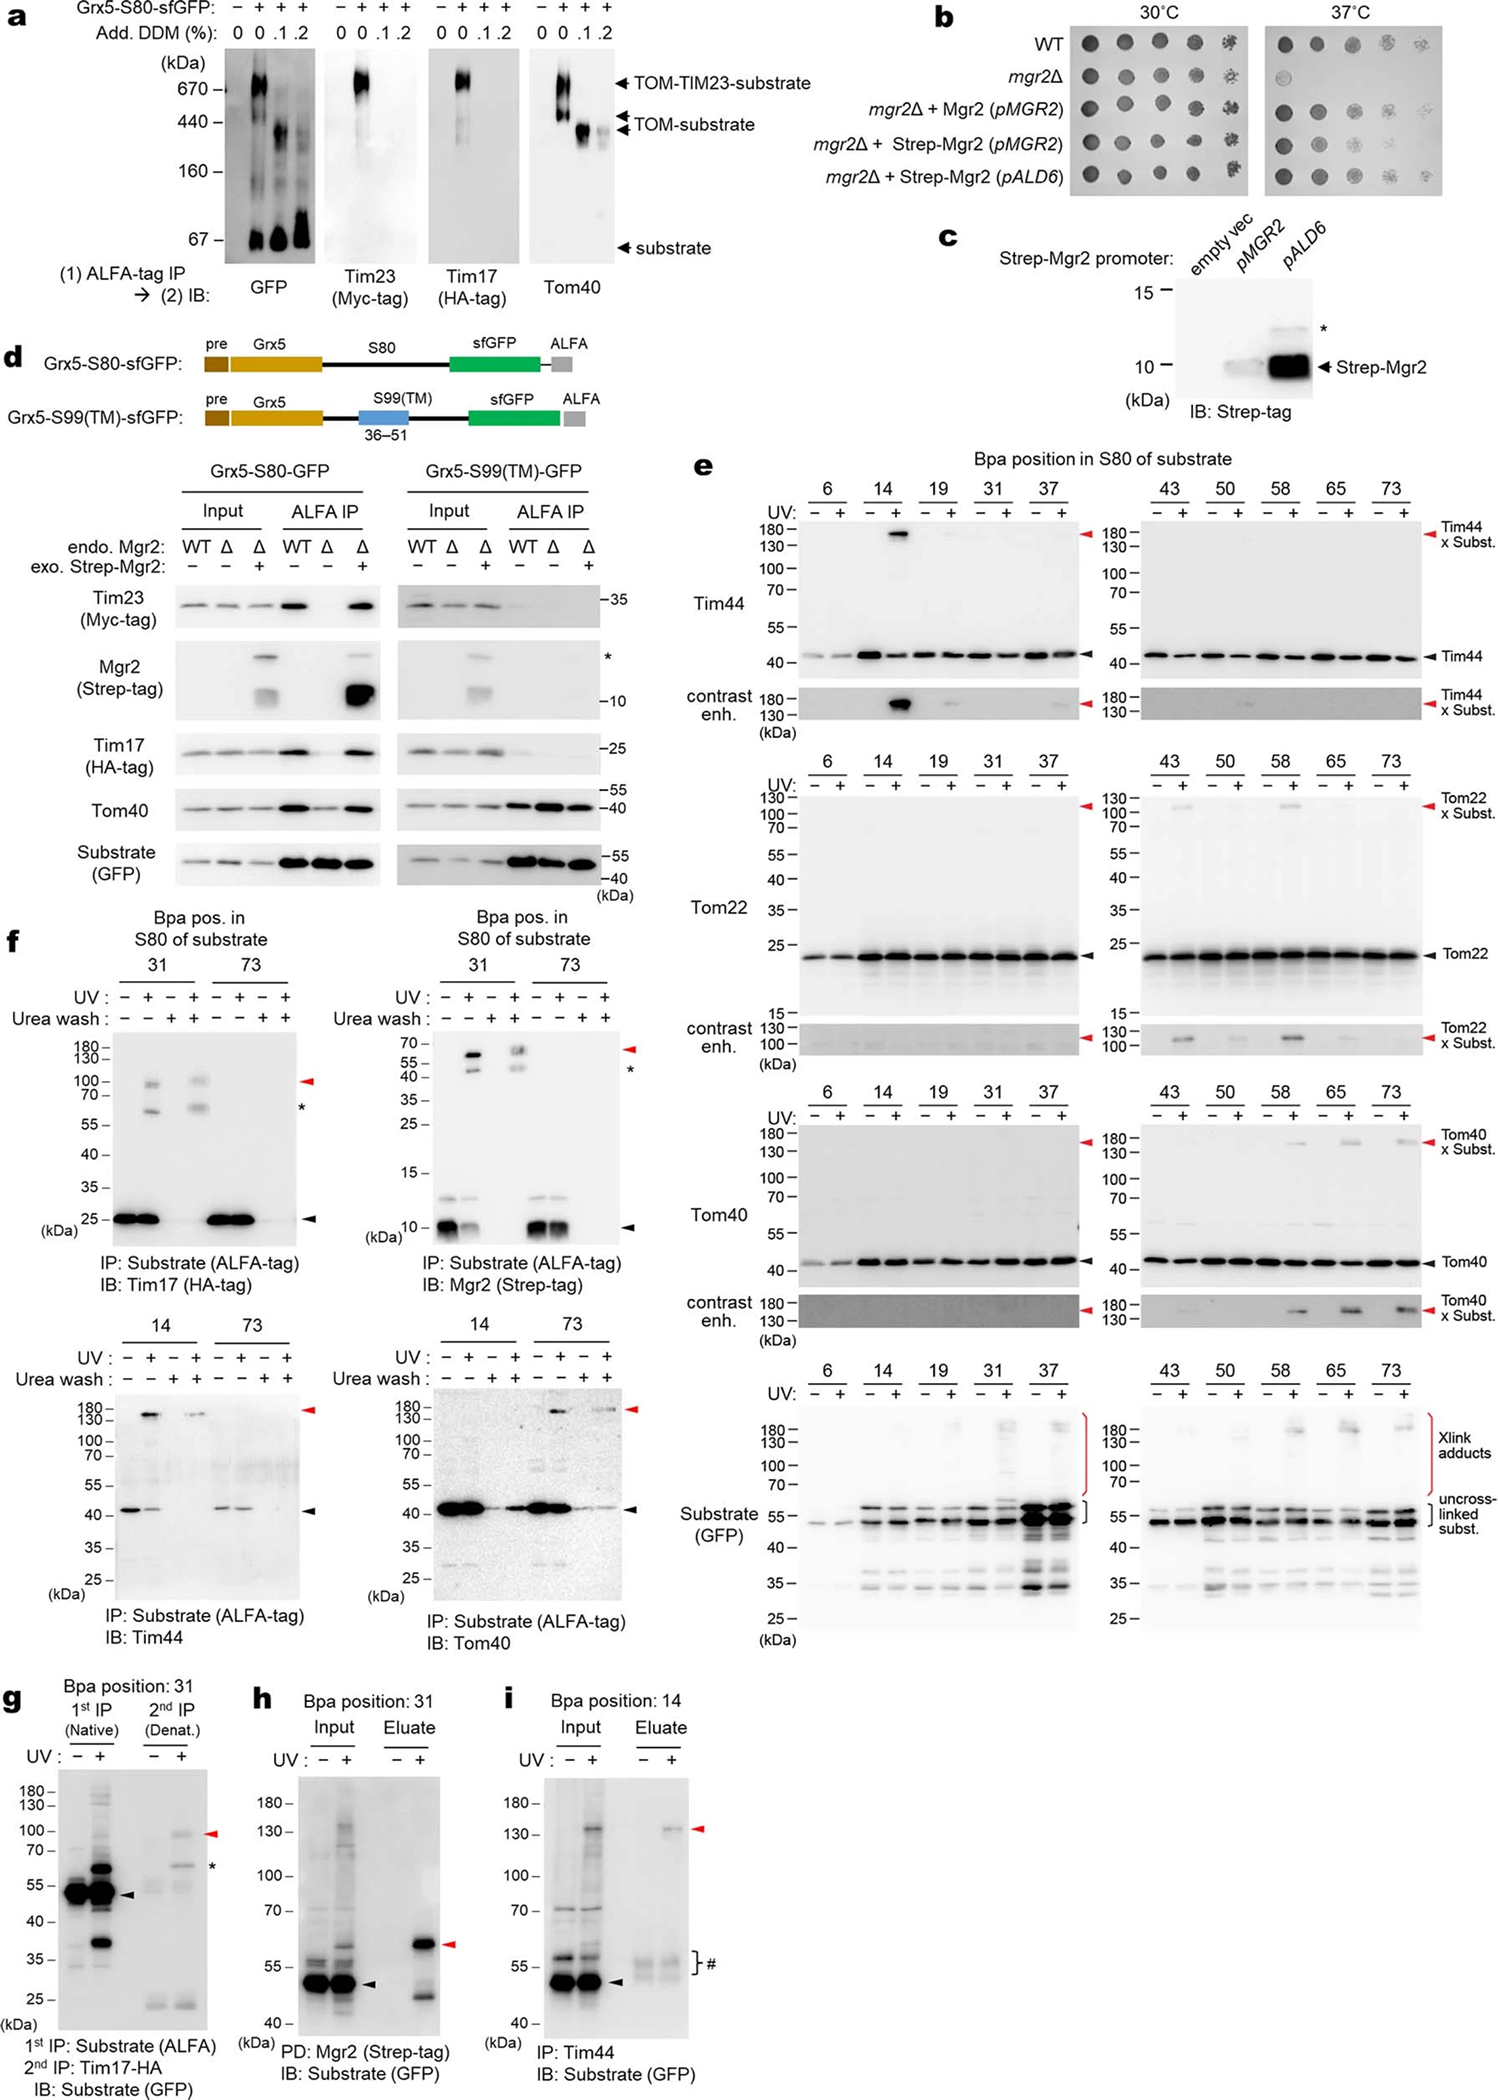
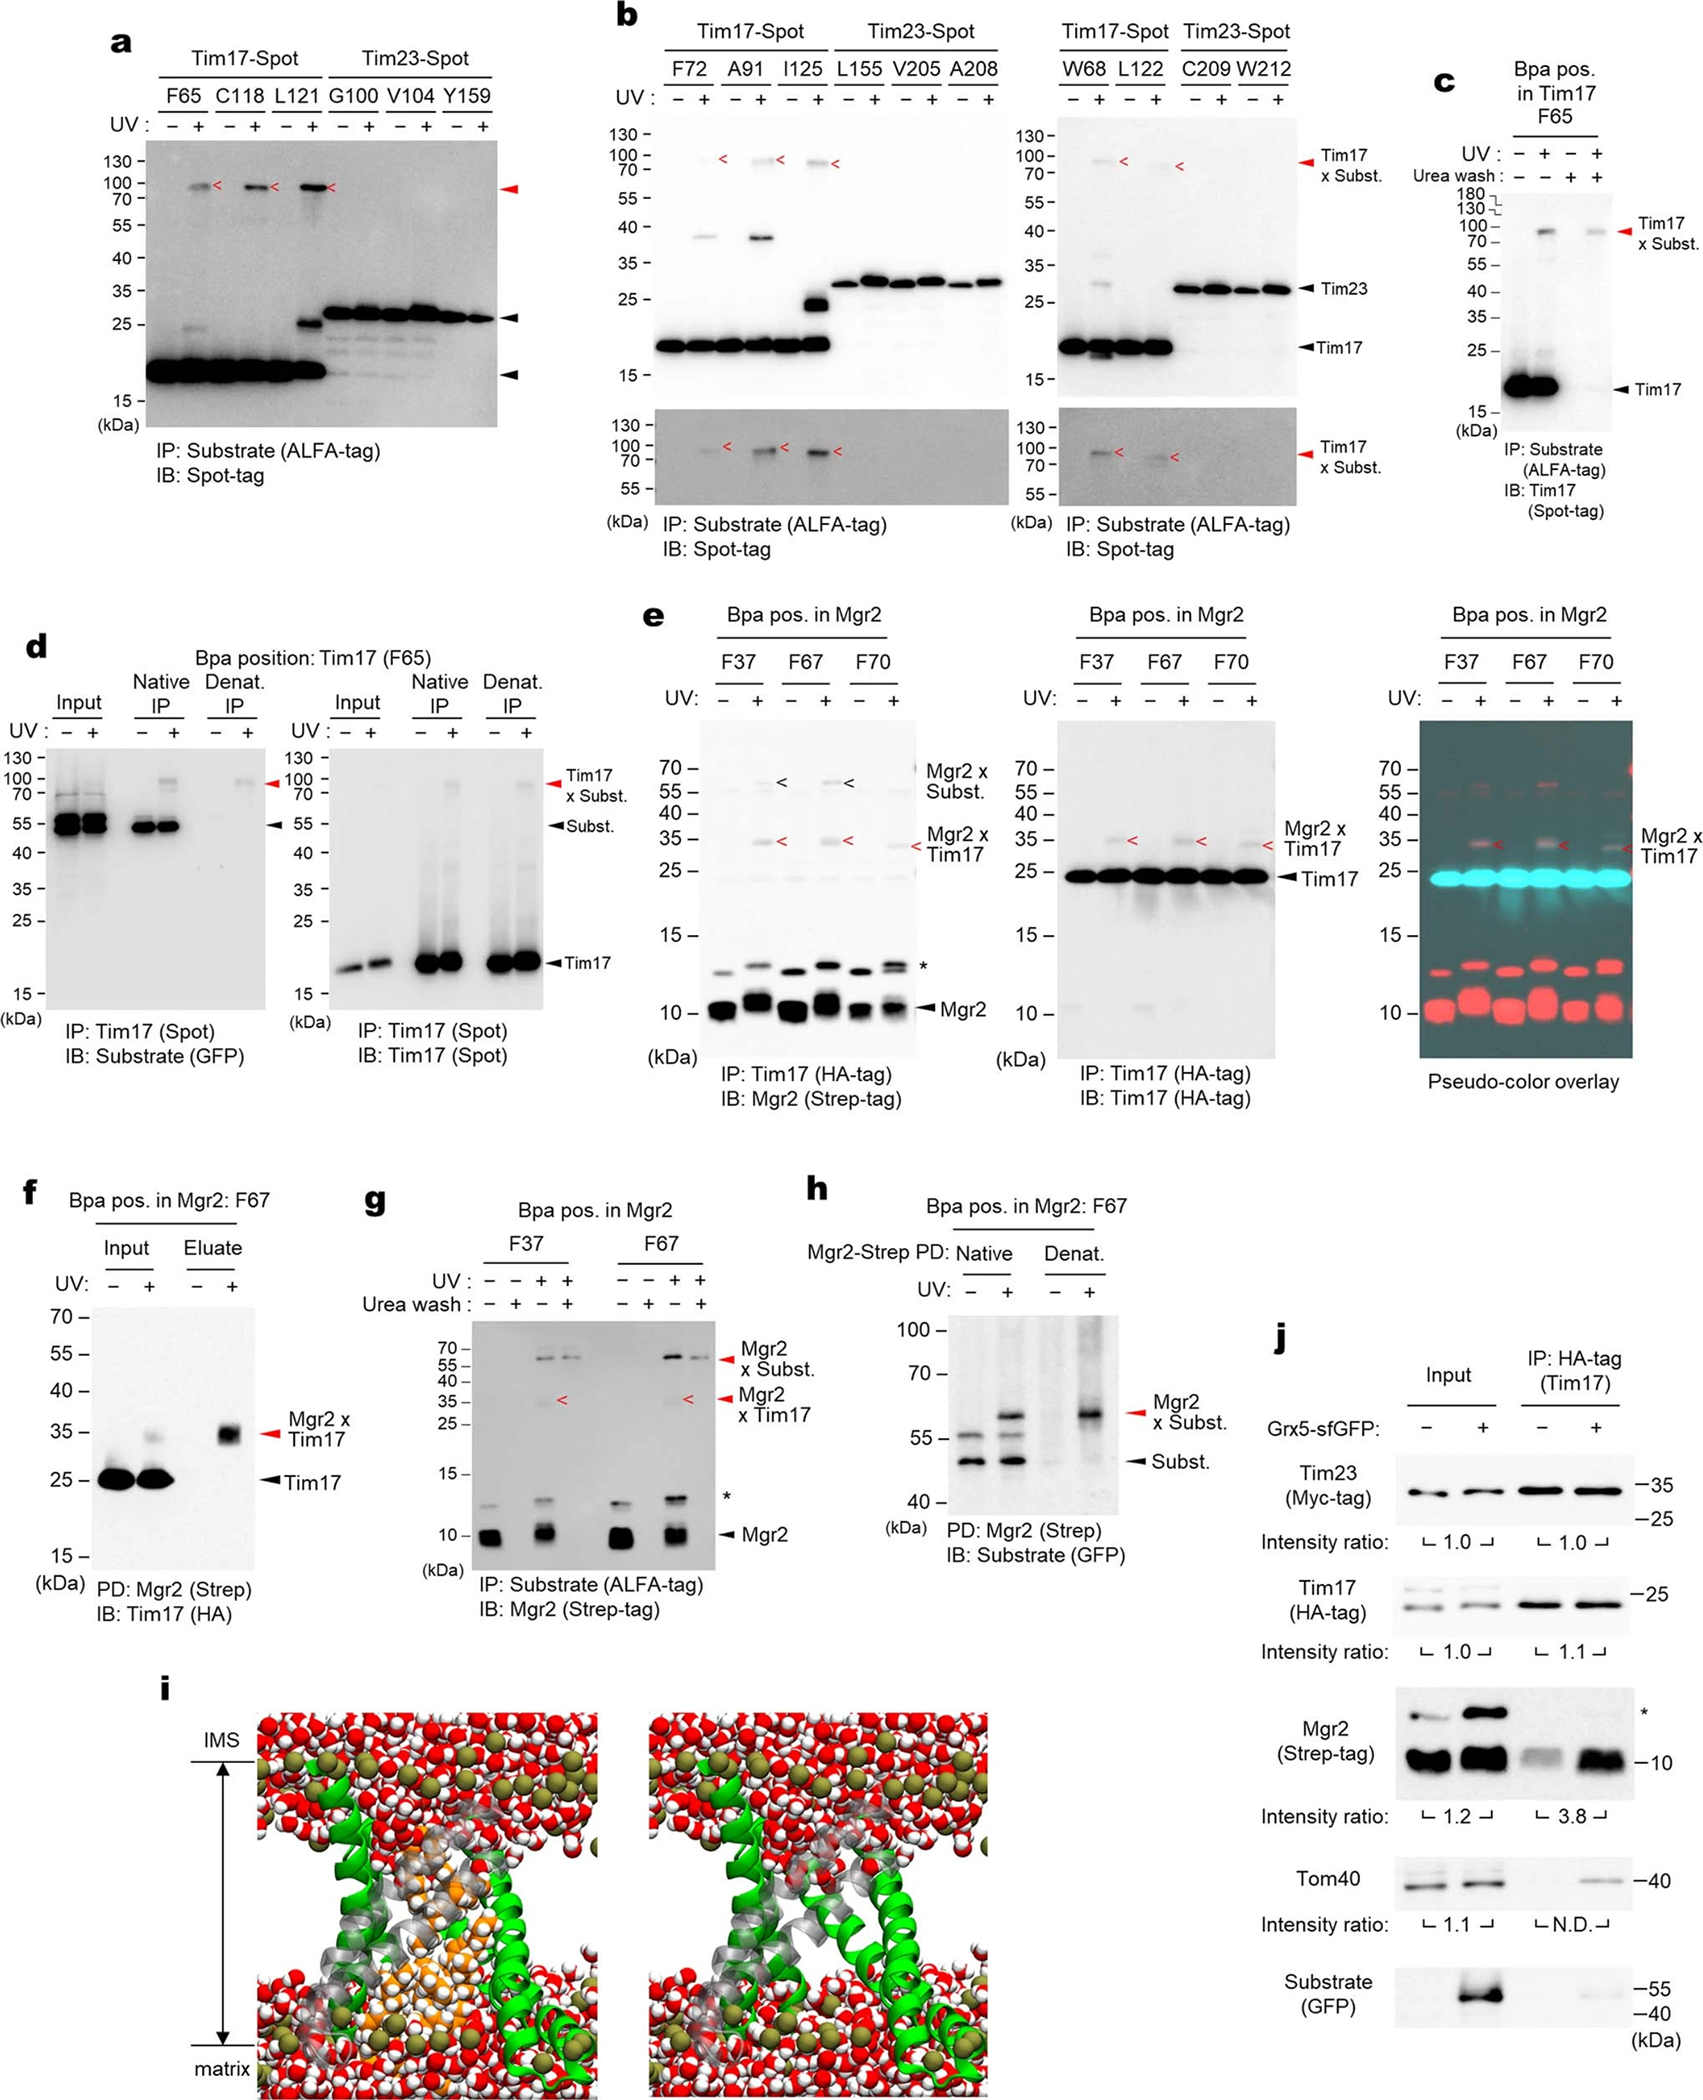
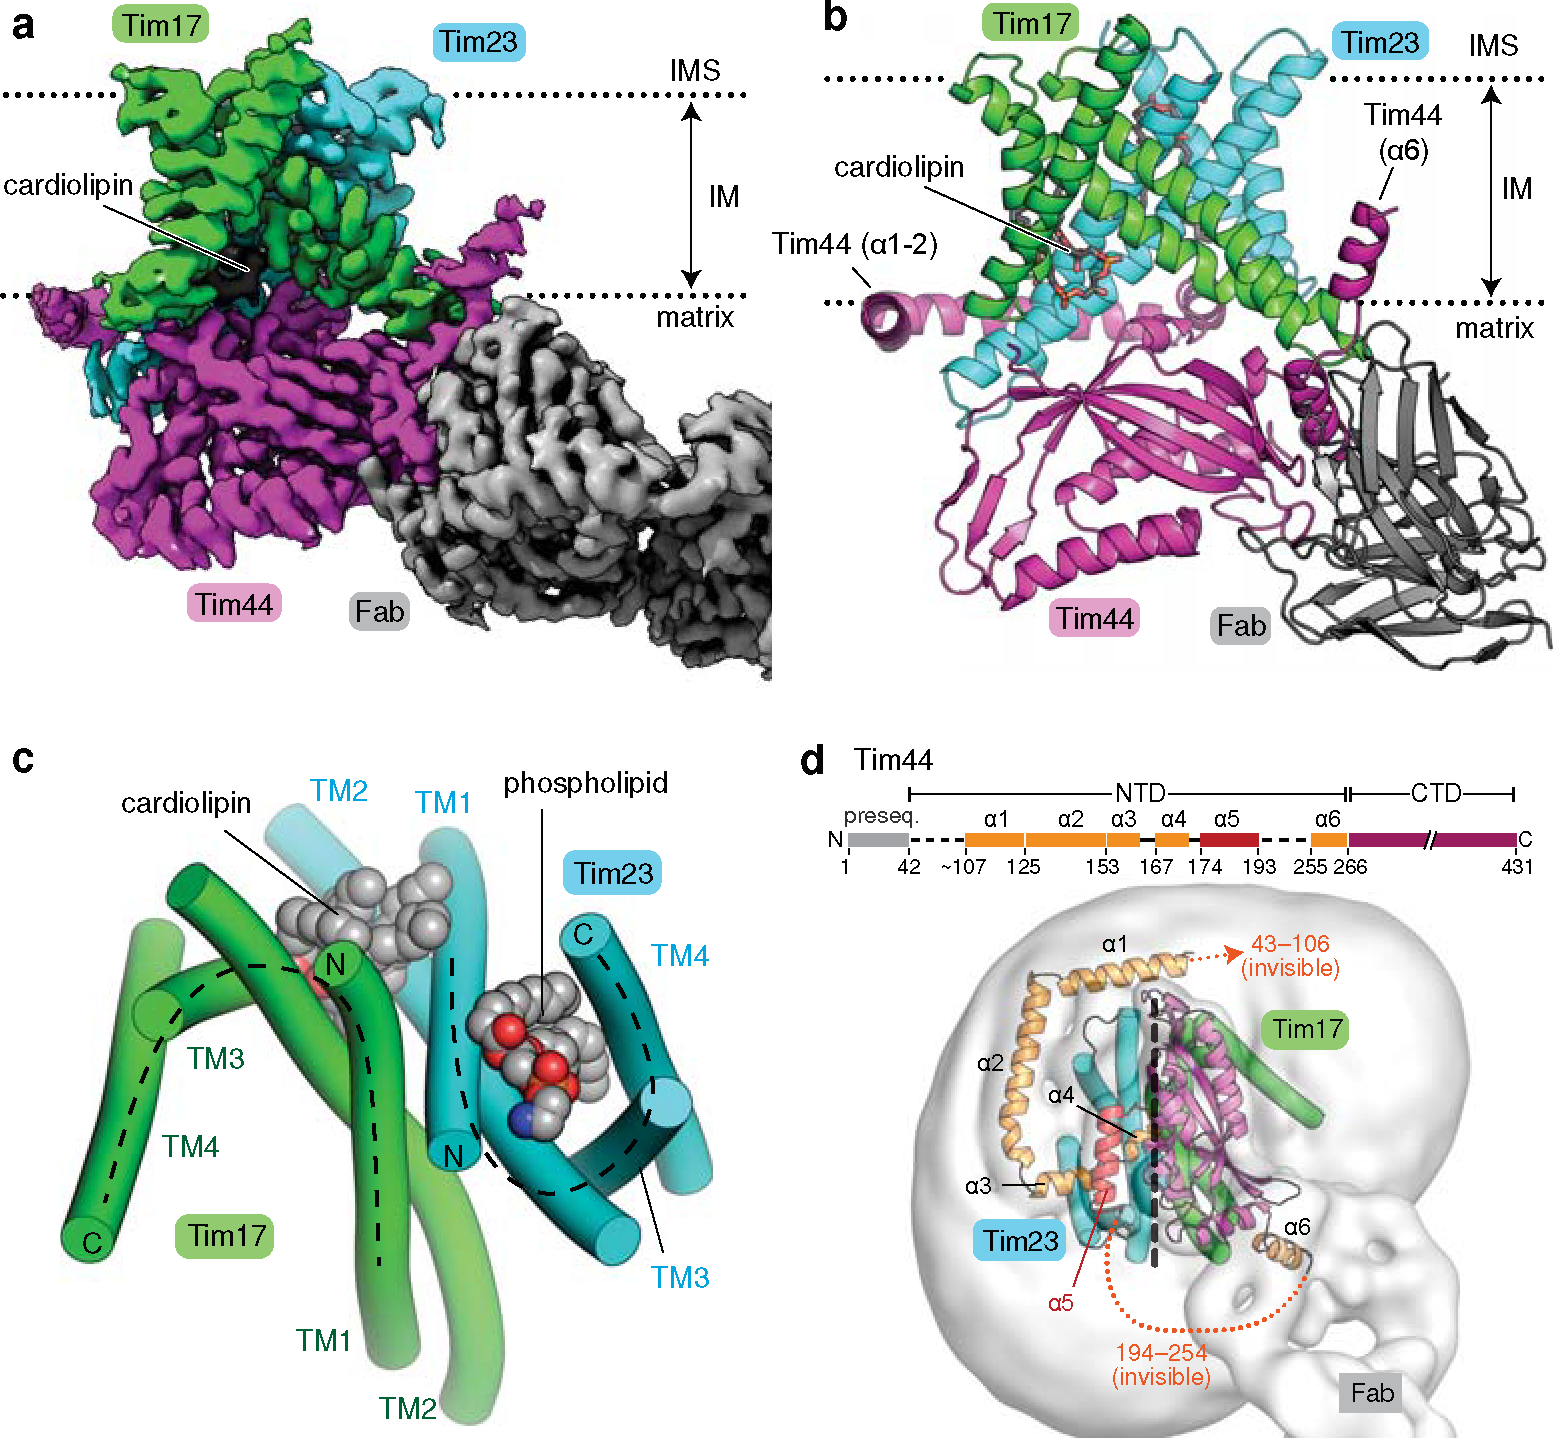
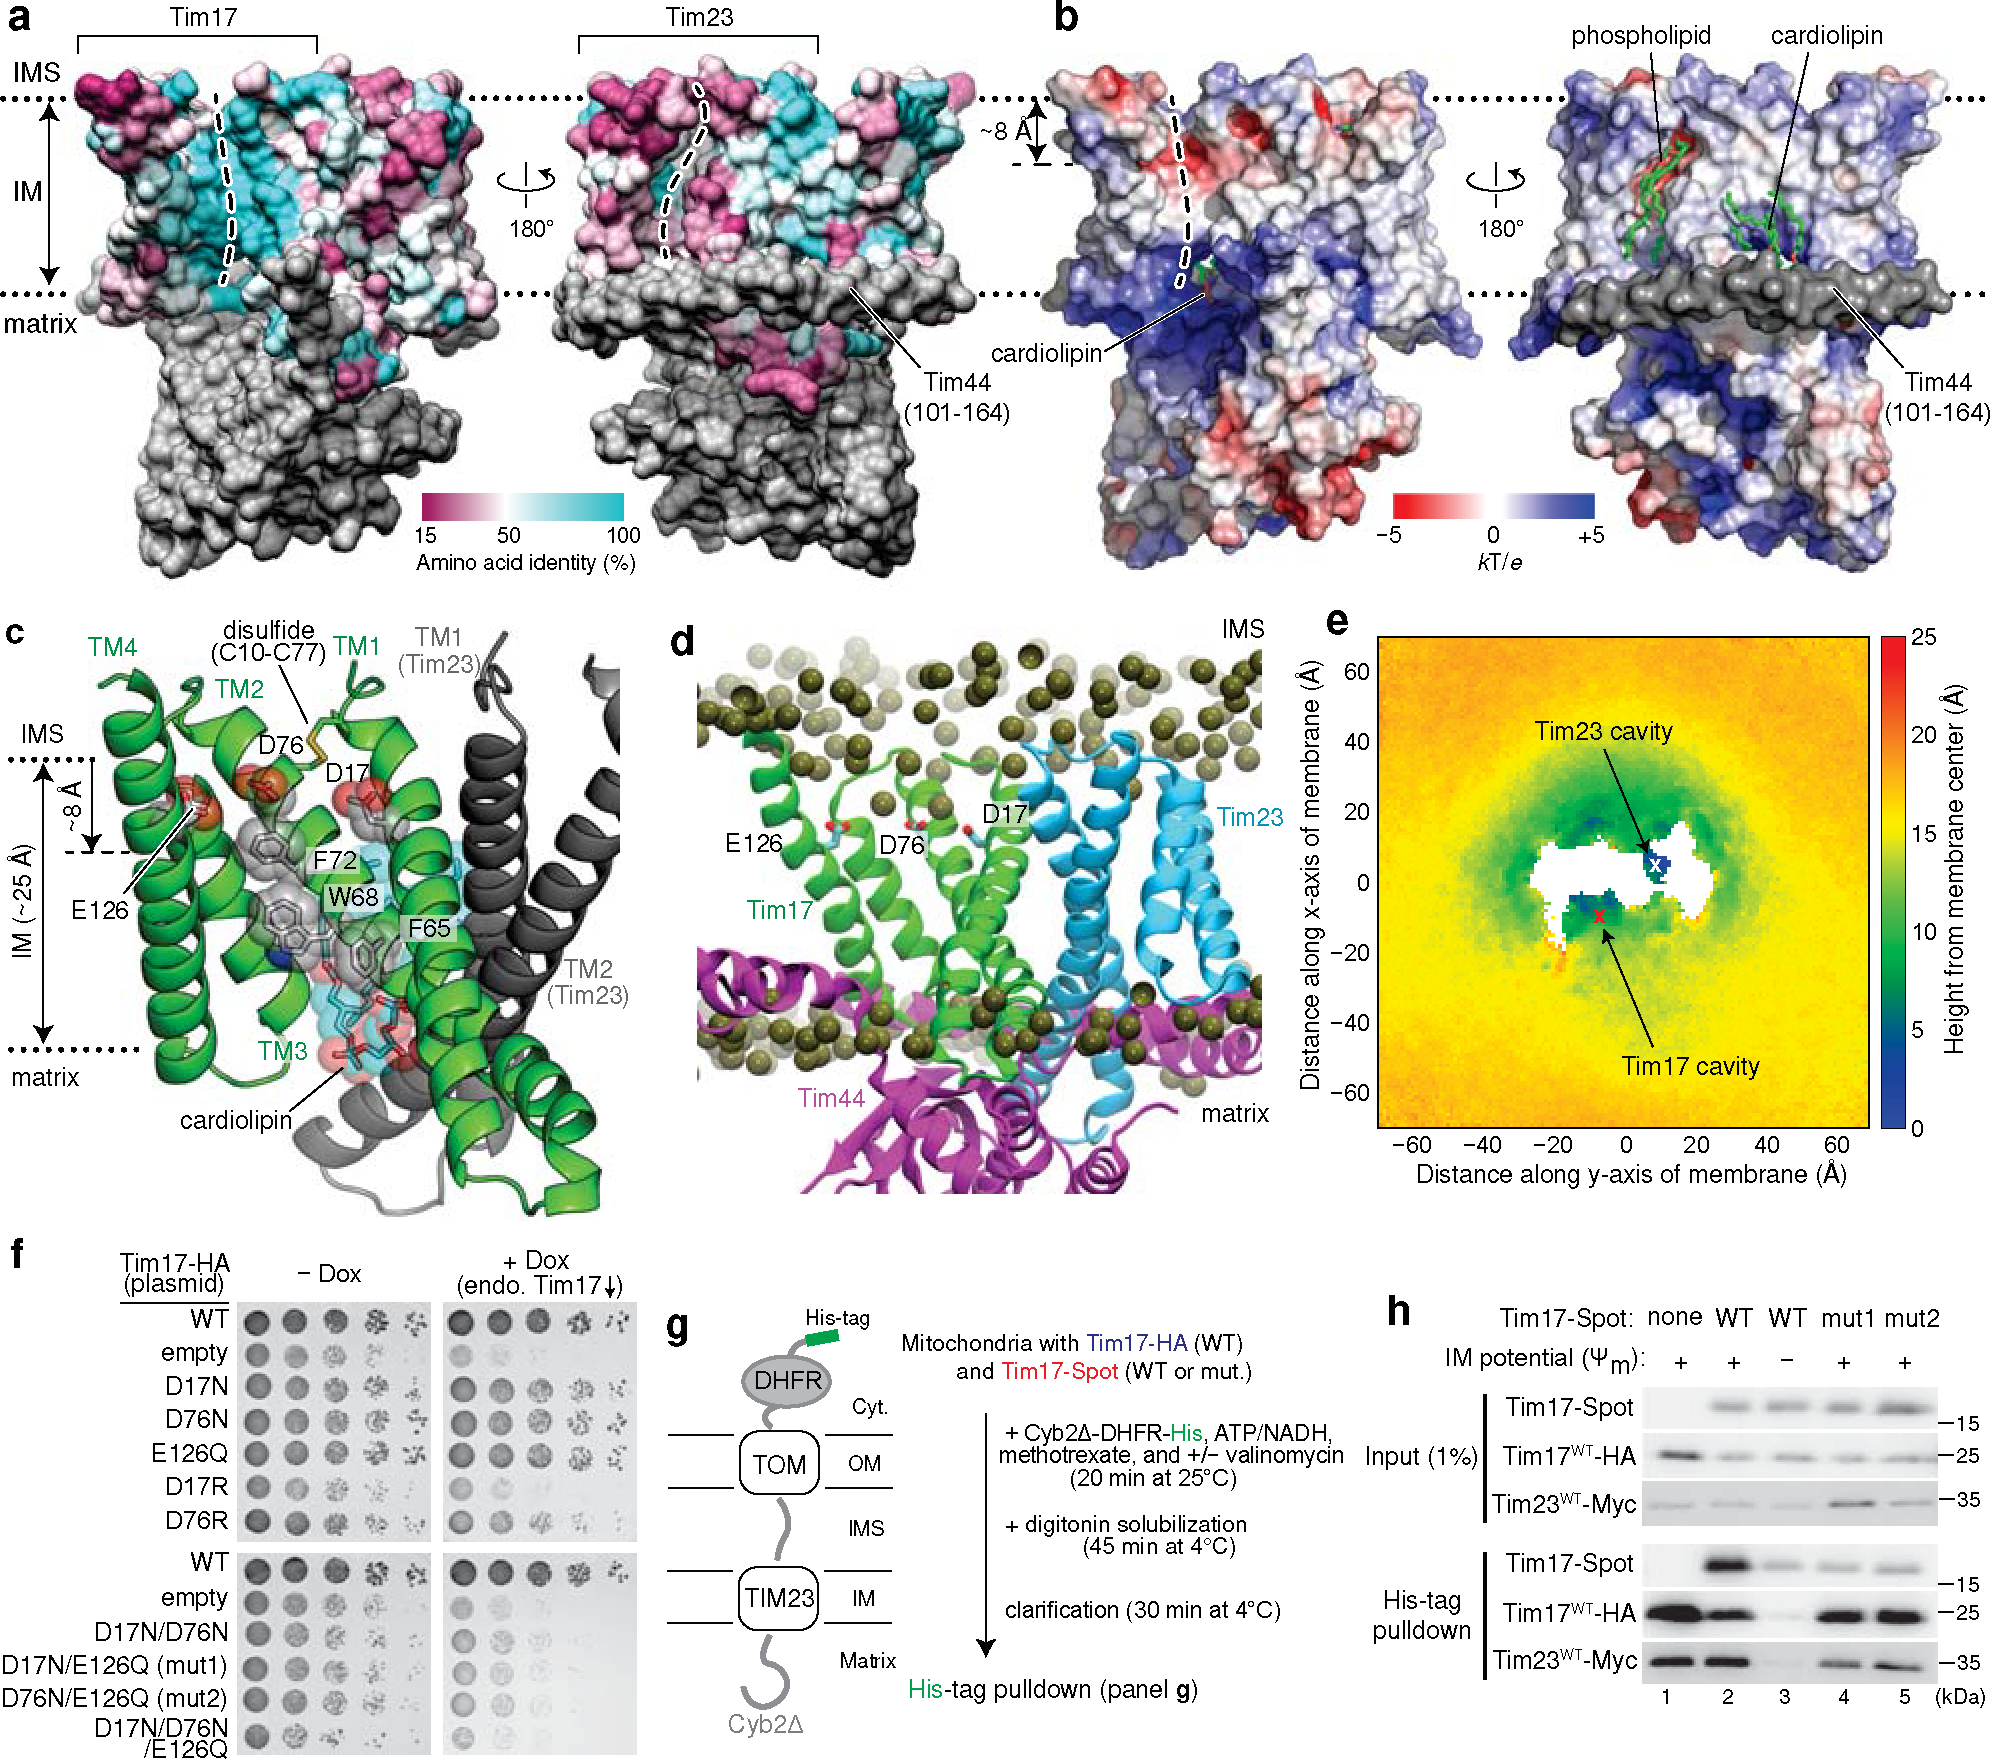
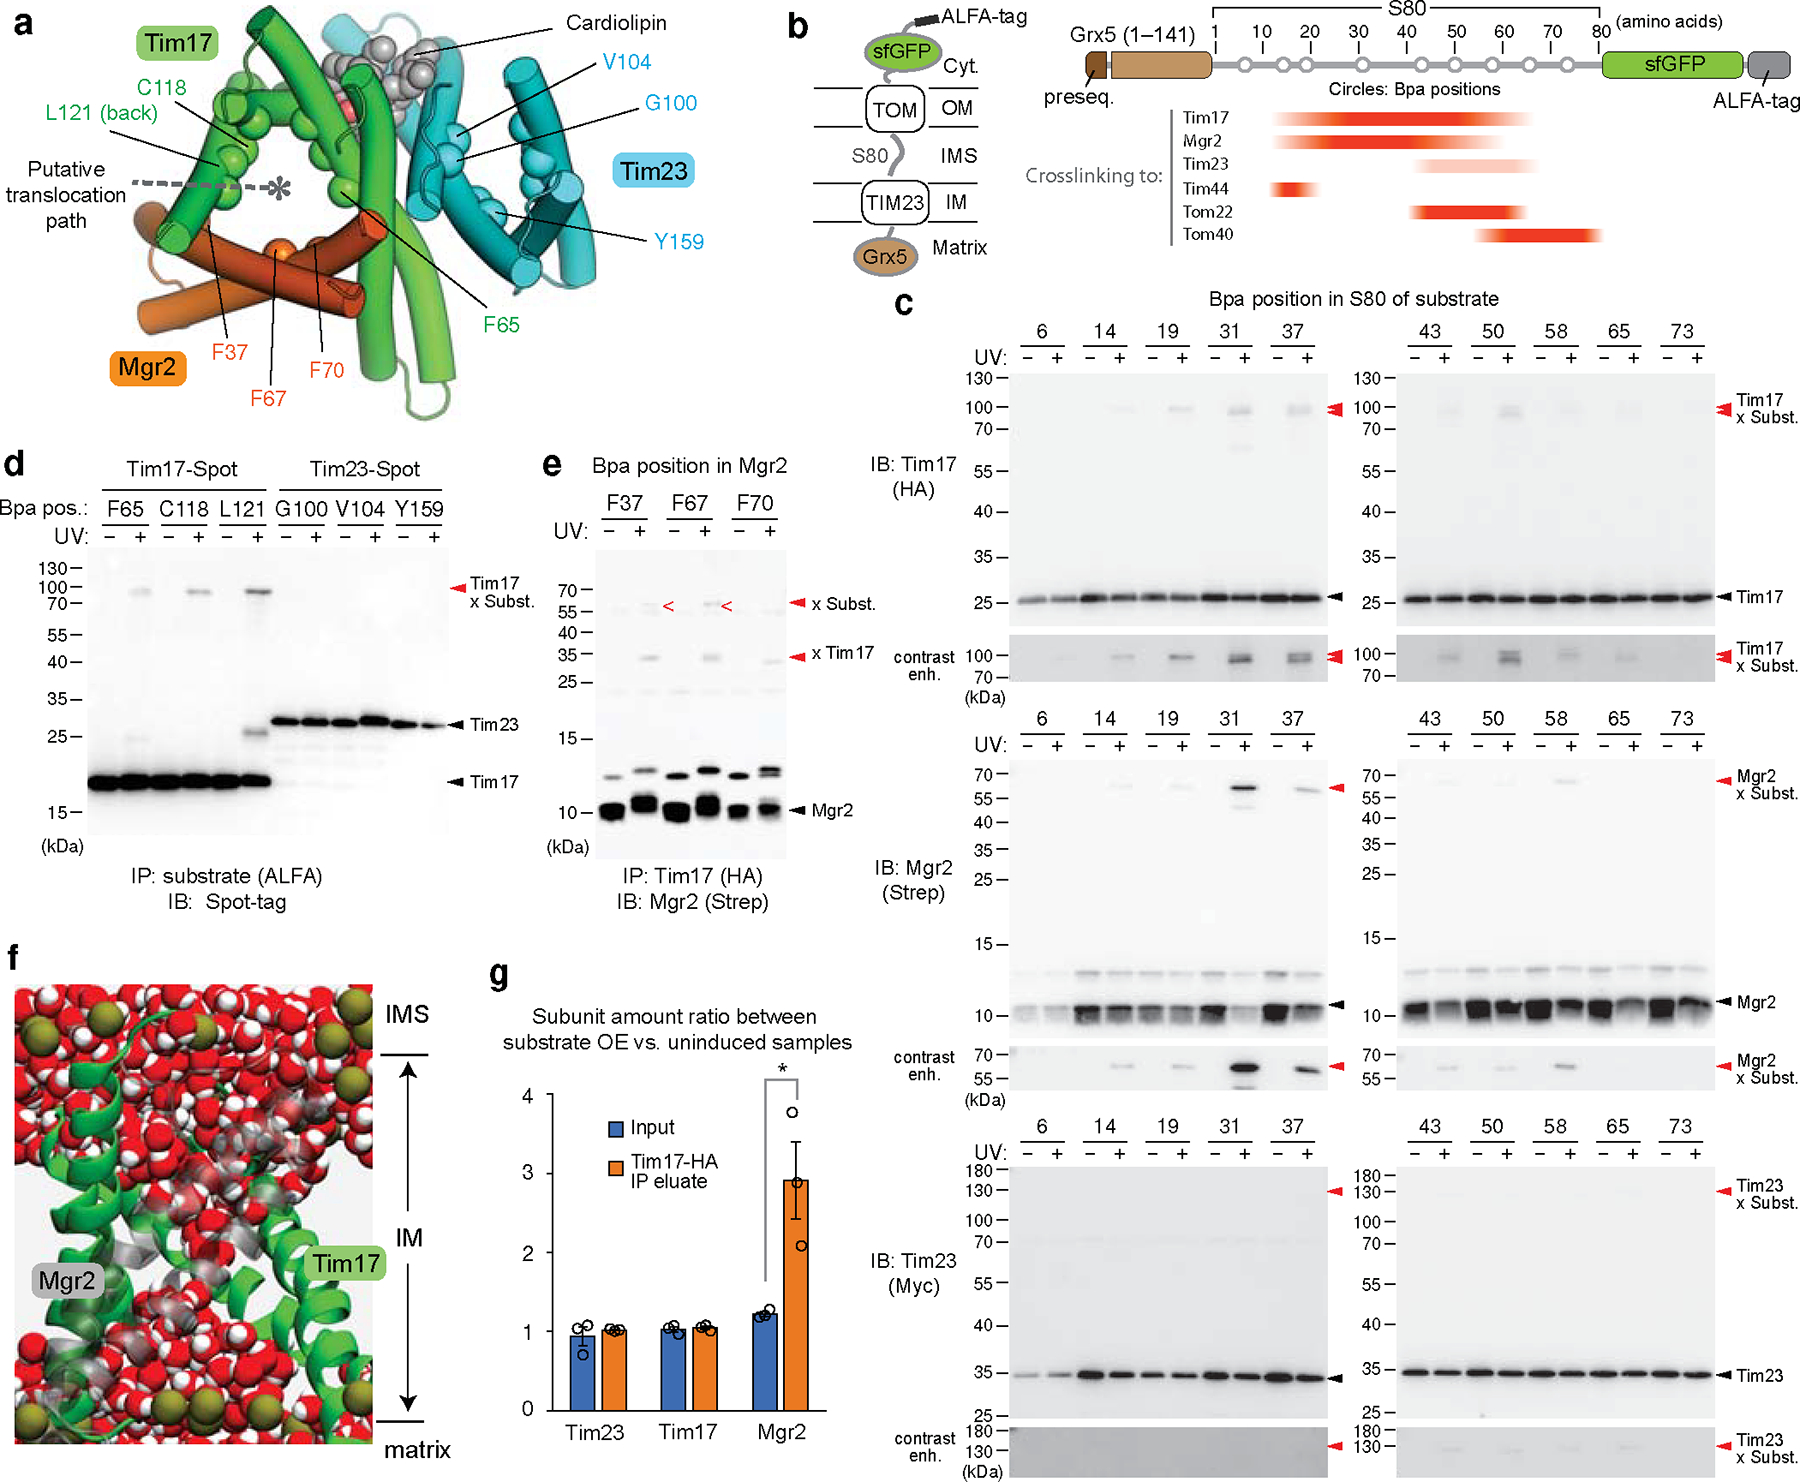
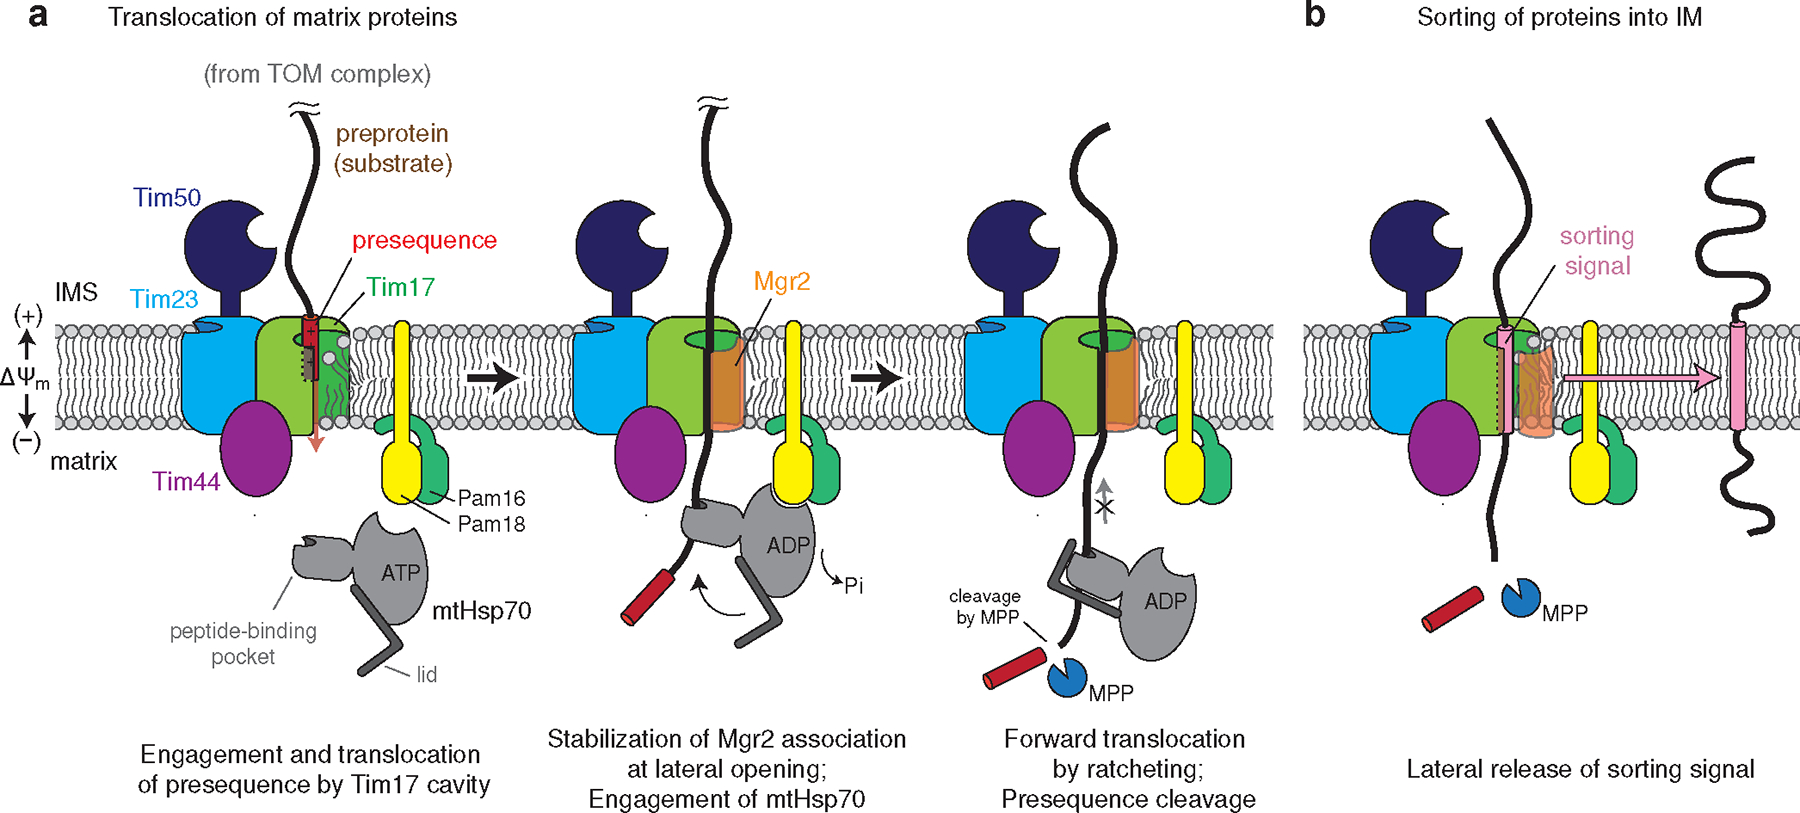
Mitochondria import nearly all of their approximately 1,000-2,000 constituent proteins from the cytosol across their double-membrane envelope1-5. Genetic and biochemical studies have shown that the conserved protein translocase, termed the TIM23 complex, mediates import of presequence-containing proteins (preproteins) into the mitochondrial matrix and inner membrane. Among about ten different subunits of the TIM23 complex, the essential multipass membrane protein Tim23, together with the evolutionarily related protein Tim17, has long been postulated to form a protein-conducting channel6-11. However, the mechanism by which these subunits form a translocation path in the membrane and enable the import process remains unclear due to a lack of structural information. Here we determined the cryo-electron microscopy structure of the core TIM23 complex (heterotrimeric Tim17-Tim23-Tim44) from Saccharomyces cerevisiae. Contrary to the prevailing model, Tim23 and Tim17 themselves do not form a water-filled channel, but instead have separate, lipid-exposed concave cavities that face in opposite directions. Our structural and biochemical analyses show that the cavity of Tim17, but not Tim23, forms the protein translocation path, whereas Tim23 probably has a structural role. The results further suggest that, during translocation of substrate polypeptides, the nonessential subunit Mgr2 seals the lateral opening of the Tim17 cavity to facilitate the translocation process. We propose a new model for the TIM23-mediated protein import and sorting mechanism, a central pathway in mitochondrial biogenesis.


Conflict of interest statement

Competing interests

Authors declare no competing interests.

Figures

Extended Data Fig. 1 |
Extended Data Fig. 1 |. Purification of the TIM23 complex from S. cerevisiae and initial cryo-EM analysis.
a, Schematic diagram of the membrane-associated components of the TIM23 complex. The two soluble matrix components mtHsp70 and Mge1 were not shown. The N-terminus of each subunit is indicated by an “N”. Note that Tim21, Pam17, and Mgr2 are not essential, and individual deletions of the portions of essential Pam16, Pam18, and Tim50 proteins outlined by a dashed line are viable,,. b, Purification of the endogenous TIM23 complex. After affinity purification via Spot-tagged Tim17, the sample was subjected to Superose-6 size-exclusion chromatography (SEC). The gray box indicates fractions further analyzed by non-reducing SDS-PAGE and Coomassie staining (right panel). We note that copurified Tim50 often did not fully co-migrate with the other subunits in SEC, indicating its dissociation over time. c, As in b, but purification of the TIM23 complex from mitochondria co-overexpressing the nine subunits shown in a, omitting mtHsp70 and Mge1. Fractions marked with asterisks are pooled and used for cryo-EM analysis shown in dh. d, Summary of single particle analysis of the sample shown in c. e, Example two-dimensional (2D) classes of the TIM23 complex. Putative matrix domains of Tim44-CTD and Pam16/18 are indicated by yellow and cyan arrowheads, respectively. f, Class 1 from ab-initio refinement of particles shown in d. g, As in f, but showing Class 2. h, As in the left panel of g, but shown at a lower isosurface threshold value. Data shown in b and c are representative of two experiments.
Extended Data Fig. 2 |
Extended Data Fig. 2 |. 2.7-Å-resolution cryo-EM structure of the TIM23 complex (Tim17/23/44 + Pam16/18).
a, Purification of the Fab-bound core TIM23 complex (Tim17/23/44 + Pam16/18). Left, Superose-6 SEC elution profile; right, Coomassie-stained non-reducing SDS gel of fractions indicated in the left panel by a gray box. Fractions marked with asterisks were pooled and used for cryo-EM analysis. b, Summary of single particle analysis of the Fab-bound TIM23 complex. ce, Particle view distribution (c), Fourier shell correlation (d), and local resolution distribution (e) for the Fab-bound TIM23 complex. f, Examples of segmented EM densities and atomic models. The amino acid ranges are indicated. The threshold values for the map range from 7.8 to 8.9σ. g, Phospholipid bound to the cavity of Tim23. The EM density of the phospholipid is shown as black mesh (at a map threshold value of 5.9σ). Side chains contacting the lipid head group are shown as sticks. We note that, although the identity of the phospholipid could not be unambiguously determined, the EM density agrees very well with phosphatidylethanolamine. h, As in Fig. 1b, but showing a zoomed-in view for the cardiolipin molecule. The EM density is shown in black mesh (at a map threshold value of 10.6σ). Polar interactions are indicated by dashed line. i, Superposition between Tim44 structures from the present cryo-EM study and a previous X-ray crystallography study (PDB: 2FXT). The root-mean-square deviation (RMSD) is 0.75 Å for Cα atoms. Data shown in a are representative of two experiments.
Extended Data Fig. 3 |
Extended Data Fig. 3 |. High-resolution cryo-EM structure of the endogenous core-TIM23 complex.
a, To increase Tim44 occupancy in the core TIM23 complex formed by endogenous Tim17 and Tim23, Tim44 was overexpressed under indicated constitutive promoters, and protein levels were analyzed in yeast whole cell lysates (Quants., relative band intensities of full-length Tim44). For the subsequent analyses, we chose the ALD6 promoter (pALD6). Asterisk indicates partial degradation product. b, ALD6-promoter-driven overexpression of Tim44 does not exhibit any cell growth defect. Because the non-essential subunit Tim21 may reduce the amount of the Tim44-containing TIM23 complex by forming a “TIM23-sort” complex,, we also tested a chromosomal deletion of tim21. c, Tim17 was immunoprecipitated from the mitochondrial lysate of the strains used in b and co-precipitated Tim44 was detected by immunoblotting (In, input; E, eluate). Note that a substantially increased amount of Tim44 was co-purified with Tim44 overexpression. d, Purification of the Fab-bound, endogenous core-TIM23 complex from the tim21Δ/pALD6-Tim44 strain. Left, Superose-6 SEC elution profile; right, Coomassie-stained SDS gel of fractions indicated in the left panel by a gray box. Fractions marked with asterisks were pooled and used for cryo-EM analysis. Note the substantially increased Tim44:Tim23 ratio compared to the purification shown in Extended Data Fig. 1b. e, Summary of single particle analysis of the endogenous core-TIM23 complex. fh, Particle view distribution (f), Fourier shell correlation (g), and local resolution distribution (h). i, Superposition of the endogenous core-TIM23 cryo-EM map (blue) onto the TIM23 map (yellow) from overexpression (OE) (Extended Data Fig. 2). The map correlation coefficient was 0.985 in UCSF Chimera. j, As in i, but showing superposition of the atomic models. The RMSD value is 0.26 Å for 739 out of 760 aligned Cα atoms. Data shown in ad are representative of two experiments.
Extended Data Fig. 4 |
Extended Data Fig. 4 |. Interactions among Tim17, Tim23, and Tim44.
a, Side view showing the positions of glycine in Tim17 (green Cα-trace) and Tim23 (cyan Cα-trace). Positions of all glycine residues are shown as spheres (Cα atoms) with residue numbers. Red spheres indicate positions in which mutation to a non-glycine amino acid would cause steric clashes. Gray spheres indicate positions in which mutation may not cause steric clashes. b and c, As in a, but viewing down the planes indicated by arrows in panel a from the IMS. d, Mapping of amino acid positions that have been shown to produce an inter-subunit photocrosslinking adduct with p-benzoyl-L-phenylalanine (Bpa). Tim17 (green), Tim23 (cyan), and Tim44 (magenta) are shown in a cylindrical cartoon representation. Green and cyan spheres are positions in Tim44 that crosslink to Tim17 and Tim23, respectively. Magenta spheres are positions in Tim17 and Tim23 that crosslink to Tim44. See panel e for details. e, Summary of previously reported inter-subunit photocrosslinking results. The minimal distance is between the position (Cα for Tim17-G106 and Cβ atom for all other positions) into which Bpa was incorporated and the crosslinked subunit (atom is specified).
Extended Data Fig. 5 |
Extended Data Fig. 5 |. Structural comparisons between Tim17, Tim23, and Tim22, and membrane thinning by the cavity of Tim17.
a, Comparison between the transmembrane domains of Tim17 and Tim23. TM1 to TM4 of Tim23 are shown in rainbow color (blue to red). Arrows highlight a difference between the TM4 positions. b, As in a, but comparing between Tim17 and Tim22 (PDB ID: 6LO8). Note that Tim22 has an extra IMS helix to its N-terminus. c, Side view showing the cavity of Tim23 (gray surface). Amino acid residues 153–174 of Tim44 are shown in pink. Note that residues D164, D165, and E167 interact with basic amino acids (R144, K190, and K193; blue) of Tim23. d, As in Fig. 2 a and b, but showing amino acid conservation and surface electrostatics of Tim22 (PDB 6LO8) with a side view into the concave cavity (indicated by a dashed line). e, MD simulated model showing distributions of lipids, ions, and water in the Tim17 cavity. Surfaces are rendered with Tim17 (green) and Tim23 (cyan), while Tim44 is represented with magenta transparent ribbons. Phosphorous atoms of lipids are rendered as dark gold spheres and potassium ions are rendered as orange spheres. In the right panel, extensive hydration (water is rendered in red/white spheres) was observed in the Tim17 cavity. The membrane thinning in the Tim17 cavity is approximately 8.5 Å (also see fi). f, As in Fig. 2e, but showing two replicas of simulation with an asymmetric lipid composition and a membrane potential of −150 mV. Upper and lower panels show membrane heights from the membrane center toward the IMS and the matrix, respectively. Replica 2 is the result shown in Fig. 2e. g, As in f, but without membrane potential. h, As in f, but with a symmetric membrane composition. i, Summary of membrane thinning, calculated as the averaged difference of the height of the IMS and matrix leaflets in a 10-Å by 10-Å patch in the vicinity of the Tim17 cavity relative to the average thickness of the lipid bilayer (four patches taken remote from the protein complex in the four corners of the maps). Note that membrane thinning occurs independent of membrane potential or asymmetry of the lipid composition.
Extended Data Fig. 6 |
Extended Data Fig. 6 |. Mutational analysis on the cavities of Tim17 and Tim23.
a, As in Fig. 2f, but testing mutations on aromatic residues lining the Tim17 cavity (Phe65, Phe72, and Trp68) of Tim17. b and c, Expression levels of WT and indicated mutants were measured by immunoblotting. All Tim17 variants were expressed under the endogenous promoter from a CEN/ARS plasmid. 3-phosphoglycerate kinase (Pgk1) was used as a loading control. d, As in Fig. 2f, but the experiments were performed with a 2μ plasmid expressing indicated mutants of HA-tagged Tim17 under a cyanamide-inducible DDI2 promoter. Cells were spotted on synthetic complete without leucine (SC[–Leu]) plates supplemented with varying concentrations of cyanamide. The plates contain doxycycline (Dox), where indicated. eg, As in b and c, but measuring expression levels of Tim17 under the DDI2 promoter in the presence of varying concentrations of cyanamide. As a control, expression of WT Tim17 under the endogenous promoter (endo) from a CEN/ARS plasmid was included. h, Co-immunoprecipitation of the essential subunits of the TIM23 complex with Tim17 mutants. Mitochondria expressing indicated Tim17 variants (WT, D17N/E126Q [mut1] and D76N/E126Q [mut2]) were solubilized with digitonin, and Tim17 was pulled down with anti-Spot-tag nanobody beads. The samples were analyzed by immunoblotting with indicated antibodies. i, WT mitochondria (50 μg protein) were incubated with 1 μg of purified Cyb2Δ-DHFR-His in a 100-μL reaction volume. Where indicated, ATP/NADH (2 mM each) and/or methotrexate (MTX; 2 μM) were included. After 20-min incubation at 25°C, mitochondria were washed and resuspended in a hypo-osmotic buffer solution. After splitting the reactions, mitoplasts were treated with proteinase K (+PK) where indicated. The samples were quenched with phenylmethylsulfonyl fluoride and analyzed by SDS-PAGE and immunoblotting (IB) with anti-His-tag antibody. p, precursor form of Cyb2Δ-DHFR-His; m, mature (presequence-cleaved) form of Cyb2Δ-DHFR-His. j, Additional controls including a reaction in the presence of 2 μM valinomycin (−Ψm). Note that indicated amounts of Cyb2Δ-DHFR-His were added to 100-uL reactions and that all reactions contained MTX. k, As in Fig. 2h, but import reactions were subjected to blue native-PAGE (BN-PAGE). l, As in Fig. 2c, but view into the Tim23 cavity. The view is similar to the right panels of Fig. 2 a and b. m, As in Fig. 2f, but testing mutations of acidic, polar, and aromatic amino acids lining the Tim23 cavity. Data in aj and m are representative of three independent experiments. Data in k is representative of two independent experiments.
Extended Data Fig. 7 |
Extended Data Fig. 7 |. Comparisons between the cryo-EM structure and AlphaFold2 predictions of the yeast TIM23 complex.
a, Superposition between the cryo-EM structure (gray) and AlphaFold2 model of Tim17–Tim23–Tim44 (in color). For the predicted structure, Tim17, Tim23, and Tim44 are in green, cyan, and magenta, respectively, and low confidence regions (pLDDT<70) are colored in lighter tones. The RMSD is 1.0 Å for 338 Cα atoms out of 480 aligned residues. Predictions were made using AlphaFold2 Multimer version 2.2.0. b, As in a, but the AlphaFold2 model additionally contains Mgr2 (orange). c, As in b, but showing per-residue confidence score of the AlphaFold2-generated Tim17–Mgr2–Tim23–Tim44 model. d, Predicted aligned error (PAE) matrix between all pairs of residues of the Tim17–Mgr2–Tim23–Tim44 AlphaFold2 model.
Extended Data Fig. 8 |
Extended Data Fig. 8 |. Generation of stalled translocation intermediate complexes of TIM23–TOM–substrate and probing the preprotein translocation path by UV photocrosslinking.
a, Formation of a supercomplex containing TIM23, TOM, and the Grx5-S80-sfGFP substrate (S80 is a hydrophilic segment derived from yeast Cyb2) was confirmed by BN-PAGE. Where indicated, expression of Grx5-S80-sfGFP (C-terminally ALFA-tagged) was induced. After solubilizing mitochondria with digitonin, ALFA-tag immunoprecipitation (IP) was performed, and eluates were subjected to BN-PAGE and analyzed by immunoblotting (IB). Where indicated, eluate was treated with additional dodecylmaltoside (DDM) to dissociate the TIM23 complex. We note that while a substantial population of Grx5-S80-sfGFP stalls in TOM and TIM23, a major population is fully imported into the matrix without stalling. Faster migration of the TOM-substrate band in the presence of DDM is likely due to changes in micelle properties or partial dissociation of Tom subunits. b, Testing tagging of Mgr2. To enable detection of Mgr2 in immunoblots, an N-terminal Strep-tag was added to Mgr2. Temperature sensitivity, of an Mgr2-deleted strain (mgr2Δ) and strains additionally expressing Strep-Mgr2 was tested (all in a W303–1A background). Where indicated, cells were transformed with a plasmid encoding non-tagged Mgr2 under a native MGR2 promoter, or N-terminally Strep-tagged Mgr2 under the MGR2 promoter or an ALD6 promoter. Note that lesser growth rescue by MGR2 promoter-driven Strep-Mgr2 might be due to a reduced expression level by insertion of the Strep-tag at the N-terminus or partial impairment of the function of Mgr2. The partial rescue could be overcome by stronger expression of Strep-Mgr2 under the ALD6 promoter. All subsequent experiments were performed with the Strep-Mgr2 (pALD6) strain. c, As in b, but yeast whole cell lysates (from equal OD600) were analyzed by immunoblotting to test expression of Strep-Mgr2. Asterisk, a putative precursor form of Mgr2 (ref. ). d, Co-immunoprecipitation of TIM23-TOM-substrate supercomplexes with and without Mgr2. The upper panel depicts two different stalling substrates used. Grx5-S99(TM)-sfGFP contains a 99-amino-acid-long segment with a TM helix between 36 and 51 amino acid residues (derived from Cyb2). Upon stalling, this TM is expected to be released to the IM. In lower panels, cells were induced for expression of the indicated substrate, and the mitochondrial lysates were subjected to ALFA-tag IP. Where indicated, the strain lacked endogenous Mgr2 (Δ) and/or expressed exogeneous Strep-tagged Mgr2. Asterisk, putative precursor of Mgr2. We note that Grx5-S80-sfGFP reproducibly showed reduced copurification of Tom40 in the absence of Mgr2. Although the cause of this decrease is unclear, it is unlikely due to impaired presequence engagement of Mgr2-lacking TIM23 since we did not observe a similar decrease with Grx5-S99(TM)-sfGFP. e. Photocrosslinking with Bpa-incorporated Grx5-S80-sfGFP. As in Fig. 3c, but showing the immunoblots for Tim44, Tom22, Tom40, and the substrate. f, Verification of a covalent linkage formed between Grx5-S80-sfGFP and the indicated TIM23 subunit upon photocrosslinking. Beads were split to two halves after a regular wash step of IP, and one of them was additionally washed twice with 6 M urea to remove proteins that are noncovalently associated to the substrate (note that ALFA-tagged protein retains to ALFA-nanobody beads in this denaturing condition). Asterisk, putative partial degradation products. g, The crosslinked band (red arrowhead) between Grx5-S80-sfGFP (Bpa in position 31 of S80) and Tim17 was verified with successive IPs using the ALFA-tag and HA-tag. After the first ALFA-tag IP, proteins were denatured by SDS. Black arrowhead, the uncrosslinked substrate; asterisk, a putative partial degradation product of the crosslinked species. h and i, The crosslinked band (red arrowheads) between Grx5-S80-sfGFP and Mgr2 (h) or Tim44 (i) was verified by SDS-denatured pulldown (for Strep-Mgr2) or IP (for Tim44). Bpa sites are located in indicated positions of S80. Black arrowhead, the uncrosslinked substrate; hash, putative cross-reacted IgG. Data in ad and fi are representative of two independent experiments. Data in e is representative of three independent experiments.
Extended Data Fig. 9 |
Extended Data Fig. 9 |. Photocrosslinking experiments with Bpa-incorporated Tim17, Tim23, or Mgr2 and characterization of Mgr2 association to translocating Tim17.
a, The blot image of Fig. 3d is adjusted for higher contrast. IP, immunoprecipitation; IB, immunoblotting. b, As in Fig. 3d, but additional positions were tested for Bpa crosslinking. “<” denotes observed crosslinking adducts with the Grx5-S80-sfGFP substrate. c, As in Extended Data Fig. 8f, but verifying the crosslinked band (red arrowheads) between Bpa-incorporated Tim17 and Grx5-S80-sfGFP. d, As in c, but the crosslinked band (red arrowheads) were validated with native and SDS-denaturing IP with Spot-tag nanobody beads. e, Validation for crosslinks between Mgr2 and Tim17. Left, the same image shown in Fig. 3e (IB for Strep-Mgr2); middle, IB for Tim17; right, Overlaid images with pseudo-coloring to show superposition of the crosslinked Mgr2-Tim17 bands between the two blots. fh, Additional validations for crosslinking between Mgr2 and Tim17 (f) and between Mgr2 and the Grx5-S80-sfGFP substrate (g and h). Panels f and h show results of SDS-denaturing pulldown (PD) with Strep-Tactin resin. Panel g shows a result of ALFA-tag IP in combination with urea wash as in Extended Data Fig. 8f. i, Water does not cross the membrane when lipids are present in the Tim17–Mgr2 cavity (compare with Fig. 3f). MD simulations with lipids initially placed in the Tim17–Mgr2 cavity block water entry. Image taken after 0.8 μs with Tim17 rendered in green ribbons and Mgr2 in semi-transparent gray ribbons, with water (red/white spheres), phosphorous atoms (dark gold spheres), lipid molecules in the Tim17–Mgr2 cavity (orange/white spheres) rendered as van der Waals spheres. The right panel is the same as the left panel but without displaying the lipids. j, Cells induced for Grx5-S80-sfGFP expression and uninduced cells were lysed, and digitonin-solubilized mitochondrial lysates were subjected to HA-tag (Tim17) IP. Eluates were analyzed by immunoblotting. Band intensity ratios between samples with and without Grx5-S80-sfGFP expression were measured by densitometry. N.D., not determined. Data in ab and j are representative of three independent experiments. Data in ch are representative of two independent experiments.
Figure 1.
Figure 1.. Cryo-EM structure of the core TIM23 complex from S. cerevisiae.
a, Cryo-EM reconstruction of Fab-bound core TIM23 complex. b, As in a, but showing the atomic model. We note that the amphipathic helix α6 of Tim44 is tilted upwards because it sits on a curved micelle edge (see d). c, Arrangement of the TMs of Tim17 and Tim23 in a view from the IMS. TMs are represented as cylinders (arranged in the N to C order), and lipids are shown as spheres. The topology of the cavities is highlighted with dashed lines. d, Organization of Tim44 domains. Upper panel, linear diagram; lower panel, view from the matrix. The detergent micelle is shown with a lowpass-filtered cryo-EM map (gray semitransparent surface). Tim44 is shown as a ribbon diagram (orange, amphipathic helices; red, α5; purple, CTD). Dashed line, plane of the Tim17-Tim23 interface.
Figure 2.
Figure 2.. The cavity of Tim17 forms the path for protein translocation.
a, Mapping of amino acid sequence conservation of Tim17 and Tim23 onto the structure. Left, view into the Tim17 cavity; right, view into the Tim23 cavity. Dashed line, path along the cavity. b, Surface electrostatics of the TIM23 complex. The views are equivalent to those in a. α1–3 (residues ~107–164) of Tim44 (modelled as polyalanine) were not included in the calculation. c, Conserved acidic and aromatic amino acids lining the Tim17 cavity. Note that Tim17 contains a disulfide bond between Cys10 and Cys77, as shown previously. d and e, All-atom MD simulation of Tim17–Tim23–Tim44 in a model mitochondrial membrane. In d, positions of lipid headgroup phosphorous atoms are shown as spheres. Panel e shows time-averaged thickness of the lipid hydrophobic layer from the membrane center to the IMS along the membrane plane measured by positions of lipid glycerol atoms (a view from the IMS; also see Extended Data Fig. 5 e–i). We note that a low value at the Tim23 cavity is due to the coordinated phosphatidylethanolamine (Fig. 1c). f, Indicated acidic amino acids lining the Tim17 cavity were mutated, and their functionality was tested by a cell growth assay. The addition of doxycycline (Dox) represses expression of chromosomal WT Tim17. Note that slower growth with the ‘empty/−Dox’ condition is likely due to hypomorphic expression of chromosomal TIM17 under a tetracycline promoter. g, Schematic for pulldown experiments of stalled Cyb2Δ-DHFR. h, Cyb2Δ-DHFR was pulled down with nickel resin after forming a stalled translocation intermediate, and samples were analyzed by immunoblotting. In lane 3, ΔΨm was dissipated by addition of valinomycin. Data in f and h are representative of three independent experiments.
Figure 3.
Figure 3.. Preproteins are transported through the Tim17 cavity that is further sealed by Mgr2.
a, Hybrid model (view from IMS) containing the cryo-EM structure of the core TIM23 complex and the structure of Mgr2 predicted by AlphaFold2. For clarity, Tim44 is not shown. Spheres indicate the positions of amino acids that were replaced by Bpa for photocrosslinking (see d and e). Note that L121 is located behind the α-helix and not directly visible in this cartoon. b, Schematic for the stalling substrate Grx5-S80-sfGFP used for Bpa photocrosslinking and summary of results (see c and Extended Data Fig. 8e). c, Bpa was introduced to the indicated position in the S80 region of Grx5-S80-sfGFP. Crosslink adducts were analyzed by ALFA-tag immunoprecipitation (IP) of digitonin-solubilized lysates, followed by immunoblotting (IB) for indicated subunits of TIM23 (for crosslinking to Tim44, Tom22, and Tom40, see Extended Data Fig. 8e). Lower panels show contrast enhanced (contrast enh.) images of crosslinked bands. d, Similar to c, but Bpa was introduced to indicated positions in the Tim17 and Tim23 cavities. Photocrosslinking was performed with overexpression of Grx5-S80-sfGFP (subst.). Also see Extended Data Fig. 9a,b. e, Similar to d, but Bpa was introduced to Mgr2. Subst., Grx5-S80-sfGFP. f, MD simulations predict permeation of water (red/white spheres) across the cavity formed by Tim17 (green) and Mgr2 (semi-transparent gray) if not occupied by a polypeptide or lipids. For clarity, Tim23, Tim44 and lipids are not shown. Dark gold spheres, phosphorous atoms of lipids. g, Amounts of indicated subunits in the Tim17-HA IP experiments were quantified and ratios between samples overexpressing (OE) Grx5-S80-sfGFP and uninduced samples were plotted. Data are presented as mean values +/− SEM (n=3 independent experiments). Asterisk, p-value=0.03 (one-way ANOVA). Also see Extended Data Fig. 9j. Data in c, d, and e are representative of two (e) or three (c and d) independent experiments.
Figure 4.
Figure 4.. Model for the polypeptide transport mechanism of the TIM23 complex.
a, The N-terminal presequence first inserts into the cavity of Tim17. This step may be facilitated by Tim50, which may recruit the presequence to the TIM23 complex, and the negatively charged surface of the Tim17 cavity. Initial translocation of the presequence is likely powered by membrane potential (ΔΨm) across the inner membrane,. During translocation, the nonessential subunit Mgr2 stably associates with Tim17, sealing the lateral opening, and the preprotein is grasped by mtHsp70 as it emerges into the matrix. The J-domain of Pam18 activates ATP hydrolysis, leading to tight binding of mtHsp70 onto the polypeptide. The tight association of mtHsp70 will promote forward translocation of the polypeptide into the matrix while preventing backsliding. The presequence will be cleaved by the mitochondrial processing peptidase (MPP; not shown). For clarity, the tethers between the core TIM23 complex and Pam16–Pam18 and between Tim44 and mtHsp70 (ref. ) are not shown. b, In the case of preproteins containing a TM sorting signal, dissociation of Mgr2 allows the signal to be released into the lipid phase through the open lateral gate of the Tim17 cavity.

References

    1. Wiedemann N & Pfanner N Mitochondrial Machineries for Protein Import and Assembly. Annu Rev Biochem 86, 685–714, doi:10.1146/annurev-biochem-060815-014352 (2017). - DOI - PubMed
    1. Hansen KG & Herrmann JM Transport of Proteins into Mitochondria. Protein J 38, 330–342, doi:10.1007/s10930-019-09819-6 (2019). - DOI - PubMed
    1. Callegari S, Cruz-Zaragoza LD & Rehling P From TOM to the TIM23 complex - handing over of a precursor. Biol Chem 401, 709–721, doi:10.1515/hsz-2020-0101 (2020). - DOI - PubMed
    1. Schmidt O, Pfanner N & Meisinger C Mitochondrial protein import: from proteomics to functional mechanisms. Nat Rev Mol Cell Biol 11, 655–667, doi:10.1038/nrm2959 (2010). - DOI - PubMed
    1. Araiso Y, Imai K & Endo T Structural snapshot of the mitochondrial protein import gate. FEBS J, doi:10.1111/febs.15661 (2020). - DOI - PubMed

Methods-only references

    1. McIsaac RS et al. Fast-acting and nearly gratuitous induction of gene expression and protein depletion in Saccharomyces cerevisiae. Mol Biol Cell 22, 4447–4459, doi:10.1091/mbc.E11-05-0466 (2011). - DOI - PMC - PubMed
    1. Lee ME, DeLoache WC, Cervantes B & Dueber JE A Highly Characterized Yeast Toolkit for Modular, Multipart Assembly. ACS Synth Biol 4, 975–986, doi:10.1021/sb500366v (2015). - DOI - PubMed
    1. Lin A et al. Utilization of a Strongly Inducible DDI2 Promoter to Control Gene Expression in Saccharomyces cerevisiae. Front Microbiol 9, 2736, doi:10.3389/fmicb.2018.02736 (2018). - DOI - PMC - PubMed
    1. Meisinger C, Pfanner N & Truscott KN Isolation of yeast mitochondria. Methods Mol Biol 313, 33–39, doi:10.1385/1-59259-958-3:033 (2006). - DOI - PubMed
    1. Meyer L et al. A simplified workflow for monoclonal antibody sequencing. PLoS One 14, e0218717, doi:10.1371/journal.pone.0218717 (2019). - DOI - PMC - PubMed

Publication types

MeSH terms

Substances