. 2023 Jul;619(7970):632-639.
doi: 10.1038/s41586-023-06254-7. Epub 2023 Jun 21.

Histone demethylase KDM5D upregulation drives sex differences in colon cancer

Affiliations

Histone demethylase KDM5D upregulation drives sex differences in colon cancer

Jiexi Li et al. Nature. 2023 Jul.

Abstract

Sex exerts a profound impact on cancer incidence, spectrum and outcomes, yet the molecular and genetic bases of such sex differences are ill-defined and presumptively ascribed to X-chromosome genes and sex hormones1. Such sex differences are particularly prominent in colorectal cancer (CRC) in which men experience higher metastases and mortality. A murine CRC model, engineered with an inducible transgene encoding oncogenic mutant KRASG12D and conditional null alleles of Apc and Trp53 tumour suppressors (designated iKAP)2, revealed higher metastases and worse outcomes specifically in males with oncogenic mutant KRAS (KRAS*) CRC. Integrated cross-species molecular and transcriptomic analyses identified Y-chromosome gene histone demethylase KDM5D as a transcriptionally upregulated gene driven by KRAS*-mediated activation of the STAT4 transcription factor. KDM5D-dependent chromatin mark and transcriptome changes showed repression of regulators of the epithelial cell tight junction and major histocompatibility complex class I complex components. Deletion of Kdm5d in iKAP cancer cells increased tight junction integrity, decreased cell invasiveness and enhanced cancer cell killing by CD8+ T cells. Conversely, iAP mice engineered with a Kdm5d transgene to provide constitutive Kdm5d expression specifically in iAP cancer cells showed an increased propensity for more invasive tumours in vivo. Thus, KRAS*-STAT4-mediated upregulation of Y chromosome KDM5D contributes substantially to the sex differences in KRAS* CRC by means of its disruption of cancer cell adhesion properties and tumour immunity, providing an actionable therapeutic strategy for metastasis risk reduction for men afflicted with KRAS* CRC.


Conflict of interest statement

Competing interests

R.A.D. holds equity as a former advisor and/or director of Tvardi Therapeutics, Asylia Therapeutics, Stellanova Therapeutics and Sporos Bioventures. The remaining authors declare no competing interests.

Figures
Extended Data Figure 1.
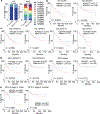
Extended Data Figure 1.. CRC sex differences in survival and metastasis are KRAS*-specific.
a, Stages of female and male iAP and iKAP tumours (two-tailed Chi-square test). b, c, Kaplan-Meier OS analysis for patients in CRCSC data set. d, e, Kaplan-Meier disease-free survival (DFS) analysis for patients in CRCSC data set. For survival analysis (b-e), log-rank (Mantel-Cox) test was used.
Extended Data Figure 2.
Extended Data Figure 2.. Comparisons of proximal and distal CRC in humans and mice.
a, Kaplan-Meier OS analysis for patients in CRCSC data set. b, Frequency of KRAS mutation in patients in CRCSC data set (two-tailed Binomial test). c, Subtypes of KRAS mutations in patients in CRCSC data set. d, Kaplan-Meier DFS analysis for patients with stage 1 or stage 2 cancers in CRCSC data set. e, Percentage of mutation combinations of KRAS (‘K’), APC (‘A’) and TP53 (‘P’) in TCGA CRC patients. f, Kaplan-Meier OS analysis for patients with indicated mutations in TCGA CRC data set. g, Stages of iKAP proximal tumours induced by injection of 4-OHT at proximal colon (two-tailed Chi-square test). For survival analysis (a, d, f), log-rank (Mantel-Cox) test was used.
Extended Data Figure 3.
Extended Data Figure 3.. KDM5D is upregulated in KRAS* driven metastasis.
a, qPCR of Kdm5d in male normal colonoids isolated from proximal (‘pro’) or distal (‘dis’) colon of healthy mice. Relative expression was calculated by normalizing to the ‘WT’ condition of each pair (n=3 wells per group). b, Western blot confirming successful overexpression of KRASG12D and activation of KRAS signalling and STAT4 signalling in colonoids used in a. Phospho-STAT4 and total STAT4 levels were quantified by normalizing to Actin and ‘WT’ condition. The samples were derived from the same experiment and gel/blots were processed in parallel. c, Two-tailed Pearson correlation analysis of KRAS signalling score and KDM5D expression in TCGA male CRC patients. KRAS signalling score was calculated with GSVA using expression of all genes in TCGA RNA-seq data and KRAS signalling activation signature which was derived from differentially expressed genes in RNA-seq of iKAP tumours with dox on versus off (SRP097890) (n=58 proximal CRC patients; n=38 distal CRC patients). d, qPCR of Kdm5d in male normal colonoids with indicated genotypes (n=3 wells per group). e, Western blot of colonoids with indicated genotypes in d. The samples were derived from the same experiment and gel/blots were processed in parallel. f, qPCR of Kdm5d in male normal colonoids. Relative expression was calculated by normalizing to ‘WT’ (n=3 wells per group). g, qPCR of Kdm5d in 3346 and matched liver metastatic cell line L2–1 (independent of L2–3). Relative expression was calculated by normalizing to 3346 (n=3 wells per group). h, qPCR of Kdm5d in organoids derived from male iKAP primary (‘Pri’) and matched spontaneous liver metastatic (‘Mets’) tumours. Relative expression was calculated by normalizing to ‘Pri’ (n=3 wells per group). i, Representative images of in vitro invasion assays of organoids used in h to validate the increased mobility of metastatic cells compared to primary cells. j, Quantitation of i (n=3 wells per group). k, Expression of KDM5D in human male CRC cell lines with KRAS mutations in CCLE database. l, Kaplan-Meier OS analysis for TCGA male CRC patients with high or low KDM5D expression (log-rank (Mantel-Cox) test). The optimal cutoff value of KDM5D expression was determined with Cutoff Finder application. m, Kdm5c expression (z score) iKAP tumour RNA-seq data (SRP097890). n, KDM5C expression in TCGA CRC patient RNA-seq data. o, KDM5C expression in CRC patients in Tsuji Colorectal Cancer RNA microarray data set downloaded from Oncomine database. For box plots in m-o, center lines denote medians; box limits denote 25th–75th percentile (Q1-Q3); whiskers are drawn up to the smallest or largest observed value that was still within 1.5 times the interquartile range below the first quartile or above the third quartile, respectively; all other observed points are plotted as outliers). All bar plots show mean value ± s.d.; except for correlation analysis (c) and survival analysis (l), P was derived with two-tailed unpaired t test; no adjustment for multiple comparisons.
Extended Data Figure 4.
Extended Data Figure 4.. Kdm5d deletion suppresses tumour cell metastasis.
a, qPCR of Kdm5d in L2–3 and two independent Kdm5d knockout cell lines (‘KO1’ and ‘KO2’) derived from L2–3. Relative expression was calculated by normalizing to ‘L2–3’ (n=3 wells per group). b, Proliferation assay of 3346, L2–3 and KO1 (n=3 wells per group; error bars indicate s.d.; two-tailed Mann-Whitney test; no adjustment for multiple comparisons). c, Representative images of migration and invasion assay. d, Quantitation of c (n=3 wells per group). e, Growth curves of subcutaneous tumours in male nude mice (two-tailed Mann-Whitney test; no adjustment for multiple comparisons). f, Liver metastases detected by luminescence in male nude mice with intrasplenically injected male iKAP cells with a luciferase reporter (n=5 mice per group). g, Quantitation of luminescence signals in f (n=5 mice per group). h, Kaplan-Meier OS analysis of mice in f (n=5 mice per group; Log-rank [Mantel-Cox] test). i, Representative liver tissues with metastatic tumours from an independent experimental repeat of f-h (n=3 livers per group). j, Number of gross surface metastasis in livers in i. Cells injected into spleen metastasize to liver through portal vein. Surrounding the blood vessel, the cells form initial liver metastasis, followed by whole liver spread. The formation of liver surface metastasis indicates higher metastatic potential of the cells and more aggressive disease. k, Percentage of histologically metastatic lesion area in all liver lobes in each mouse. l, Representative histology of liver metastasis (representing three tissues per group). m, qPCR of KDM5D in 2806, a cell line derived from female iKAP distal primary CRC, and 2806 with overexpression of WT or enzymatic-dead (‘ED’) human KDM5D. Relative expression was calculated by normalizing to ‘hKDM5DWT OE’ (n=3 wells per group). n, Representative images of migration and invasion assays of cell lines in m. o, Quantitation of n (n=3 wells per group). p, Liver metastases detected by luminescence in female nude mice with intrasplenically injected female iKAP cells with a luciferase reporter (n=3 mice per group). q, Quantitation of luminescence signals in p (n=3 mice per group, except for n=2 mice for hKDM5DWT OE group at 27 days). r, Liver metastatic tumours from mice in p. For all bar/dot plots (a, d, g, j, k, m, o, q), data are shown as mean value ± s.d.; P was derived with two-tailed unpaired t test; no adjustment for multiple comparisons.
Extended Data Figure 5.
Extended Data Figure 5.. STAT4 activation correlates with KRAS signalling activation and KDM5D expression.
a, STAT4 motifs in mouse and human in indicated databases. b, Representative images of IHC of iKAP primary tumours (representing three individual tumours per group). c, Representative images of IHC of tissue microarrays (TMA) of male CRC patients’ primary tumours (representing results from 24 patients, as detailed in d). d, Pearson correlation analysis of H-scores of phospho-STAT4 and phospho-ERK in nucleus of epithelial cells in TMA of male CRC patients’ primary tumours (n=24 patients, 9 with proximal CRC, 15 with distal CRC). e, ChIP-seq tracks of STAT4 IP and input around promoters of Socs1, Socs2, and Socs3 in iKAP cells cultured with dox. f, qPCR of L2–3 with WT or phosphomimetic STAT4 overexpression. Relative expression was calculated by normalizing to ‘L2–3’ (n=3 wells per group; two-tailed unpaired t test; mean value ± s.d.; no adjustment for multiple comparisons). g, Pearson correlation analysis of STAT4, SOCS1, SOCS2, SOCS3 and KDM5D expression in TCGA male CRC patients. X- and Y-axis units are mRNA expression (RNA-seq V2 RSEM) (n=229, 228, 230, 229 patients). h, i, Pearson correlation analysis of STAT4, SOCS2 and KDM5D expression in TCGA male CRC patients with proximal or distal primary tumours. X- and Y-axis units are mRNA expression (RNA-seq V2 RSEM) (for h, n=101, 102 patients; for i, n=115, 115 patients).
Extended Data Figure 6.
Extended Data Figure 6.. AMOT is downregulated in metastasis and negatively regulated by KDM5D.
a, Metaplot of H3K4me1 in iKAP cells. Average signal in the window of 5 kb up-/down-stream of TSSs was used for two-tailed Mann-Whitney test. 3346 versus L2–3, P = 0.3899, L2–3 versus KO, P = 0.0269, 3346 versus KO, P = 0.0013. b, qPCR of 3346, L2–1 and L2–1 with Kdm5d knockout (L2–1 KO). Relative expression was calculated by normalizing to ‘3346’ (n=3 wells per group). c, qPCR of human male metastatic CRC cells LoVo and two independent KDM5D knockout clones (‘KO1’ and ‘KO2’). Relative expression was calculated by normalizing to ‘LoVo’ (n=3 wells per group). LoVo cell line has KRASG13D, APC loss of function mutations (nonsense mutation and frameshift deletion) and missense mutation, and wild-type TP53. d, qPCR of organoids from iKAP primary (‘Pri’) and matched spontaneous metastatic (‘Mets’) tumours, which were validated in Extended Data Fig. 3h–j. Relative expression was calculated by normalizing to ‘Pri’ (n=3 wells per group). e, RNA microarray data of CRC primary and metastatic tumours from patients in Tsuji Colorectal Cancer data set in Oncomine (box plots, center lines denote medians; box limits denote 25th–75th percentile [Q1-Q3]; whiskers are drawn up to the smallest or largest observed value that was still within 1.5 times the interquartile range below the first quartile or above the third quartile, respectively; all other observed points are plotted as outliers). f, ChIP-seq tracks of H3K4me2/3 IP and input around Amot promoter in iKAP cells. g, Pearson correlation analysis of AMOT and KDM5D expression in TCGA CRC male patients. X- and Y-axis units are mRNA expression (RNA-seq V2 RSEM) (n=228 patients). h, qPCR of female colonoids with indicated genotypes (‘WT’, wild type; ‘K’, KRASG12D overexpression in WT colonoids) and corresponding colonoids with mouse Kdm5d overexpression. Kdm5d relative expression was calculated by normalizing to ‘KDM5DOE’; Amot relative expression was calculated by normalizing to ‘Ctrl’ (n=3 wells per group). i, Growth curves of subcutaneous tumours from L2–3 cell line and L2–3 with Amot overexpression in male nude mice (two-tailed Mann-Whitney test). j, Representative liver metastatic tumours in male nude mice with intrasplenically injected male iKAP cells. k, Number of gross surface metastasis in livers in j. l, Percentage of histologically metastatic lesion area in all liver lobes in each mouse in j. m, Representative histology of liver metastasis (representing five livers per group). n, Kaplan-Meier OS analysis of mice from an independent experimental repeat of j-m (log-rank (Mantel-Cox) test). o, Western blot of fractionated iKAP cell cytoplasmic membrane. NaK ATPase was used as the membrane-specific loading control. p, q, Paracellular permeability assay of iKAP cells. FITC-conjugated dextran with molecular weight of 2000 kDa was used (for p, n=2 wells per group; for q, n=4 wells per group). r, GSEA of iKAP cell RNA-seq. s, Expression of AMOT in human CRC cell lines with KRAS mutations in CCLE (box plots, center lines denote medians; box limits denote 25th–75th percentile [Q1-Q3]; whiskers are drawn up to the smallest or largest observed value that was still within 1.5 times the interquartile range below the first quartile or above the third quartile, respectively; all other observed points are plotted as outliers). All bar/dot plots (b-d, h, k, l, p, q) show mean value ± s.d.. For b-e, h, k, l, p, q, s, P was derived with two-tailed unpaired t test; no adjustment for multiple comparisons.
Extended Data Figure 7.
Extended Data Figure 7.. KDM5D regulates H3K27ac and super-enhancer activity.
a, b, Heatmaps (a) and metaplots (b) of H3K27ac in iKAP cells. Average signal in the window of 5 kb up-/down-stream TSSs was used to focus on the gene enhancers, and two-tailed Mann-Whitney test was performed. 3346 versus L2–3, P < 0.0001, L2–3 versus KO, P < 0.0001, 3346 versus KO, P < 0.0001. c, Putative super-enhancers ranked by H3K27ac signal in iKAP cells. ‘Super’ indicates super-enhancer, ‘Typical’ indicates typical enhancer. The super-enhancer predicted to regulate the MHC gene cluster was pointed out. d, The percentage of long and short-range interactions in iKAP cells detected by HiChIP analysis. e, Interaction map between and within chromosomes in iKAP cells detected by HiChIP. f, Top: ChIP-seq tracks of enhancer markers H3K27ac and H3K4me1 in the MHC gene cluster, super-enhancer region was highlighted in yellow; bottom: the interaction map generated by HiChIP analysis in iKAP cells. For e and f, red to white color range indicates more to less interaction.
Extended Data Figure 8.
Extended Data Figure 8.. TAP1/2 are regulated by KDM5D and are correlated with CRC metastasis and shorter survival.
a, qPCR of iKAP cells. Relative expression was calculated by normalizing to ‘3346’ (n=3 wells per group). Fold changes between L2–3 and KO of all three genes were < 1.5, indicating no expression correlation between genes tested and Kdm5d. b, qPCR of iKAP cells. Relative expression was calculated by normalizing to ‘3346’ (n=3 wells per group). c, qPCR of human male metastatic CRC cells LoVo and two independent KDM5D knockout clones (‘KO1’ and ‘KO2’). Relative expression was calculated by normalizing to ‘LoVo’ (n=3 wells per group). d, qPCR of organoids from male iKAP primary (‘Pri’) and metastatic (‘Mets’) tumours. Relative expression was calculated by normalizing to ‘Pri organoids’ (n=3 wells per group). e, qPCR of female colonoids of indicated genotypes and corresponding colonoids with mouse Kdm5d overexpression. Relative expression was calculated by normalizing to ‘Ctrl’ (n=3 wells per group). f, g, RNA microarray data of TAP1 (f) and TAP2 (g) in CRC primary and metastatic tumours from patients in Tsuji Colorectal Cancer data set in Oncomine (box plots, center lines denote medians; box limits denote 25th–75th percentile [Q1-Q3]; whiskers are drawn up to the smallest or largest observed value that was still within 1.5 times the interquartile range below the first quartile or above the third quartile, respectively; all other observed points are plotted as outliers). h, i, Kaplan-Meier OS analysis of TCGA CRC patients with low and high expression of TAP1 (h) or TAP2 (i) (log-rank (Mantel-Cox) test). The optimal cutoff values of TAP1 and TAP2 expression were determined with Cutoff Finder application. All bar plots (a-e) show mean value ± s.d.. For a-g, P was derived with two-tailed unpaired t test; no adjustment for multiple comparisons.
Extended Data Figure 9.
Extended Data Figure 9.. KDM5D interacts with Sin3-HDAC complex.
a, b, Western blot for co-IP experiment in HEK293T cells. ‘∅’ indicates control vectors. WT, wild type, ED, enzymatic dead. c, qPCR of 2806 cell line and 2806 with overexpression of WT or ED form of mouse Kdm5d. Kdm5d relative expression was calculated by normalizing to ‘2806 mKDM5DWT OE’; Amot, Tap1 and Tap2 relative expression was calculated by normalizing to ‘2806’ (n=3 wells per group; two-tailed unpaired t test; mean value ± s.d.; no adjustment for multiple comparisons).
Extended Data Figure 10.
Extended Data Figure 10.. Schematic representation of the KRAS*-STAT4-KDM5D axis and the mechanisms of KDM5D driving metastasis in male-specific CRC.
CTL: CD8+ cytotoxic T lymphocytes.
Figure 1.
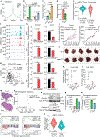
Figure 1.. KDM5D is correlated with sex-specific KRAS* CRC metastasis.
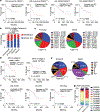
a, Kaplan-Meier overall survival (OS) analyses of iKAP and iAP male and female mice. b, Kaplan-Meier OS analyses of CRC patients with wild-type (WT) or mutant (mut) KRAS in an integrated data set from Colorectal Cancer Subtyping Consortium (CRCSC) (for a and b, Log-rank (Mantel-Cox) test). c, Intersection analysis of differentially expressed genes in two comparisons. Differential genes were filtered with fold change > 1.5 and P < 0.05. KRAS*: oncogenic KRAS mutation. Database: SRP097890. d, Quantitative PCR (qPCR) measuring expression of Kdm5d in cell lines derived from male iKAP distal primary CRC (3346) and matched liver metastasis (L2–3) cultured in medium with doxycycline (dox) on or off. Relative expression was calculated by normalizing to ‘3346 dox on’ (n=3 wells per group; two-tailed unpaired t test; mean value ± s.d.; no adjustment for multiple comparisons). e, Expression of KDM5D in TCGA RNA-seq data of male CRC patients. All KRAS mutations were included (the most common ones were G12D, G13D and G12V); patients were not filtered based on APC and TP53 mutations. f, Expression of KDM5D in male CRC patients in Tsuji Colorectal Cancer RNA microarray data set downloaded from Oncomine database. Metastasis sites included liver (n=14), lung (n=1) and peritoneum (n=3) (for e and f, two-tailed unpaired t test; box plots, center lines denote medians; box limits denote 25th–75th percentile [Q1-Q3]; whiskers are drawn up to the smallest or largest observed value that was still within 1.5 times the interquartile range below the first quartile or above the third quartile, respectively; all other observed points are plotted as outliers).
Figure 2.
Figure 2.. Kdm5d transgene expression promotes tumour invasiveness and metastasis.
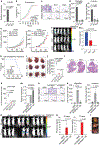
a, Schemes of three genetically engineered mouse models. b, qPCR of total Kdm5d expression in formalin-fixed paraffin-embedded (FFPE) tissues of primary tumours. Relative expression was calculated by normalizing to the ‘iAP M1’ sample and housekeeping gene Gapdh (n=3 female iAP mice, n=3 male iAP mice, n=3 female iAP-KDM5D mice, n=1 male iAP-KDM5D mouse; unpaired two-tailed t test; mean value ± s.d.; no adjustment for multiple comparisons). c, Representative images of the most invasive primary tumours and, if any, lymph node (LN) and distal metastases. iAP and iAP-KDM5D, female; iKAP, male. d, Percentage of TNM (tumour, node, metastasis) stages of tumours from iAP (male and female combined), iAP-KDM5D male and female and iKAP (male and female combined) mice (two-tailed Chi-square test).
Figure 3.
Figure 3.. KRAS* drives KDM5D expression through STAT4.
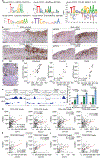
a, Intersection of genes upregulated in KRAS* on versus off iKAP cell RNA-seq and the predicted transcription factors (TFs) bound to mouse Kdm5d or human KDM5D promoters. Differential expression in RNA-seq was filtered with fold change > 1.5, P < 0.05. RNA-seq data were retrieved from SRP097890. b, Stat4 expression (z-score) in RNA-seq data of a (n=5 pairs of matched dox (KRAS*) on or off iKAP cells; two-tailed paired t test). c, Metaplots of STAT4 ChIP-seq in male iKAP cells with dox on/off. Average signal in the window of 5 kb up-/down-stream transcription start sites (TSSs) was used for two-tailed Mann-Whitney test. P < 0.0001. RPKM, reads per kilobase of transcript per million mapped reads. d, ChIP-seq tracks of STAT4 IP and Input around Kdm5d promoter in male iKAP cells with dox on/off. bp, base pair. e, f, Luciferase assays of WT mouse STAT4 and luciferase reporter driven by WT or mutant Kdm5d promoters (mutations at putative STAT4 binding site ~ 200bp and 700bp upstream of TSS) (e), and phospho-dead (S723A, S721A, Y693F) or WT mouse STAT4 and luciferase reporter driven by WT Kdm5d promoter (f) (n=3 wells per group; two-tailed unpairs t test; no adjustment for multiple comparisons). Flu, firefly luciferase activity; Rlu, Renilla luciferase activity. g, h, qPCR of Stat4 (g) and the STAT4 driven Kdm5d expression (h). Relative expression was calculated by normalizing to ‘L2–3’ (n=3 wells per group; two-tailed unpaired t test; no adjustment for multiple comparisons). i, Western blot of iKAP cells. The samples were derived from the same experiment and gel/blots were processed in parallel. For all bar plots (b, e, f, g, h), data are mean value ± s.d..
Figure 4.
Figure 4.. KDM5D impairs tight junctions through epigenetically repressing AMOT.
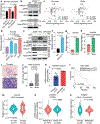
a, Heatmaps of H3K4me2/3 in iKAP cells. KO, knockout. b, Metaplots of H3K4me2/3 corresponding to a. Average signal in the window of 1kb up-/down-stream of TSSs (gene promoter area) was used for two-tailed Mann-Whitney test. H3K4me2: 3346 versus L2–3, P = 0.002, L2–3 versus KO, P = 0.0051, 3346 versus KO, P = 0.968; H3K4me3: 3346 versus L2–3, P < 0.0001, L2–3 versus KO, P = 0.0005, 3346 versus KO, P = 0.0041. c, Intersection analysis. d, qPCR of Amot in iKAP cells. Relative expression was calculated by normalizing to ‘3346’ (n=3 wells per group). e, Representative images of migration assay of iKAP cells. OE, overexpression. f, Quantitation of e (n=3 wells per group). g, Representative confocal imaging of immunofluorescence staining. h, Representative transmission electron microscopy imaging of primary iKAP tumours. The apical side of intestinal epithelial cell was labeled. The number of images taken is indicated in i. Scale bars, 100 nm. i, Number of visible ‘kissing points’ within tight junction structure (n=9 tumours per group). All bar/dot plots (d, f, i) show mean value ± s.d.; P was derived with two-tailed unpaired t test; no adjustment for multiple comparisons.
Figure 5.
Figure 5.. KDM5D represses MHC class I antigen processing and presentation.
a, Intersection analysis of all MHC cluster genes that were downregulated in L2–3 versus 3346 and upregulated in KO versus L2–3 and that have human orthologs. b, qPCR of Tap1 and Tap2 in iKAP cells. Relative expression was calculated by normalizing to ‘3346’ (n=3 wells per group). c, Flow cytometry measurement of cell surface MHC-I complex in iKAP cells +/− 10 ng/ml interferon-gamma (IFNγ) overnight treatment. Median fluorescence intensity (MFI): - IFNγ: unstained (grey): 527, L2–3 (blue): 765, KO (red): 1297; + IFNγ: unstained (grey): 2048, L2–3 (dark blue): 3731, KO (orange): 5824. d, Flow cytometry measurement of cell surface OVA 257–264 (SIINFEKL) peptide bound MHC-I complex in iKAP cells treated with 2 mg of ovalbumin protein and +/− 10 ng/mL IFNγ. In c and d, the x-axis is the fluorescence intensity, the y-axis is the count of events scaled as the percentage of the maximum count. e, Percentage of dead iKAP cells (GFP+ for iKAP cells and SYTOX Blue+ for dead cells) in CD8+ T cell killing assay (Effector: target = 10: 1) (n=3 wells per group). f, Representative images of immunohistochemistry (IHC) for CD8 at the tumour invasive front in iAP, iAP-KDM5D and iKAP primary tumours with comparable invasiveness (pTis and pT1). g, Quantitation of the number of CD8+ cells at the tumour invasive front detected by IHC. h, GSEA of TCGA male CRC RNA-seq data using gene set ‘c7.all.v7.4.symbols.gmt [Immunologic signatures]’. KDM5D-High or -Low were determined following the same criteria as in Extended Data Fig. 3l. For b, e, g, Data are mean value ± s.d.; P was derived with two-tailed unpaired t test; no adjustment for multiple comparisons. FDR, false discovery rate; NES, normalized enrichment score.

Comment in

References

    1. Haupt S, Caramia F, Klein SL, Rubin JB & Haupt Y Sex disparities matter in cancer development and therapy. Nat Rev Cancer 21, 393–407, doi:10.1038/s41568-021-00348-y (2021). - DOI - PMC - PubMed
    1. Boutin AT et al. Oncogenic Kras drives invasion and maintains metastases in colorectal cancer. Genes Dev 31, 370–382, doi:10.1101/gad.293449.116 (2017). - DOI - PMC - PubMed
    1. Rubin JB et al. Sex differences in cancer mechanisms. Biol Sex Differ 11, 17, doi:10.1186/s13293-020-00291-x (2020). - DOI - PMC - PubMed
    1. Mervic L Time course and pattern of metastasis of cutaneous melanoma differ between men and women. PLoS One 7, e32955, doi:10.1371/journal.pone.0032955 (2012). - DOI - PMC - PubMed
    1. Kim SE et al. Sex- and gender-specific disparities in colorectal cancer risk. World J Gastroenterol 21, 5167–5175, doi:10.3748/wjg.v21.i17.5167 (2015). - DOI - PMC - PubMed

Publication types