Review
. 2023 Jul;18(7):1981-2013.
doi: 10.1038/s41596-023-00840-9. Epub 2023 Jun 21.

Optimizing the Cell Painting assay for image-based profiling

Affiliations
Review

Optimizing the Cell Painting assay for image-based profiling

Beth A Cimini et al. Nat Protoc. 2023 Jul.

Abstract

In image-based profiling, software extracts thousands of morphological features of cells from multi-channel fluorescence microscopy images, yielding single-cell profiles that can be used for basic research and drug discovery. Powerful applications have been proven, including clustering chemical and genetic perturbations on the basis of their similar morphological impact, identifying disease phenotypes by observing differences in profiles between healthy and diseased cells and predicting assay outcomes by using machine learning, among many others. Here, we provide an updated protocol for the most popular assay for image-based profiling, Cell Painting. Introduced in 2013, it uses six stains imaged in five channels and labels eight diverse components of the cell: DNA, cytoplasmic RNA, nucleoli, actin, Golgi apparatus, plasma membrane, endoplasmic reticulum and mitochondria. The original protocol was updated in 2016 on the basis of several years' experience running it at two sites, after optimizing it by visual stain quality. Here, we describe the work of the Joint Undertaking for Morphological Profiling Cell Painting Consortium, to improve upon the assay via quantitative optimization by measuring the assay's ability to detect morphological phenotypes and group similar perturbations together. The assay gives very robust outputs despite various changes to the protocol, and two vendors' dyes work equivalently well. We present Cell Painting version 3, in which some steps are simplified and several stain concentrations can be reduced, saving costs. Cell culture and image acquisition take 1-2 weeks for typically sized batches of ≤20 plates; feature extraction and data analysis take an additional 1-2 weeks.This protocol is an update to Nat. Protoc. 11, 1757-1774 (2016): https://doi.org/10.1038/nprot.2016.105.


Figures

Extended Data Figure 1 -
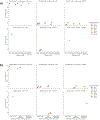
The JUMP-MOA compound plate map: unlabeled wells are DMSO only, all other wells are labeled to show distribution of compound replicates across the entire plate. A version of this figure grouped by MOA rather than compound is available as Figure 2A.
Extended Data Figure 2-
A) Assessment of decreasing or increasing the number of cells plated by 20% on ability to perform Percent Matching. Few consistent effects are seen. B) Assessment of using parental cell lines or Cas9 expressing polyclonal lines for compound treatments. Few consistent effects are seen; ability to match compounds in parental vs Cas9 cells against CRISPR (required to be performed in Cas9 cells) does not seem extremely different at either common time point.
Extended Data Figure 3-
Assessment of the effect of gene-treatment-related compounds on image-based profiling. A) Addition of blasticidin to ORF plates or puromycin to CRISPR plates does not appear to improve percent matching across modalities vs unselected plates. B) Addition of selection compounds may have a deleterious effect on percent matching vs unselected plates, though we cannot rule out that this is due to fewer replicates for the selected plates than the unselected ones. C) Addition of 4μg/mL polybrene for 24 hours may produce a phenotypic effect; polybrene addition displays decreased inter-treatment cross-plate percent replicating vs intra-treatment cross-plate-percent replicating, even though both sets of plates were part of the same batch. D) Addition of polybrene to Target2 treated cells does not improve percent matching between Target2 treated plates and ORF treated plates from a previous batch.
Extended Data Figure 4-
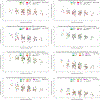
A) PhenoPlates without barrier wells and Aurora plates with barrier wells produce comparable percent replicating and percent matching results. B) Performing permeabilization at the same time as staining produces comparable percent replicating and percent matching results.
Extended Data Figure 5-
A) Within batches, reducing all dyes by 2 or 4 fold produces comparable percent replicating and comparable but perhaps slightly decreased percent matching results. B) All quantitatively tested stain concentration changes, broken out by the dye(s) perturbed.
Extended Data Figure 6-
A) Imaging of the same plates on a widefield microscope with 2×2 binning vs a different manufacturer’s microscope in confocal with 1×1 binning. No major differences are observed. B) Acquisition of multiple Z planes slightly improves percent replicating but not percent matching in two batches.
Extended Data Figure 7 -
Mean percent replicating of eight JUMP-MOA plates stained with the final staining conditions after dropping out all feature names containing individual channel names before performing feature selection and calculation of percent replicating. “None” means that only AreaShape features are present. To create a sufficiently compact data representation, theeightchannels present were split 4 each onto the X (AGP, DNA, ER, and Mito) and Y (RNA, Brightfield, BFHigh, and BFLow) axes; this allows visualization of the 256 possible unique combinations. Note that these results are not the same as truly having the stains not present, as a) a channel still may have been used in creating the initial segmentation results and b) it does not account for cross talk between stains. An alternate representation of this data is presented in Extended Data Figure 8.
Extended Data Figure 8-
Change in mean percent replicating of eightJUMP-MOA plates stained with the final staining conditions when an individual stain is present vs not; each chart shows for a particular stain when added to the non-channel-specific features plus zero or more other stains (x axis) the change in the mean percent replicating (y axis) when those features are included. The color(s) of each marker indicate which channel(s) is/are already present. Note that these results are not the same as truly having the stains not present, as a) a channel still may have been used in creating the initial segmentation results and b) it does not account for cross talk between stains. The absolute percent replicating numbers are available in Extended Data Figure 7.
Extended Data Figure 9 -
Stain-by-stain breakdown of mean percent replicating of eightJUMP-MOA plates stained with the final staining conditions after dropping out all possible combinations of features from the 5 stain-specific feature categories before performing feature selection and calculation of percent replicating. Unlike the analyses in Extended Data Figure 7 and Extended Data Figure 8, non-channel-specific feature categories (AreaShape and Neighbors) are not included here, as the goal is to assess the information contribution of each feature category in each stain. To create a sufficiently compact data representation, the 5 categories present were split 3 each onto the X (Correlation, Granularity, and Intensity) and2 onto the Y (RadialDistribution, and Texture) axes; this allows visualization of the 31 possible unique combinations.
Fig. 1 |
Fig. 1 |. Visualization of cells in the Cell Painting assay.
Dimethyl sulfoxide–treated U2OS cells treated with the Cell Painting assay; the six dyes in five channels stain eight cellular compartments. Top row (left to right): mitochondrial staining; actin, Golgi, and plasma membrane staining; and nucleolar and cytoplasmic RNA staining. Bottom row (left to right): endoplasmic reticulum staining, DNA staining, a montage of all five channels.
Fig. 2 |
Fig. 2 |. Plate maps used for assay-optimization experiments.
a, The JUMP-MOA compound plate map: unlabeled wells are dimethyl sulfoxide only; all other wells are labeled to show distribution of MOA classes across the entire plate. A version of this figure grouped by compound rather than MOA is available as Extended Data Fig. 1. b, The JUMP-Target plate maps. Black wells contain negative control treatments, whereas gray wells are untreated; other sets of control treatments were selected to provide sets of diverse pairs of positive controls (purples), provide a match between genes and compounds on the basis of previous Cell Painting experiments (teals) or match genes and compounds on the basis of external reports of strong correlations between pairs (yellows). These controls are scattered among treatments hypothesized to affect other genes (reds). See also ref. for more information on the creation of the JUMP-Target plate maps.
Fig. 3 |
Fig. 3 |. Assessment of cell type suitability for Cell Painting.
a, Assessment of compound percent replicating and percent matching by using JUMP-MOA plates in A549 and U2OS parental, Cas9-polyclonal and Cas9-monoclonal lines. In U2OS, the polyclonal line outperforms the single monoclonal line tested; in A549, performance is more varied. b, Assessment of the ability to match compounds, overexpressed genes and CRISPR knockdown genes across treatment conditions in A549 and U2OS. The top-left, bottom-left and bottom-right panels reflect the ability to match across two time points of compound treatment, gene overexpression and gene knockdown, respectively; the remaining panels describe the ability to match to perturbations of a different modality but thought to be targeting the same gene. U2OS has slightly worse compound-to-compound-across-time-point percent matching than A549 but performs better across time points at matching overexpressions to overexpressions and knockdowns to knockdowns. Although no cell/time point cross-modality comparisons performed noticeably above random chance (10%), U2OS performed comparably or better than A549 at the final treatment time points chosen (purple dots in the top center panel, orange dots in the top-right and bottom-center panels). For more information including the plate(s) represented by each data point, see the Source Data file for this figure; expanded experimental details for each plate may be found in Supplementary Data File 1.
Fig. 4 |
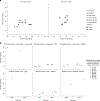
Fig. 4 |. Assessment of staining conditions for use in the JUMP Consortium.
a, Comparison of percent replicating and percent matching for three versions of Cell Painting: version 2 (v2; ref. conditions) versus version 2.5 (v2.5; ref. plus introduction changes 1–6) versus version 3 (v3; this paper’s final recommendations). The move from v2 to v2.5 seemed to improve both percent replicating and percent matching in the Stain 4 pilot experiment (red dots); the move from v2.5 to v3 decreases reagent cost while maintaining comparable, if not slightly improved, percent matching in the Stain 5 pilot experiment (blue dots). Note that Stain 5 experiments (blue dots) were performed by using only half the compound dose used in Stain 4 experiments (red dots). b, Comparison of reagents from two different vendors across multiple stain conditions and microscopes. Performance is extremely similar between vendors in all conditions tested. c, Assessment of persistence of Cell Painting plate quality over storage time. Percent replicating seems to be decreasing by day 28 but is quite similar to initial values at day 14. For more information including the plate(s) represented by each data point, see the Source Data file for this figure; expanded experimental details for each plate may be found in Supplementary Data File 1. AZ, AstraZeneca; Cond, condition.
Fig. 5 |
Fig. 5 |. Assessment of imaging conditions for use in the JUMP Consortium.
a, Cell Painting works similarly well with wide-field and confocal microscopy. b, Relationship between fields of view captured and percent replicating: increasing the number of fields of view increases percent replicating up until ~10 fields of view. At this magnification and plating density, each field of view contains ~145 cells. c, Cell Painting performs well when images are captured with either 1 × 1 or 2 × 2 binning. d, Cell Painting performs similarly when plates are imaged at a lower or two to four times higher (but still below saturation) laser power and/or exposure time. e, Assessment of the effect of re-imaging on percent replicating: a drop between first and second imaging is observed and a potential small continued decrease thereafter. For more information including the plate(s) represented by each data point, see the Source Data file for this figure; expanded experimental details for each plate may be found in Supplementary Data File 1.
◄ Fig. 6 |
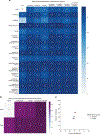
◄ Fig. 6 |. Assessment of image-analysis feature options for use in the JUMP Consortium.
a, Mean percent replicating of eight JUMP-MOA plates stained with the final staining conditions after dropping out all possible combinations of features from the seven major feature categories before performing feature selection and calculation of percent replicating. To create a sufficiently compact data representation, the seven categories present were split three onto the X (Correlation, Granularity and Intensity) and four onto the Y (AreaShape, Neighbors, RadialDistribution and Texture) axes; this allows visualization of the 127 possible unique combinations. A channel-by-channel breakdown of the importance of the feature categories is provided as Extended Data Fig. 9. b, A parallel analysis of the same experiment as in a, but with the three compartments present, two on the X axis (Cytoplasm and Nuclei) and Cells on the Y axis. c, Assessment of the effect of varying the measurement scales in CellProfiler (i.e., measuring Texture at 3- and 5-pixel spacings (Smaller) versus 5- and 10-pixel spacings (Larger)) on percent replicating for two plates of the CPJUMP1 experiment. Using larger measurement scales in the MeasureGranularity, MeasureTexture and MeasureObjectNeighbors modules seemed to produce a very small decrease in percent replicating but no major effect. For more information including the plate(s) represented by each data point, see the Source Data file for this figure; expanded experimental details for each plate may be found in Supplementary Data File 1.

References

    1. Chandrasekaran SN, Ceulemans H, Boyd JD & Carpenter AE Image-based profiling for drug discovery: due for a machine-learning upgrade? Nat. Rev. Drug Discov 20, 145–159 (2021). - PMC - PubMed
    1. Pratapa A, Doron M & Caicedo JC Image-based cell phenotyping with deep learning. Curr. Opin. Chem. Biol 65, 9–17 (2021). - PubMed
    1. Bray M-A et al. Cell Painting, a high-content image-based assay for morphological profiling using multiplexed fluorescent dyes. Nat. Protoc 11, 1757–1774 (2016). - PMC - PubMed
    1. Gustafsdottir SM et al. Multiplex cytological profiling assay to measure diverse cellular states. PLoS ONE 8, e80999 (2013). - PMC - PubMed
    1. Garcia-Fossa F et al. Interpreting image-based profiles using similarity clustering and single-cell visualization. Curr. Protoc 3, e713 (2023). - PMC - PubMed

Publication types