. 2023 Jun 21;6(1):657.
doi: 10.1038/s42003-023-05013-8.

Molecular and cellular evidence for the impact of a hypertrophic cardiomyopathy-associated RAF1 variant on the structure and function of contractile machinery in bioartificial cardiac tissues

Affiliations

Molecular and cellular evidence for the impact of a hypertrophic cardiomyopathy-associated RAF1 variant on the structure and function of contractile machinery in bioartificial cardiac tissues

Saeideh Nakhaei-Rad et al. Commun Biol. .

Abstract

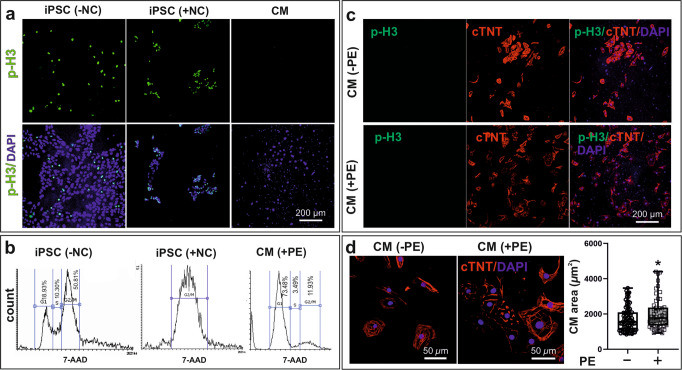
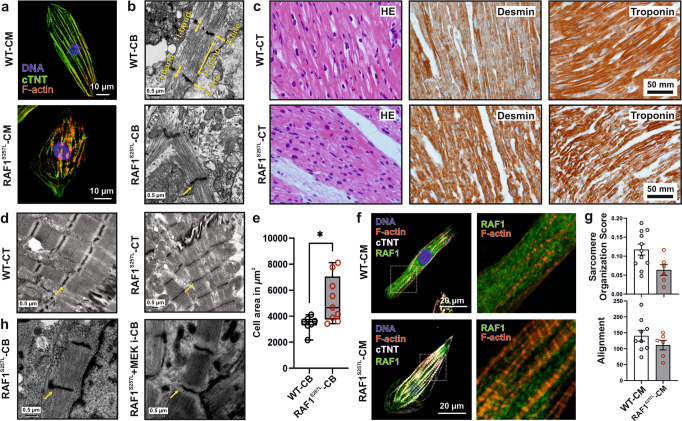
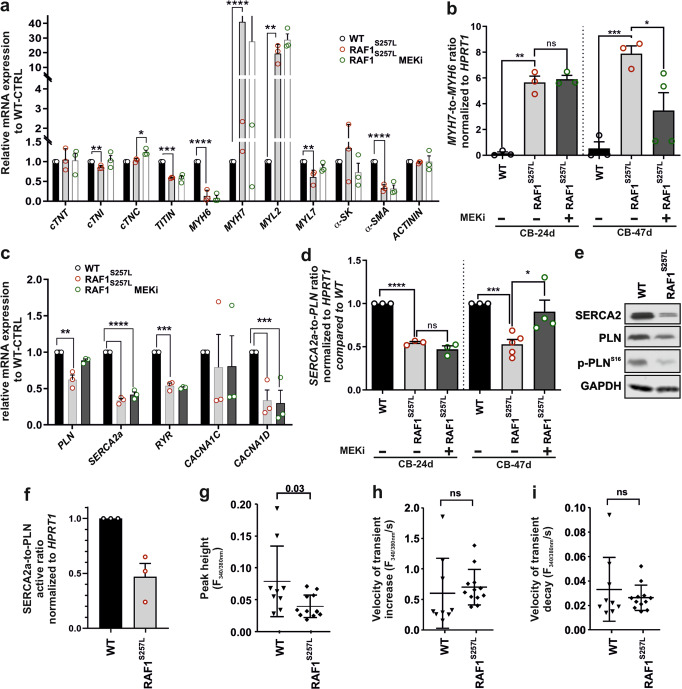
Noonan syndrome (NS), the most common among RASopathies, is caused by germline variants in genes encoding components of the RAS-MAPK pathway. Distinct variants, including the recurrent Ser257Leu substitution in RAF1, are associated with severe hypertrophic cardiomyopathy (HCM). Here, we investigated the elusive mechanistic link between NS-associated RAF1S257L and HCM using three-dimensional cardiac bodies and bioartificial cardiac tissues generated from patient-derived induced pluripotent stem cells (iPSCs) harboring the pathogenic RAF1 c.770 C > T missense change. We characterize the molecular, structural, and functional consequences of aberrant RAF1-associated signaling on the cardiac models. Ultrastructural assessment of the sarcomere revealed a shortening of the I-bands along the Z disc area in both iPSC-derived RAF1S257L cardiomyocytes and myocardial tissue biopsies. The aforementioned changes correlated with the isoform shift of titin from a longer (N2BA) to a shorter isoform (N2B) that also affected the active force generation and contractile tensions. The genotype-phenotype correlation was confirmed using cardiomyocyte progeny of an isogenic gene-corrected RAF1S257L-iPSC line and was mainly reversed by MEK inhibition. Collectively, our findings uncovered a direct link between a RASopathy gene variant and the abnormal sarcomere structure resulting in a cardiac dysfunction that remarkably recapitulates the human disease.


Conflict of interest statement

B.D.G.’s institution receives royalties from genetic testing for RAF1 for Noonan syndrome from Correlegan, LabCorp, GeneDx, and Prevention Genetics. B.D.G. is a consultant for Day One Biopharmaceuticals and was recently a consultant for BioMarin. He received a sponsored research award from Onconova. M.Z. is a member of a scientific advisory board for Day One Biopharmaceuticals.

Figures

Fig. 1
Fig. 1. Study overview and details of 3D cardiac differentiation of iPSCs with WNT signaling modulation.
a Summary of the donor cells and the iPSC lines together with an overview of different analysis approaches used in this study. EM electron microscopy, IHC immunohistochemistry, qPCR quantitative PCR, WB western blot. b Schematic overview of embryoid body (EB) formation using agarose microwells combined with the stages and timelines of EBs differentiation to cardiac bodies (CBs). c Light microscopic pictures of EBs/CBs during the course of cardiac differentiation and metabolic selection. d Exemplary histograms of flow cytometric analysis of dissociated CBs displayed efficient cardiac differentiation towards ventricular CMs by analysis of MLC2V and cTNT positive cells (RAF1S257L, line 1). Isotype controls are depicted in light gray. e, f Immunofluorescence staining of a representative CB for cTNT and α-actinin proteins (RAF1S257L).
Fig. 2
Fig. 2. Hypertrophy versus hyperplasia in iPSC-derived CMs.
a Illustration of mitotic cells stained with the mitotic marker phospho-Ser10-histone 3 (p-H3) in iPSCs and dissociated CBs at d40. As a positive control, proliferative human iPSCs were treated for 12 h with 100 nM nocodazole (NC) to be arrested in mitosis. CMs show no proliferative behavior as compared to iPSCs, which were arrested in mitosis by NC treatment. b Cell cycle analysis of iPSC untreated and treated with NC as well as CMs treated with 100 µM l-phenylephrine (PE). Cell cycle analysis indicates that NC-treated iPSCs are mainly captured in the G2/M phase and stained positive for p-H3. Where PE-treated CMs are arrested in G1. c Dissociated CMs at d40 were treated with PE for 7 days. Both treated and untreated CMs remain p‑H3 negative. d The cell surface area of the stained CMs with the cardiac marker of cTNT (−PE and +PE) were quantified with Image J software, which indicates the increased cell size in response to PE’s pro‑hypertrophic activity. *P < 0.05, unpaired 2-tail t-test. n = 2, biological replicates. CM cardiomyocytes, cTNT cardiac troponin T, iPSC induced pluripotent stem cells, PE phenylephrine, p-H3 phospho-histone 3, NC Nocodazole.
Fig. 3
Fig. 3. The effect of the RAF1S257L variant on the activity of selected effector kinases downstream of RAF1.
a Domain organization of RAF1 kinase with the typical functional domains, including the RAS-binding domain (RBD), the cysteine-rich domain (CRD), and the kinase domain. The adjacent sites of the S257L variant and the inhibitory S259 phosphorylation (p-S259) are highlighted. b Immunoprecipitation and quantification of total and p-RAF1S259 in WT and RAF1S257L iPSCs (line 1). Total RAF1 was immunoprecipitated from lysates of WT and RAF1S257L iPSCs using an anti-RAF1 specific antibody. IgG was applied as an isotype control. Immunoblotting was carried out using anti-RAF1 and anti-p-RAF1S259 antibodies. For quantification, signal intensities of p-RAF1S259 were divided by those for total RAF1. GAPDH was used as a loading control. TCL total cell lysate, IP immunoprecipitation, IgG immunoglobulin G. c Schematic diagram summarizing the signaling molecules investigated downstream of hypertrophic stimuli and RAF1. Proteins marked in blue letters were investigated at the protein level by immunoblotting. d Representative immunoblots of p-AKT vs. AKT, p-S6K vs. S6K, p-RAF1259 vs. RAF1, p-ERK1/2 vs. ERK1/2, p-YAP vs. YAP, p-p38 vs. p38, and p-JNK vs. JNK using cell lysates from WT- and RAF1S257-CBs (d24). e Phospho-protein vs. total protein ratio quantification as shown in (d). *P < 0.05, **P < 0.01, ***P < 0.001, ****P < 0.0001, unpaired 2-tail t-test. #P < 0.05, ##P < 0.01, unpaired 1-tail t-test. n = 3, biological replicates, except for p-38/p38 (n = 2). f Phospho-protein vs. total protein ratio quantification of western blot results for selected pathways in RAF1S257L-CBs vs. gene-corrected line, RAF1corr-CBs (d24). *P < 0.05, **P < 0.01, ***P < 0.001, unpaired 2-tail t-test. n = 3, biological replicates. g qPCR analysis of NPPB transcription levels. **P < 0.01, ****P < 0.0001, unpaired 2-tail t-test, n = 3, biological replicates. h ELISA analysis of pro-BNP levels released in the cell culture supernatant of CB’s (pg/ml). ***P < 0.001, ****P < 0.0001, unpaired 2-tail t-test. n = 8. Error bars for (eh): + SEM.
Fig. 4
Fig. 4. Aberrant RAF1S257L activity impairs the cytoarchitecture of human iPSC-derived cardiomyocytes.
a Dissociated WT- and RAF1S257L-CBs (line 1) were seeded on Geltrex-coated coverslips for 7 days and stained for cTNT and F-actin (Scale bar, 10 µm). b Representative EM images from RAF1S257L-CBs revealed stronger myofibrillar disarray accompanied by shortened I-bands and a thickened Z-line pattern as compared to WT-CBs. c IHC analysis of RAF1S257L cardiac tissues (CTs) from one of the NS individuals with RAF1 c.770C>T variant for desmin and troponin showed myofilament disarray. d Representative EM images of the same RAF1S257L-CTs as in C exhibited shortened I-bands and a thickened Z-line pattern consistent with RAF1S257L-CBs in (b). e Quantification of the cell size area of the CB-EM pictures with image J software. *P < 0.05, unpaired 2-tailed t-test. n = 2. f Representative ICC images of RAF1S257L and WT-CMs at d90 post-differentiation showed RAF1 co-localization with cTNT and F-actin at the sarcomere (Scale bar, 10 µm). g The quantifications of the organization and alignments of the sarcomeres in RAF1S257L- and WT-CMs at d90 post-differentiation stained with anti-cTNT antibody, Fig. 3f, with Sota software. n = 2. h EM images of RAF1S257L-CBs (d40) treated with 0.2 µM MEKi from d12 of differentiation.
Fig. 5
Fig. 5. Hyperactive RAF1S257L triggers a shorter I-band phenotype.
a Schematic view of the sarcomere organization. b IHC analysis of 8-µm cryosections bioartificial cardiac tissues (BCTs) from WT, gene-corrected, RAF1S257L, and RAF1S257L-treated with MEK inhibitor with PEVK segment of titin’s I-band, α-actinin as the Z-line marker, and DAPI for DNA staining. c A histogram of selected boxes on G was imported based on the intensity and overlaps of emitted fluorescent lights using the Zeiss LSM 880 Airyscan confocal microscope software. d Averaged distance (nm) between two adjacent PEVK segments was measured and statistically evaluated for more than 50 different sarcomere units for each condition (n = 35). ****P < 0.0001, unpaired 2-tailed t-test. e Averaged sarcomere length (nm) was measured for more than 50 different sarcomere units for each condition by measuring the distance between two parallel Z-lines (α-actinin) and statistically evaluated (n = 30). ****P < 0.0001, unpaired 2-tailed t-test. f qPCR analysis of the ratio of the N2B-to-N2BA titin isoforms expression levels in cardiac bodies (n = 2). *P < 0.05, **P < 0.01, unpaired 2-tailed t-test.
Fig. 6
Fig. 6. Abnormal expression of proteins involved in sarcomere function and calcium handling.
The experiments in A-F were conducted in cardiac bodies (CBs) of WT, RAF1S257L (line 1), and RAF1S257L-treated with 0.2 µM MEKi from d12 of differentiation. The data are averaged from three independent experiments in biological triplicates. *P < 0.05, **P < 0.01, ***P < 0.001, ****P < 0.0001, unpaired 2-tail t-test. n = 3, biological replicates. a qPCR analysis of mRNAs related to sarcomere proteins. b MYH7-to-MYH6 ratio. c qPCR analysis of mRNAs related to the regulation of calcium transients. d SERCA2a-to-PLN ratio obtained from qPCR data. e Immunoblot analysis of SERCA2, PLN, and p-PLNSer16 in CBs. f The ratio of SERCA2 to PLN was calculated by measuring the ratio of SERCA2 to PLN/p-PLNSer16 in western blotting. Error bars for ad, f: +SEM. gi Ca2+ transients were measured in Fura2-loaded dissociated CMs in 2D and expressed as the ratio of fluorescence emission at 340 and 380 nm. Bar graphs display the peak height of Ca2+ transients (g) and the velocities of cytosolic Ca2+ increase (h) and decrease (i). Each data point represents the average of 10 transients obtained from a single CM. Nine wild-type CMs (n = 9) and twelve RAF1S257L-CMs (n = 12) were analyzed in total.
Fig. 7
Fig. 7. Aberrant physiology of RAF1S257L-BCTs and their response to inhibition of MEK.
Measurements were conducted on days 27-28 of 3D tissue culture using isogenic RAF1corr, RAF1S257L, and RAF1S257L-BCTs + MEKi. a Quantification of cross-sectional areas of BCTs derived from the different genotypes and treatments. b Spontaneous beating frequencies at baseline (BL) and at the preload step, where the maximum contraction force was recorded for each BCT, i.e., at Lmax. c Maximum contraction forces of BCTs at Lmax at 1 Hz electrical pacing. d Maximum contractile tensions based on the cross-sectional areas of BCTs. Contraction kinetics at Lmax compared between e RAF1corr vs. RAF1S257L and f RAF1S257L vs. RAF1S257L + MEKi. Quantification of g time to peak of the contraction and h time to 80% relaxation at Lmax. Responses of BCT contractions to increasing calcium concentrations (range: 0.1–5 mM) in 5 mM glucose conditions normalized to contraction forces measured in high glucose (25 mM) medium compared between i RAF1corr vs. RAF1S257 and j RAF1corr vs. RAF1S257L + MEKi. k Quantification of normalized maximum contraction forces at 5 mM calcium under low glucose (5 mM) levels. ah: n = 14-26 individual tissue samples per group. ik n = 5–8 individual samples per group. Depending on the presence of normally distributed values, one-way ANOVA or Kruskal–Wallis test was applied. Error bars for ad and g, h: ±SD; Error bars for ej ±SEM. *P < 0.05, #P < 0.01, ***P < 0.001, ****P < 0.0001.
Fig. 8
Fig. 8. A proposed model of both RAF1-dependent cardiac signaling pathways, coupling calcium transients and contraction, and RAF1S257L-enhanced impairment of cardiac contraction, force generation, and calcium transients.
Due to critical ultrastructural defects in the sarcomere that impair the necessary flexibility components, which are crucial stress sensors, and localize relevant MAPK signaling proteins, the RAF1 mutant cardiomyocytes exhibit more MAPK signaling events. The above-mentioned events accompanied by the perturbation of the transcriptional profile of cardiomyocytes resulting from the hyperactivating mutation in RAF1 and further enhanced downstream signaling axes contribute to aberrant calcium transients through altered levels of SERCA and LTCC calcium transporters and PLN as suppressor of SERCA. While affected MYH6 and MYH7 compositions along with other variables contribute towards impaired contractility and force generation, the disease state is further fueled by massively increased pro-hypertrophic signals via NPPB/BNP.

References

    1. Pandit B, et al. Gain-of-function RAF1 mutations cause Noonan and LEOPARD syndromes with hypertrophic cardiomyopathy. Nat. Genet. 2007;39:1007–1012. doi: 10.1038/ng2073. - DOI - PubMed
    1. Razzaque MA, et al. Germline gain-of-function mutations in RAF1 cause Noonan syndrome. Nat. Genet. 2007;39:1013–1017. doi: 10.1038/ng2078. - DOI - PubMed
    1. Maron BJ, Maron MS. Hypertrophic cardiomyopathy. Lancet. 2013;381:242–255. doi: 10.1016/S0140-6736(12)60397-3. - DOI - PubMed
    1. Rezaei Adariani S, et al. Structural snapshots of RAF kinase interactions. Biochem. Soc. Trans. 2018;46:1393–1406. doi: 10.1042/BST20170528. - DOI - PubMed
    1. Desideri E, Cavallo AL, Baccarini M. Alike but different: RAF paralogs and their signaling outputs. Cell. 2015;161:967–970. doi: 10.1016/j.cell.2015.04.045. - DOI - PubMed

Publication types

MeSH terms

Substances