. 2023 Jun;618(7966):808-817.
doi: 10.1038/s41586-023-06172-8. Epub 2023 Jun 21.

Signalling by senescent melanocytes hyperactivates hair growth

Affiliations

Signalling by senescent melanocytes hyperactivates hair growth

Xiaojie Wang et al. Nature. 2023 Jun.

Abstract

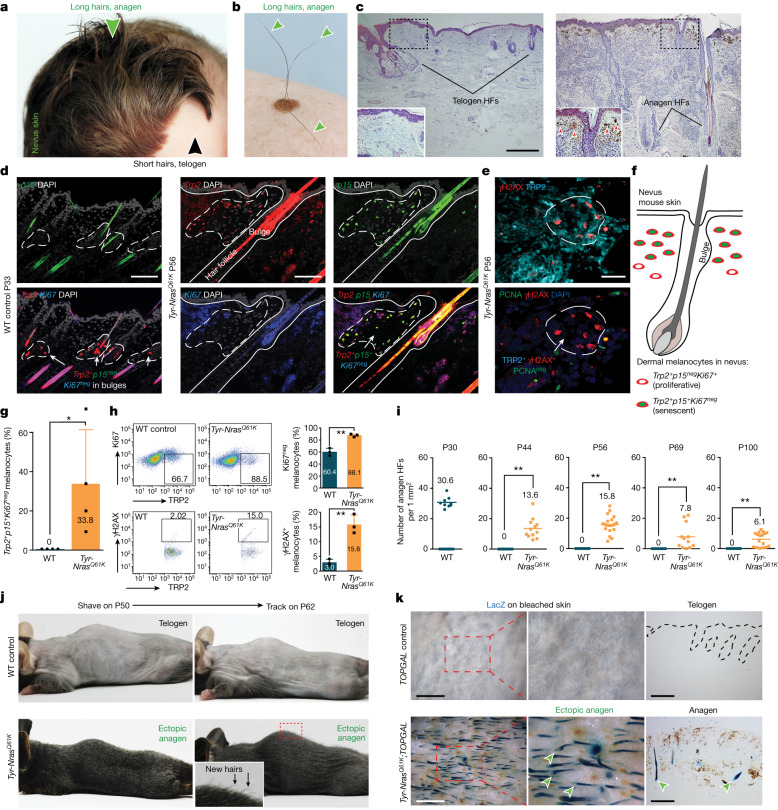
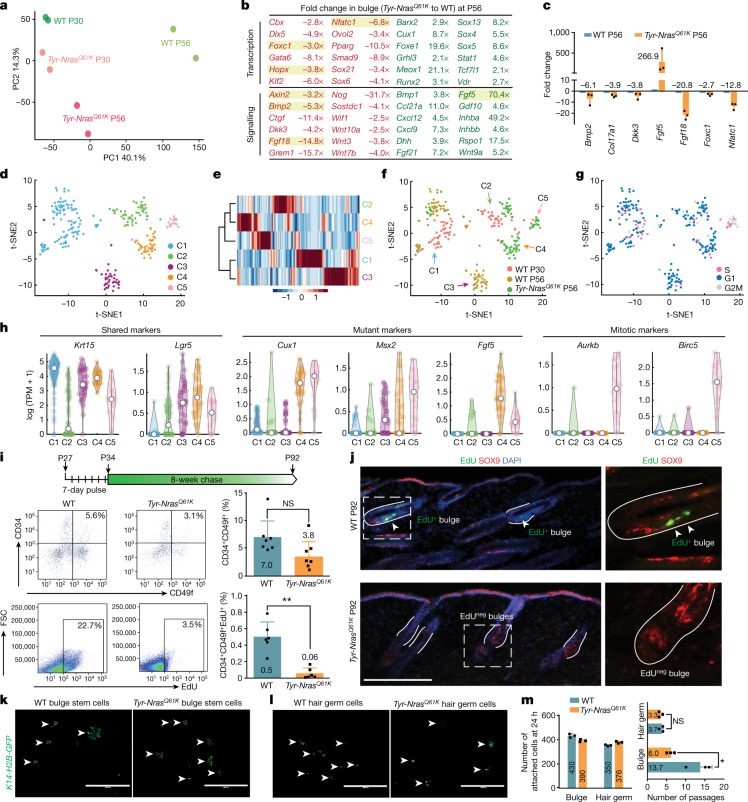
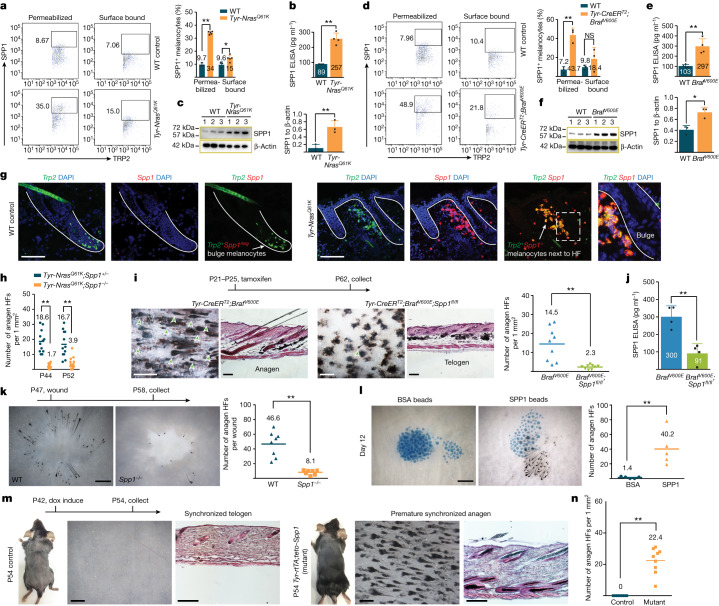
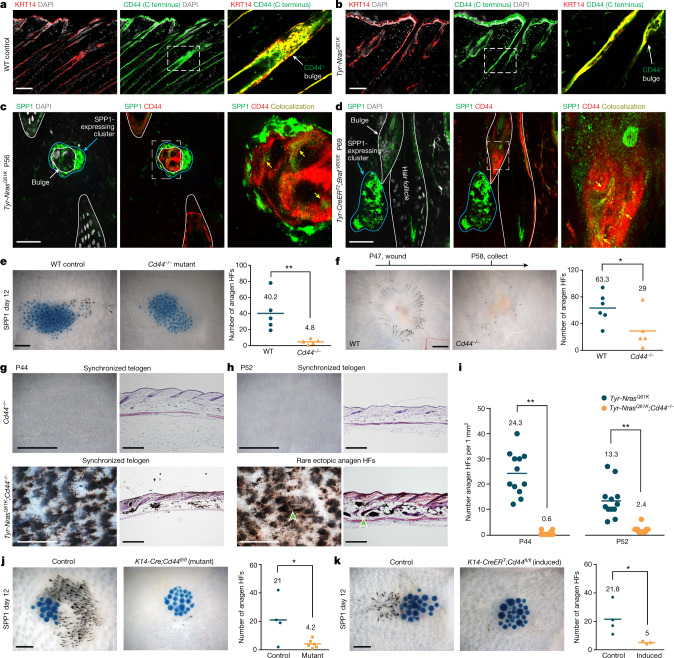
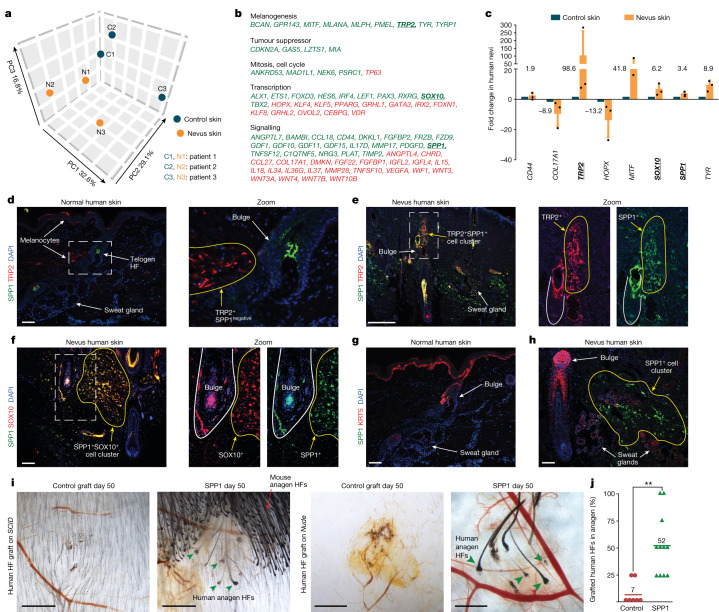
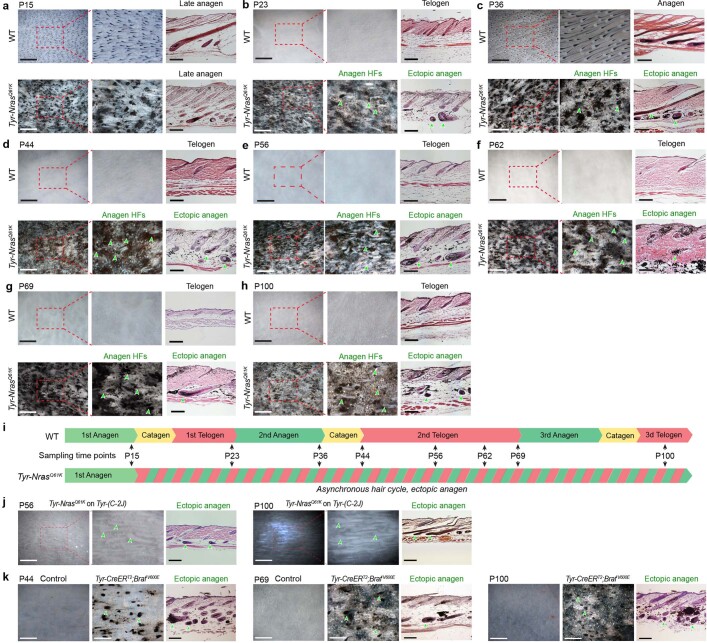
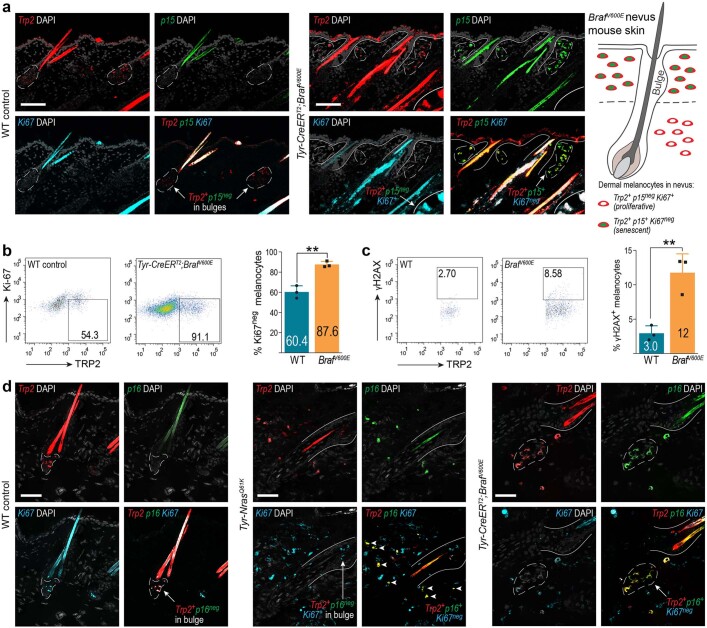
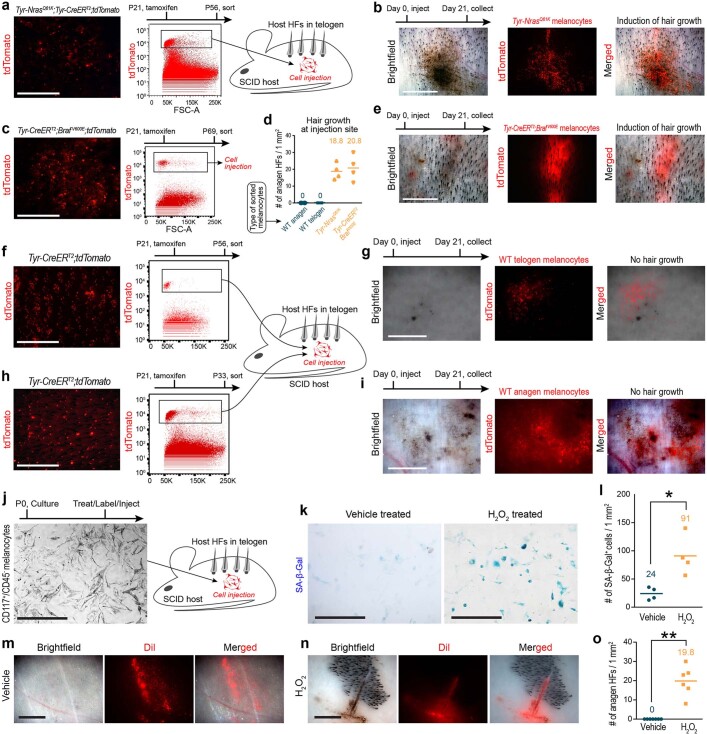
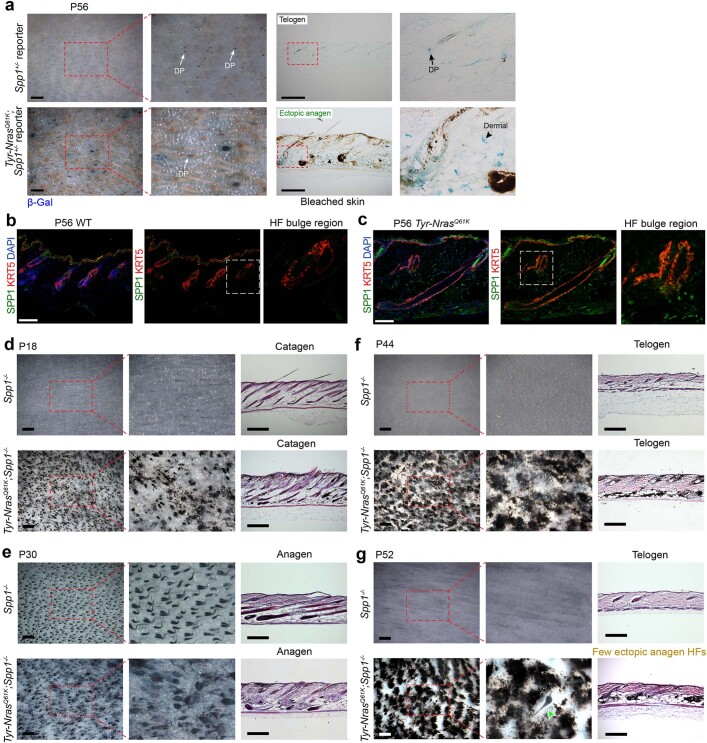
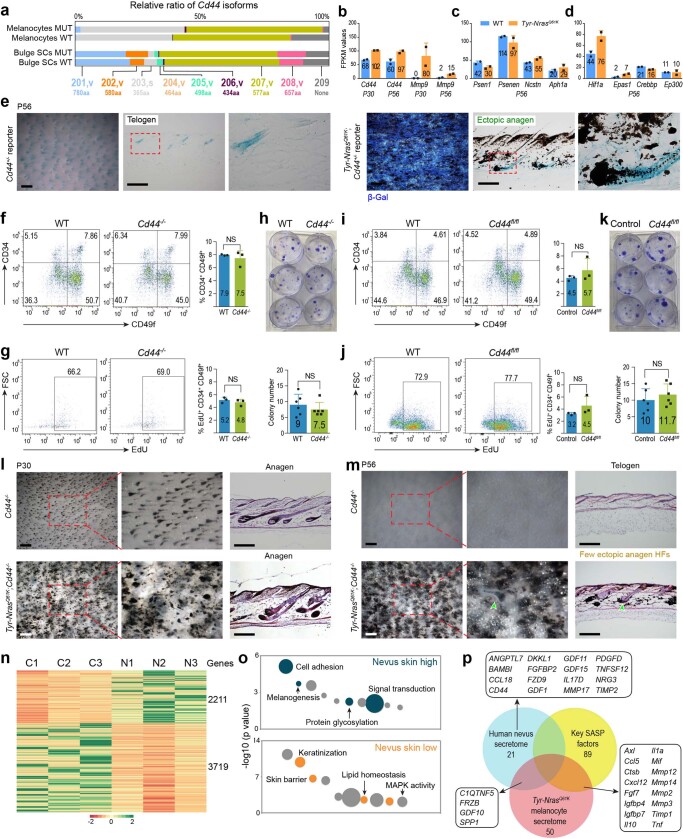
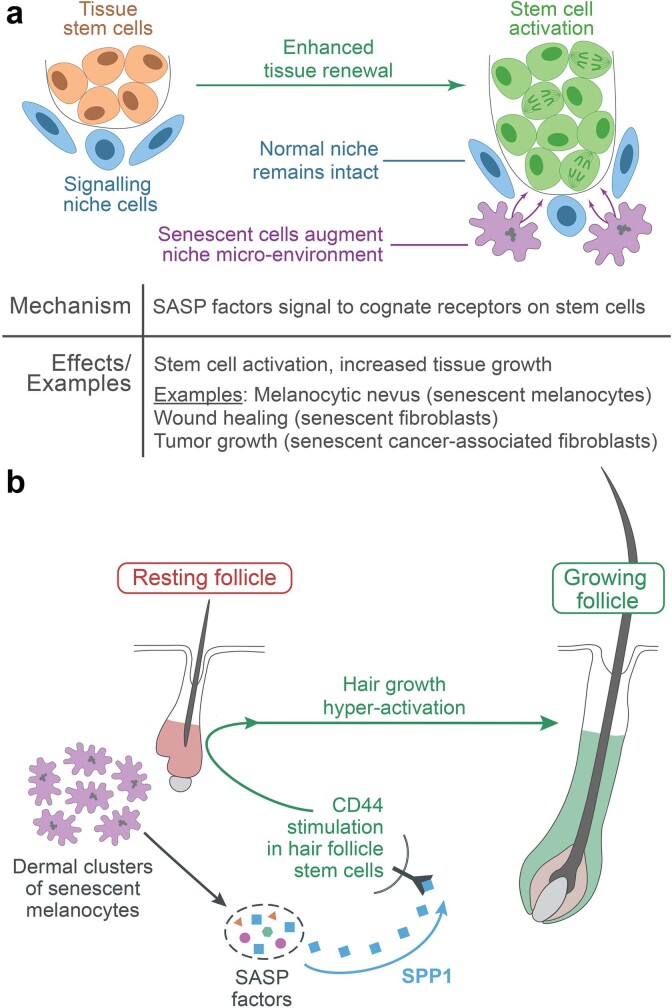
Niche signals maintain stem cells in a prolonged quiescence or transiently activate them for proper regeneration1. Altering balanced niche signalling can lead to regenerative disorders. Melanocytic skin nevi in human often display excessive hair growth, suggesting hair stem cell hyperactivity. Here, using genetic mouse models of nevi2,3, we show that dermal clusters of senescent melanocytes drive epithelial hair stem cells to exit quiescence and change their transcriptome and composition, potently enhancing hair renewal. Nevus melanocytes activate a distinct secretome, enriched for signalling factors. Osteopontin, the leading nevus signalling factor, is both necessary and sufficient to induce hair growth. Injection of osteopontin or its genetic overexpression is sufficient to induce robust hair growth in mice, whereas germline and conditional deletions of either osteopontin or CD44, its cognate receptor on epithelial hair cells, rescue enhanced hair growth induced by dermal nevus melanocytes. Osteopontin is overexpressed in human hairy nevi, and it stimulates new growth of human hair follicles. Although broad accumulation of senescent cells, such as upon ageing or genotoxic stress, is detrimental for the regenerative capacity of tissue4, we show that signalling by senescent cell clusters can potently enhance the activity of adjacent intact stem cells and stimulate tissue renewal. This finding identifies senescent cells and their secretome as an attractive therapeutic target in regenerative disorders.


Conflict of interest statement

M.V.P. is an inventor on a patent application filed by the University of California, Irvine describing the use of senescent secretome factors for promoting hair growth, among other claims. M.V.P. is also a co-founder and Chief Scientific Officer at the Amplifica Holdings Group, Inc. N.U.S. is employed by the Amplifica Holdings Group, Inc. All other authors declare no competing interests.

Figures

Fig. 1
Fig. 1. Hyperactivation of hair growth in nevus skin.
a,b, Hair growth (arrowheads) is enhanced within congenital (7-month old; a) and acquired (42-year old; b) melanocytic nevi in humans. c, Facial HFs that commonly remain in telogen in normal skin (left) activate and enter new anagen in nevus skin (right). The red arrowheads mark dermal melanin. d,f,g, Compared with P33 WT anagen skin, P56 Tyr-NrasQ61K skin contained clusters of Trp2+p15+Ki67neg melanocytes in the upper dermis. In g, n = 4; P = 0.0455668. e, P56 Tyr-NrasQ61K skin contained clusters of TRP2+γH2AX+PCNAneg dermal melanocytes. h, Compared with P30 WT anagen skin, P56 Tyr-NrasQ61K skin showed significantly increased numbers of TRP2+Ki67neg (n = 3; P = 0.0019135) and TRP2+γH2AX+ melanocytes on cytometry (n = 3; P = 0.0028236). ik, Tyr-NrasQ61K mice displayed enhanced hair growth. At all postnatal time points examined (also see Extended Data Fig. 1), Tyr-NrasQ61K skin contained many ectopic anagen HFs. Anagen HFs are quantified (i). In i, n = 9 at P30, n = 12 (P = 0.0000108) at P44, n = 21 (P = 0.0000000000183) at P56, n = 12 (P = 0.00329) at P69 and n = 17 (P = 0.0000239) at P100. In j, 12 days after shaving at P50, many new hairs grew in Tyr-NrasQ61K, but not in WT mice. In k, at P56, Tyr-NrasQ61K;TOPGAL mice, but not control TOPGAL mice, showed many lacZ+ anagen HFs (arrowheads). In gi, n refers to biologically independent samples. Data are mean ± s.d. P values were calculated using unpaired one-tailed (g,i) or two-tailed (h) Student’s t-test. *P ≤ 0.05 and **P ≤ 0.01. Scale bars, 20 μm (e), 100 μm (d), 500 μm (c), 1 mm (wholemount; k) and 200 μm (histology; k). The image in part a is reproduced with permission from S. Liber. Source data
Fig. 2
Fig. 2. Hair SCs within nevus skin lose quiescence.
a, On RNA-seq analysis, Tyr-NrasQ61K bulge SCs differ from P30 and P56 WT bulge SCs. A principal component analysis plot is shown. See Extended Data Fig. 6. b, A list of selected downregulated (red) and upregulated (green) genes at P56 and Tyr-NrasQ61K to WT fold change values. c, qRT–PCR of selected differentially expressed genes from a. n = 3. d, t-Distributed stochastic neighbour embedding (t-SNE) analysis on single-cell RNA-seq data for P30 and P56 WT and P56 Tyr-NrasQ61K bulge SCs. Cells form five clusters: C1 to C5. e, Cladogram showing relative cluster similarity. f, t-SNE plot colour-coded by sample source. g, t-SNE plot colour-coded by inferred cell cycle state. h, Violin plots for selected genes. See Extended Data Fig. 6. TPM, transcripts per million. i, EdU pulse-chase analysis on bulge SCs. Unlike total numbers of CD34+CD49f+ bulge SCs (top), their EdU+ label-retaining subset reduced significantly in Tyr-NrasQ61K versus control mice (bottom). n = 7 (P = 0.061857) for CD34+CD49f+ SCs and n = 6 (P = 0.0002048) for CD34+CD49f+EdU+ SCs. See Extended Data Fig. 7. FSC, forward scatter. j, Unlike WT, Tyr-NrasQ61K HFs from part i lacked EdU+SOX9+ bulge SCs (yellow). k,l, Attachment rates for the K14-H2B-GFP+ bulge (k) and hair germ (l) cells were compatible between WT and Tyr-NrasQ61K mice. Arrowheads mark cell colonies. m, Compared with WT, Tyr-NrasQ61K bulge SCs prominently reduced serial passaging potential, whereas it was unaltered for hair germ progenitor cells. n = 3 (P = 0.5185185) for hair germ cells and n = 3 (P = 0.0168963) for bulge cells. In c,i,m, n refers to independent experiments. P values were calculated using unpaired two-tailed Student’s t-test. Not significant (NS), P ≥ 0.05, *P ≤ 0.05 and **P ≤ 0.01. Scale bars, 100 μm (j) and 1 mm (k,l). Source data
Fig. 3
Fig. 3. Secretome of nevus melanocytes contains SPP1 that promotes hair growth.
a,d, On cytometry, SPP1 was increased in P56 Tyr-NrasQ61K (a) and P69 Tyr-CreERT2;BrafV600E (d) melanocytes. In a, for the permeabilized condition, n = 3 in WT and n = 5 in Tyr-NrasQ61K (P = 0.000000115); for the surface-bound condition, n = 3 in WT and n = 5 in Tyr-NrasQ61K (P = 0.0257). In d, for the permeabilized condition, n = 3 (P = 0.001397); for the surface-bound condition, n = 3 (P = 0.2888). See Extended Data Fig. 4. c,f, On western blot, SPP1 levels were increased in P56 Tyr-NrasQ61K (c) and P69 Tyr-CreERT2;BrafV600E (f) melanocytes. In c, n = 3; P = 0.00784. In f, n = 3; P = 0.0109. Uncropped gels are shown in Supplementary Fig. 1. b,e, On ELISA, SPP1 levels increased in day 5 cultures of P56 Tyr-NrasQ61K (b) and P69 Tyr-CreERT2;BrafV600E (e) melanocytes. In b, n = 3 in WT and n = 4 in Tyr-NrasQ61K; P = 0.00072. In e, n = 4; P = 0.00224. See Extended Data Fig. 4e. g, Unlike WT, Tyr-NrasQ61K skin contained Trp2+Spp1+ melanocytes adjacent to HF bulges. h, Anagen HF quantification in Tyr-NrasQ61K;Spp1−/− versus Tyr-NrasQ61K;Spp1+/− control mice. At P44, n = 12 in control and n = 14 in Tyr-NrasQ61K;Spp1−/− (P = 0.0000000191); at P56, n = 12 in control and n = 15 in Tyr-NrasQ61K;Spp1−/− (P = 0.0000195). i, Tyr-CreERT2;BrafV600E;Spp1fl/fl mice showed hair cycle quiescence rescue. Representative samples (left) and quantification (right) are displayed. n = 9; P = 0.000731. Arrowheads mark anagen HFs. j, On ELISA, SPP1 levels were reduced in day 5 cultures of Tyr-CreERT2;BrafV600E;Spp1fl/fl versus Tyr-CreERT2;BrafV600E melanocytes. n = 4; P = 0.00242. k, Spp1−/− mice showed reduced wound-induced hair growth. Representative samples (left) and quantification (right) are displayed. n = 8 in WT and n = 7 in Spp1−/−; P = 0.0000575. l, Unlike BSA-soaked beads (blue), SPP1-soaked beads induced anagen in WT skin 12 days after injection. Representative samples (left) and quantification (right) are displayed. n = 5; P = 0.00562. m,n, Unlike control, doxycycline (dox)-treated P54 Tyr-rtTA;tetO-Spp1 mice displayed premature anagen. Representative mice (m) and quantification (n) are displayed. In n, n = 9; P = 0.000000377. In b,c,e,f,j, n refers to independent experiments. In a,d,h,i,k,l,n, n refers to biologically independent samples. Data are mean ± s.d. P values were calculated using unpaired two-tailed Student’s t-test. NS, P ≥ 0.05, *P ≤ 0.05 and **P ≤ 0.01. Scale bars, 100 μm (g), 200 μm (histology; i,m) and 500 μm (wholemount; i,k,l,m). Source data
Fig. 4
Fig. 4. Effect of SPP1 on hair growth depends on CD44.
a,b, Epithelial HF cells in both WT control (a) and Tyr-NrasQ61K (b) mice strongly expressed CD44. Samples were also stained for the epithelial keratin marker KRT14. c,d, Co-staining for SPP1 and CD44 in Tyr-NrasQ61K (c) and Tyr-CreERT2;BrafV600E (d) skin revealed SPP1high clusters of dermal cells adjacent to CD44+ bulge cells with weaker colocalizing SPP1 signal (yellow arrows). e, Cd44−/− mice showed significantly reduced anagen activation in response to SPP1-soaked beads compared with WT mice. Representative samples (left) and quantification (right) are displayed. n = 5; P = 0.00938. f, Cd44−/− mice showed reduced wound-induced hair growth compared with WT mice. Representative samples (left) and quantification (right) are displayed. n = 6 in WT and n = 5 in Cd44−/−; P = 0.0494. g,h, Tyr-NrasQ61K;CD44−/− mice lacking Cd44 showed rescue of hair cycle quiescence. At P44, Tyr-NrasQ61K;Cd44−/− HFs were in coordinated telogen (g). Only rare anagen HFs (arrowheads) were present at P52 (h). i, Quantification of anagen HFs in Tyr-NrasQ61K versus Tyr-NrasQ61K;Cd44−/− mice. Double mutants showed reduced ectopic anagen at P44 and P52. At P44, n = 12 and P = 0.00000000249; at P56, n = 12 and P = 0.0000166. j,k, Both constitutive epithelial-specific K14-Cre;Cd44fl/fl (j) and tamoxifen-induced K14-CreERT;Cd44fl/fl (k) mice showed significantly reduced anagen activation in response to SPP1-soaked beads compared with control mice. Representative samples (left) and quantification (right) are displayed. In j, n = 4 in control and n = 6 in mutant; P = 0.0352. In k, n = 4 in control and n = 3 in induced mutant; P = 0.0476. In e,f,ik, n refers to biologically independent samples. P values are calculated using unpaired two-tailed Student’s t-test. *P ≤ 0.05 and **P ≤ 0.01. Scale bars, 50 μm (c,d), 100 μm (a,b), 200 μm (histology; g,h), 300 μm (j,k), 500 μm (e,f) and 1 mm (wholemount; g,h). Source data
Fig. 5
Fig. 5. Human nevi feature secretome enriched for SPP1.
a, Bulk RNA-seq reveals prominent differences between hairy nevi and adjacent normal facial skin in humans. A principal component analysis plot is shown. See Extended Data Fig. 9. b, Selected upregulated (by 2× or more; green) and downregulated (by 2× or more; red) differentially expressed genes in nevus versus normal human skin. Bold and underlined genes were validated by qRT-PCR. c, qRT–PCR of selected differentially expressed genes from bulk RNA-seq data. n = 3. d,e, SPP1 and TRP2 co-staining. In normal skin, TRP2+ melanocytes did not express SPP1 (d), whereas in nevus skin, clusters of TRP2+SPP1+ cells were seen next to HF bulge regions (e). f, SPP1 and SOX10 co-staining. Nevus skin contained SOX10+SPP1+ cell clusters next to HF bulge regions. g,h, SPP1 and KRT5 co-staining. Unlike in normal skin (g), SPP1+ cell clusters were seen next to HFs in nevus human skin (h). i,j, SPP1 microinjections induced precocious growth by human scalp HFs (arrowheads). Representative samples of human HFs on day 50 post-grafting (i) and quantification of human HFs in anagen (j) are shown. In j, n = 7 for control and n = 11 for SPP1; P = 0.00034. In c, n refers to independent experiments. In j, n refers to biologically independent samples. P values were calculated using unpaired two-tailed Student’s t-test. **P ≤ 0.01. Scale bars, 100 μm (dh) and 1 mm (i). Source data
Extended Data Fig. 1
Extended Data Fig. 1. Nevus mouse models exhibit ectopic hair growth.
a–h, At all postnatal time points examined, Tyr-NrasQ61K mice showed ectopic anagen HFs. In WT control mice, HFs are in first anagen at day P15 (a); in first telogen at P23 (b); in second anagen at P36 (c); in extended second telogen at P44 (d), P56 (e), P62 (f), P69 (g); and in third telogen at P100 (h). In contrast, at all of the above time points, Tyr-NrasQ61K skin contained many ectopic anagen HFs (green arrowheads). For each time point, representative wholemount (left) and histology samples (right) are shown. i, Schematic representation of the hair cycle state in WT control mice (top) and Tyr-NrasQ61K mice (bottom) at indicated time points (middle). Colors: green – anagen, yellow – catagen, red – telogen. j, Albino Tyr-NrasQ61K mice (crossed onto an albino Tyr(C-2J) background) maintain ectopic hair growth phenotype (green arrowheads) both at P56 (left) and P100 (right). For each time point, representative wholemount and histology samples are shown. k, Tyr-CreERT2;BrafV600E mice induced with tamoxifen at P2-4 formed nevi and exhibited ectopic hair growth. At all postnatal time points examined (P44, P69 and P100), dorsal skin in induced Tyr-CreERT2;BrafV600E mice contained many ectopic anagen HFs (green arrowheads). In contrast, HFs in induced control mice at the above time points were in telogen. For each time point, representative wholemount and histology samples (for Tyr-CreERT2;BrafV600E mice) are shown. Also, see Extended Data Fig. 4a,b. Scale bars, a–h, j (wholemount) – 1 mm; k (wholemount) – 500; a–h, j, k (histology) – 200 μm.
Extended Data Fig. 2
Extended Data Fig. 2. Nevus melanocytes but not normal melanocytes are sufficient to activate hair growth.
a, Compared to skin from control mice, skin from P69 Tyr-CreERT2;BrafV600E mice induced with tamoxifen at P21-25, contained clusters of Trp2+/p15+/Ki67neg melanocytes in upper dermis next to bulge regions of HFs. b, c, Compared to skin from control mice, skin from P69 Tyr-CreERT2;BrafV600E mice induced at P21-25, contained significantly more TRP2+/Ki67neg melanocytes (b) and TRP2+/γH2AX+ melanocytes (c). Left – representative cytometry plots, right – quantification. In b, n = 3; P = 0.00239. In c, n = 3; P = 0.00675. d, Compared to skin from control mice (left), skin from Tyr-NrasQ61K mice (center) and Tyr-CreERT2;BrafV600E mice (right) contained clusters of Trp2+/p16+/Ki67neg melanocytes in upper dermis next to bulge regions of HFs. In b, c, n = independent experiments. P values are calculated using unpaired two-tailed Student’s t-test. **P ≤ 0.01. Scale bars, d – 50 μm; a – 100 μm. Source data
Extended Data Fig. 3
Extended Data Fig. 3. Nevus melanocytes and senescent melanocytes stimulate new hair growth.
a–i, Melanocyte grafting experiments, in which melanocyte lineage cells were isolated as tdTomato+ cells from mice that contain Tyr-CreERT2 and tdTomato constructs, and that were induced with tamoxifen at P21. a–e, tdTomato+ melanocytes were isolated from P56 Tyr-NrasQ61K;Tyr-CreERT2;tdTomato (a) and P69 Tyr-CreERT2;BrafV600E;tdTomato nevus mouse skin (c) and injected into SCID mouse skin. Both types of mutant melanocytes (b, e) induced anagen after 21 days. f–i, Control melanocyte lineage cells were isolated from Tyr-CreERT2;tdTomato mice during telogen at P56 (f) and during anagen at P33 (h) and intradermally injected into telogen skin of SCID mice. Cells from both conditions (g, i) did not induce ectopic anagen 21 days after injection. Representative samples are shown in (b, e, g, i). Anagen HFs for experiments from (b, e, g, i) are quantified in (d). In d, n = 4. j–o, H2O2-induced senescence experiment (j). Senescent status of H2O2-treated melanocytes was confirmed with senescent β-Gal staining (k, l). H2O2-treated (n), but not control DiI-labeled melanocytes (m) induced anagen 21 days after injection into SCID mice. Anagen HFs are quantified in (o). In l, n = 4; P = 0.0112. In o, n = 7 in vehicle, n = 6 in H2O2; P = 0.000024. In d, l, o, n = biologically independent samples. P values are calculated using unpaired two-tailed Student’s t-test. *P ≤ 0.05, **P ≤ 0.01. Scale bars, m, n – 1 mm; a, b, c, e, f–i – 2 mm; j, k – 200 μm. Source data
Extended Data Fig. 4
Extended Data Fig. 4. Induction of nevi results in hair growth hyper-activation and osteopontin overexpression.
a-b, Compared to control, Tyr-CreERT2;BrafV600E mice induced with tamoxifen at P2-4, showed prominent hair growth. Representative P56 skin samples are shown in (a). Anagen HFs are marked in (a) and quantified in (b). In b, at P44 (n = 12 in control, n = 20 in mutant; P = 0.00218), at P56 (n = 12 in control, n = 21 in mutant; P = 0.00000000804), at P69 (n = 12 in control, n = 16 in mutant; P = 0.0000526), at P100 (n = 12 in control, n = 16 in mutant; P = 0.00000662). c, d, Following tamoxifen-induction at P21-25, Tyr-CreERT2;BrafV600E mice developed nevi by P44 and started to display ectopic hair growth from P56 onward. Representative wholemount and histology samples at five time points between P44-100 are shown in (c), and anagen HF density quantification is shown in (d). In d, n = 9. e, On ELISA, SPP1 levels became significantly higher in the supernatant from day 5 cultures of primary sorted Tyr-CreERT2;BrafV600E melanocytes at five indicated timepoints from P56 onward. Data from P69 cells is also shown in main Fig. 3e. In e, at P44 (n = 4; P = 0.2686), at P56 (n = 4; P = 0.0000269), at P62 (n = 4; P = 0.003095), at P69 (n = 4; P = 0.00224), at P100 (n = 4; P = 0.0035). f-i, On cytometry, SPP1 levels in permeabilized cells (f, h) as well as surface-bound SPP1 levels in non-permeabilized cells (g, i) were significantly higher in melanocytes from induced Tyr-CreERT2;BrafV600E mice (pBraf, sBraf) compared to wild type control mice (pWT, sWT) at indicated time points. Representative cytometry plots are shown in (f, g) and quantification is show in (h, i). Data from P69 cells is also shown in main Fig. 3d. In h, at P44 (n = 3 for pWT, n = 4 for pBraf; P = 0.000318), at P56 (n = 3; P = 0.0000533), at P62 (n = 3; P = 0.00426), at P69 (n = 3; P = 0.001397), at P100 (n = 3 for pWT, n = 4 for pBraf; P = 0.00000386). In i, at P44 (n = 3; P = 0.0531), at P56 (n = 3; P = 0.0912), at P62 (n = 3; P = 0.2495), at P69 (n = 3; P = 0.291), at P100 (n = 3; P = 0.00399). j–k, Cytometry of permeabilized (j) and non-permeabilized melanocytes (k) showed significantly higher levels of SPP1 compared to isotype control both in Tyr-NrasQ61K mice (pNras, sNras) and Tyr-CreERT2;BrafV600E mice (pBraf, sBraf). Representative cytometry plots are shown on the left and quantification on the right of j and k. In j, for pNras (n = 3; P = 0.00000175), for pBraf (n = 3; P = 0.00000213). In k, for sNras (n = 3; P = 0.00297), for sBraf (n = 3; P = 0.000000536). l, Skin of P69 Tyr-CreERT2;BrafV600E mice contained Trp2+/Spp1+ melanocytes in upper dermis adjacent to bulge regions of HFs. In b, d, n = biologically independent samples. In e, h, i, j, k, n = independent experiments. Data are mean ± s.d. P values are calculated using unpaired one-tailed (in b at P56) or two-tailed (in b at P44, P69, P100, e, h, i, j, k) Student’s t-test. NS, P ≥ 0.05, *P ≤ 0.05, **P ≤ 0.01. Scale bars, a (wholemount) – 1 mm; c (wholemount) – 300 μm; c (histology) – 200 μm; a (histology), l – 100 μm. Source data
Extended Data Fig. 5
Extended Data Fig. 5. Effect of ABT-737 treatment and non-nevus melanocyte expansion on hair cycle.
a-b, Unlike vehicle, subcutaneous ABT-737 treatment of Tyr-NrasQ61K mice at P10 and P12 decreased fur pigmentation and reduced anagen HFs at P56 (a). Anagen HFs are quantified in (b). In b, n=21; P = 0.0000454. c-e, Effect of ABT-737 treatment on melanocytes, bulge stem cells and hair cycle status. c, On cytometry at P56, the percentage of TRP2+/Annexin V+ melanocytes in Tyr-NrasQ61K mice significantly increased in response to ABT-737 treatment at P10-12. In c, n = 5; P = 0.0001816. d, On cytometry at P56, the abundance of CD34+/CD49f+ bulge stem cells in Tyr-NrasQ61K mice was unchanged by ABT-737 treatment at P10-12. In d, n = 5; P = 0.7891838. e, ABT-737 treatment at P10-12 did not affect normal anagen timing in WT mice – skin from both vehicle and ABT-737 treated animals contained HFs in anagen at P33. In e, n = 7; P = 0.2898739. In (c, d, e) representative data is shown on the left, and data quantification – on the right. f–j, Mice with non-nevus expansion in melanocytes display normal hair cycle timing. f–i, Similar to control mice, K14-Edn3 mice with dermal melanocyte expansion (f, g) and K14-Kitl mice with epidermal melanocyte expansion (h, i) were in synchronized anagen at P36 (f, h) and synchronized telogen at P56 (g, i). j, After tamoxifen induction at P12-14, Tyr-CreER;p53fl/fl mice with melanocyte-specific deletion of p53, did not form nevi and exhibited telogen HFs at P56, analogous to induced control mice. In b, n = biologically independent samples. In c, d, e n = independent experiments. Data are mean ± s.d. P values are calculated using unpaired two-tailed Student’s t-test. NS, P ≥ 0.05, *P ≤ 0.05, **P ≤ 0.01. Scale bars, f–j (wholemount) – 1 mm; a, f–j (histology) – 200 μm; e – 100 μm. Source data
Extended Data Fig. 6
Extended Data Fig. 6. Gene expression patterns in Tyr-NrasQ61K HFs stem cells.
a–b, Tyr-NrasQ61K telogen HFs maintain normal expression patterns of bulge and hair germ markers. Co-immunostaining for CD34 (red) and Pcad (green) showed that their expression pattern in Tyr-NrasQ61K telogen HFs (b) is consistent with that in WT telogen HFs (a). Bulge cells are CD34+ and Pcadlow, while hair germ (HG) cells are CD34neg and Pcadhigh. c–d, RNA-seq analysis on WT and Tyr-NrasQ61K bulge SCs. Venn diagrams and DEGs heatmap are shown in (c). Venn diagrams identify 21 downregulated and 104 upregulated genes specific to Tyr-NrasQ61K. Bubble charts in (d) show enriched (red) and depleted (green) GO terms in P56 WT bulge SCs, and enriched GO terms in Tyr-NrasQ61K bulge SCs (blue). e–j, Gene expression patterns in bulge stem cells on single-cell RNA-seq. Cell clusters are color-coded according to main Fig. 2d and are as follows: C1 – inner bulge cells, present in P30 and P56 WT samples and in P56 Tyr-NrasQ61K sample; C2 – anagen-specific outer bulge cells, present in P30 WT and P56 Tyr-NrasQ61K samples; C3 – telogen-specific outer bulge cells, present in P56 WT sample; C4 and C5 – outer bulge cells specific to Tyr-NrasQ61 sample. Violin plots are shown with normalized expression values along the Y-axis. e, Expression patterns of outer bulge markers, showing enrichment in clusters C2, C3 and C4. f, Expression patterns of telogen-phase outer bulge markers, showing enrichment in cluster C3. g, Expression patterns of inner bulge markers, showing enrichment in cluster C1. h, Expression patterns of anagen-phase enriched markers. i, Expression patterns of mutant-enriched markers in cluster C4. j, Expression patterns of mutant-enriched markers in cluster C5. Scale bars, a, b – 100 μm.
Extended Data Fig. 7
Extended Data Fig. 7. Characterization of bulge stem cells and melanocytes in nevus mouse models.
a, b, Labeling efficiency of bulge stem cells after 7 days of EdU pulse was consistent between WT control and Tyr-NrasQ61K mice. Representative cytometry plots (left) and data quantification (right) are shown for all CD34+/CD49f+ bulge stem cells in (a) and for their CD34+/CD49f+/EdU+ subset in (b). In a, n = 3; P = 0.63929124. In b, n = 3; P = 0.23549636. c-f, On RNA-seq, P56 Tyr-NrasQ61K melanocytes differ from P30 and P56 WT melanocytes. PCA is shown in (c) and DEGs heatmap in (d). Secretome factors upregulated in Tyr-NrasQ61K melanocytes and Tyr-NrasQ61K/WT fold change values are shown in (e). Bubble chart showing enriched GO terms in Tyr-NrasQ61K melanocytes are shown in (f). Selected bubbles are colored and annotated. g, qRT-PCR validation of selected differentially expressed genes from bulk RNA-seq data on melanocytes. In g, n = 3. h, Venn diagram showing the degree of overlap between the P56 Tyr-NrasQ61K melanocyte transcriptome and published in vitro human senescent melanocyte secretome (blue, 68%) and core in vitro SASP factors (green, 71%). i, Compared to skin from wild type control mice (left), skin from Tyr-NrasQ61K mice (middle) and induced Tyr-CreERT2;BrafV600E mice (right) contained clusters of Trp2+/Aurkb+ melanocytes in upper dermis next to bulge regions of HFs. In a, b, n = independent experiments. Data are mean ± s.d. P values are calculated using unpaired two-tailed Student’s t-test. NS, P ≥ 0.05. Scale bars, i – 100 μm. Source data
Extended Data Fig. 8
Extended Data Fig. 8. Changes in expression and the effect of osteopontin deletion in Tyr-NrasQ61K skin.
a-c, Osteopontin expression is increased in Tyr-NrasQ61K skin. a, Spp1 reporter activity was increased in Tyr-NrasQ61K skin. LacZ staining (blue) on Tyr-NrasQ61K;Spp1+/− vs. control Spp1+/− P56 reporter mouse skin showed broad increase in LacZ+ cells. Dermal and dermal papilla (DP) expression sites are marked. For each panel, representative wholemount and histology samples are shown on the left and on the right, respectively. b–c, Co-immunostaining for KRT5 (red) and SPP1 (green) in P56 WT control (b) and Tyr-NrasQ61K skin (c). Tyr-NrasQ61K skin showed prominently increased SPP1 expression in the dermal compartment, including around bulge regions of HFs (inserts). d-g, Osteopontin deletion rescues hair cycle quiescence in Tyr-NrasQ61K mice. Tyr-NrasQ61K;Spp1−/− mice showed rescue of hair cycle quiescence. Unlike Tyr-NrasQ61K mice (see Extended Data Fig. 1), Tyr-NrasQ61K;Spp1−/− mice showed synchronized catagen at P18 (d), synchronized anagen at P30 (e), synchronized telogen at P44 (f) and largely synchronized telogen P52 (g). For each time point, representative Spp1-/- control and Tyr-NrasQ61K;Spp1-/- mutant skin samples are shown. Wholemount samples are shown on the right and histology on the left of each panel. Scale bars, b, c – 100 μm; a, d–g (wholemount) – 500 μm; a, d–g (histology) – 200 μm.
Extended Data Fig. 9
Extended Data Fig. 9. Expression and the effect of Cd44 deletion on hair growth.
a-e, Expression of Cd44 and related genes. a, Relative abundance of Cd44 isoforms established from full-length bulk RNA-seq. Isoforms are numbered using conventional nomenclature and indicated along the X-axis. Cd44v isoforms are designated with “v” and Cd44s isoform with “s”. Skin cell types are listed along the Y-axis. WT – wild type cells, MUT – Tyr-NrasQ61K mutant cells. Bulge stem cells are enriched for Cd44v isoforms 201, 202, 205 and 208. b, Cd44 is prominently expressed on bulk RNA-seq in bulge stem cells from WT control (blue) and Tyr-NrasQ61K mice (orange) both at P30 and P56. Mmp9, direct downstream target of CD44-ICD signalling is prominently overexpressed in Tyr-NrasQ61K bulge stem cells both at P30 and P56. c, Expression values of γ-secretase complex genes in P56 WT and Tyr-NrasQ61K bulge stem cells. d, Expression values of transcription factors mediating CD44-ICD signalling in P56 WT and Tyr-NrasQ61K bulge stem cells. Average FPKM values are shown on b–d. In b-d, n = 2. e, LacZ staining (blue) in Tyr-NrasQ61K;Cd44+/− vs. control Cd44+/− P56 reporter mice showed LacZ+ cells in the skin, both in epithelial and dermal compartments. For each panel, wholemount and histology samples are shown on the left and on the right, respectively. f-m, Effects of Cd44 deletion on bulge stem cells and hair cycle status in nevus mice. f, Total abundance of CD34+/CD49f+ bulge stem cells remained unchanged in germline Cd44-/- mice vs. WT control mice. In f, n = 3; P = 0.52. g, Labeling efficiency of bulge stem cells after 7 days of EdU pulse remained unchanged in germline Cd44-/- mice vs. WT control mice. In g, n = 3; P = 0.401. In (f, g) representative cytometry plots are shown on the left, and data quantification on the right. h, In in vitro culture assay on FACS-isolated bulge stem cells, clonogenic potential of CD34+/CD49f+ cells remained unchanged in germline Cd44−/− mice vs. WT control mice. Top – representative culture plates, bottom – data quantification. In h, n = 6; P = 0.384. i, Total abundance of CD34+/CD49f+ bulge stem cells remained unchanged in epithelial-specific conditional K14-Cre;Cd44fl/fl (aka Cd44fl/fl) mice vs. control mice. In i, n = 3; P = 0.328. j, Labeling efficiency of bulge stem cells after 7 days of EdU pulse remained unchanged in Cd44fl/fl mice vs. control mice. In j, n = 3; P = 0.218. In (i, j) representative cytometry plots are shown on the left, and data quantification on the right. k, In in vitro culture assay on FACS-isolated bulge stem cells, clonogenic potential of CD34+/CD49f+ cells remained unchanged in Cd44fl/fl mice vs. control mice. Top – representative culture plates, bottom – data quantification. In k, n = 6; P = 0.411. l, m, Tyr-NrasQ61K;Cd44−/− mice showed rescue of hair cycle quiescence. Unlike Tyr-NrasQ61K mice (see Extended Data Fig. 1), Tyr-NrasQ61K;Cd44−/− animals showed synchronized anagen at P30 (l) and only very occasional ectopic anagen HFs at P56 (m). For both time points, representative Cd44−/− control and Tyr-NrasQ61K;Cd44−/− mutant skin samples are shown. Wholemount samples are shown on the right and histology on the left of each panel. n–o, Bulk RNA-seq between hairy nevi and adjacent normal facial skin in humans. DEGs heatmap is shown in (n), bubble chart with enriched (blue) and depleted (orange) GO terms in human nevi is shown in (o). p, Comparisons of human nevus secretome (blue) with Tyr-NrasQ61K mouse melanocyte secretome (red) and published in vitro SASP (yellow). In b–d, f–k, n = independent experiments. Data are mean ± s.d. P values are calculated using unpaired two-tailed Student’s t-test. NS, P ≥ 0.05. Scale bars, e, l, m (wholemount) – 500 μm; e, l, m (histology) – 200 μm. Source data
Extended Data Fig. 10
Extended Data Fig. 10. Model of senescent cell-induced hair growth in skin nevus.
a, Limited accumulation of senescent cells adjacent to normal, intact stem cell niche can augment it and result in stem cell activation. Mechanism, effects, and examples are listed below the schematic drawing. Tissue stem cells – orange (quiescent) and green (activated); normal niche cells – blue; senescent cells – purple. b, Schematic representation of the mechanism driving hair growth hyperactivation in skin nevus. Dermal clusters of senescent melanocytes (purple) secrete SASP factors (colored geometric shapes). SPP1 (blue squares) is the leading SASP factor of senescent melanocytes. It signals via CD44 receptor (black Y shape) to epithelial stem cells in adjacent hair follicles, inducing them into precocious growth (green arrow).

References

    1. Scadden DT. Nice neighborhood: emerging concepts of the stem cell niche. Cell. 2014;157:41–50. doi: 10.1016/j.cell.2014.02.013. - DOI - PMC - PubMed
    1. Pawlikowski JS, et al. Wnt signaling potentiates nevogenesis. Proc. Natl Acad. Sci. USA. 2013;110:16009–16014. doi: 10.1073/pnas.1303491110. - DOI - PMC - PubMed
    1. Michaloglou C, et al. BRAFE600-associated senescence-like cell cycle arrest of human naevi. Nature. 2005;436:720–724. doi: 10.1038/nature03890. - DOI - PubMed
    1. Campisi J. Aging, cellular senescence, and cancer. Annu. Rev. Physiol. 2013;75:685–705. doi: 10.1146/annurev-physiol-030212-183653. - DOI - PMC - PubMed
    1. Hsu YC, Fuchs E. A family business: stem cell progeny join the niche to regulate homeostasis. Nat. Rev. Mol. Cell Biol. 2012;13:103–114. doi: 10.1038/nrm3272. - DOI - PMC - PubMed

Publication types