. 2023 Jun 21;6(1):116.
doi: 10.1038/s41746-023-00859-y.

Deep-learning-enabled brain hemodynamic mapping using resting-state fMRI

Affiliations

Deep-learning-enabled brain hemodynamic mapping using resting-state fMRI

Xirui Hou et al. NPJ Digit Med. .

Abstract

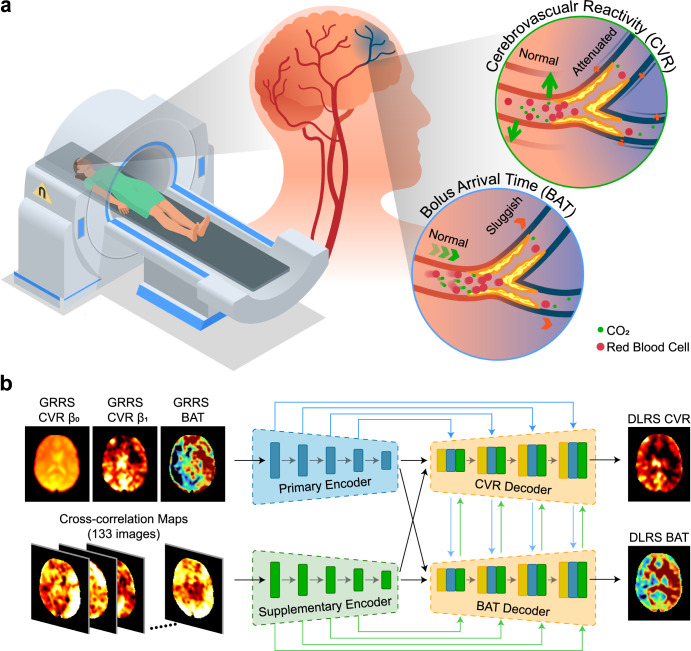
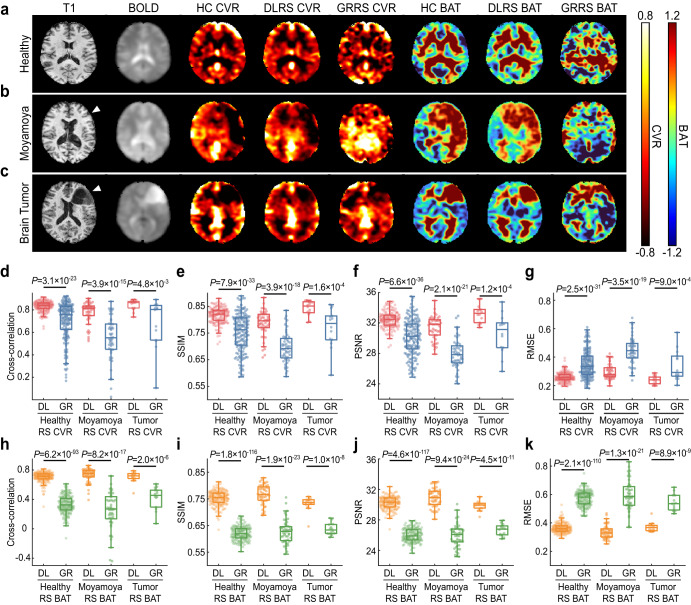
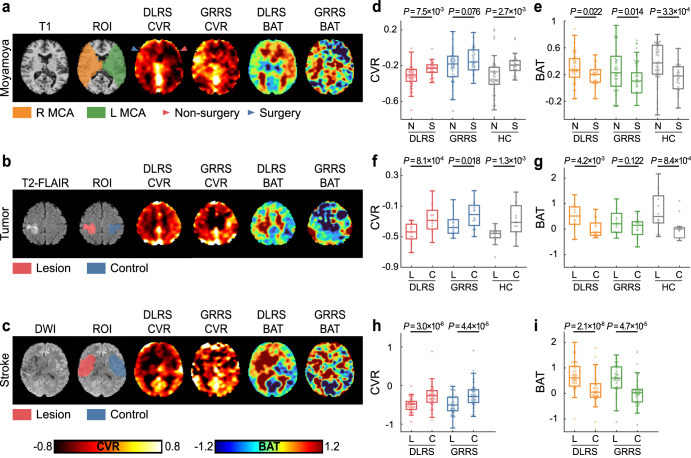
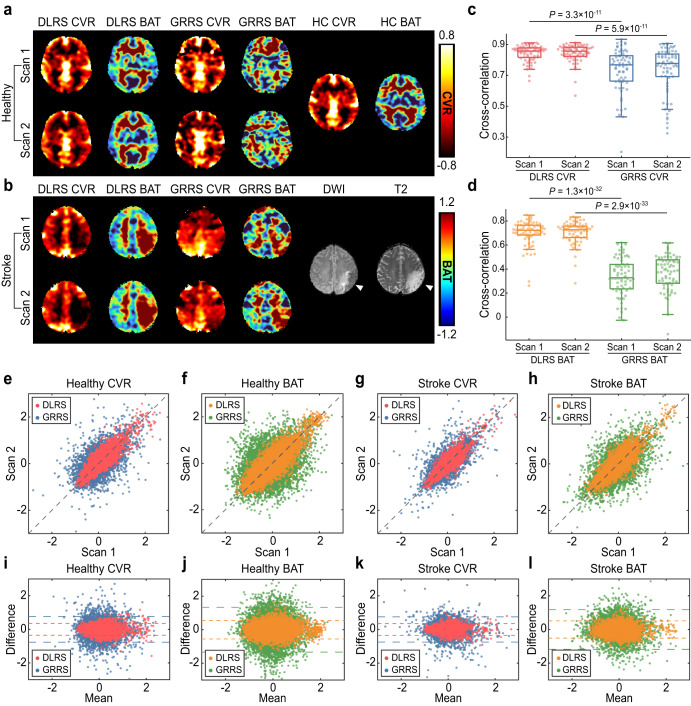
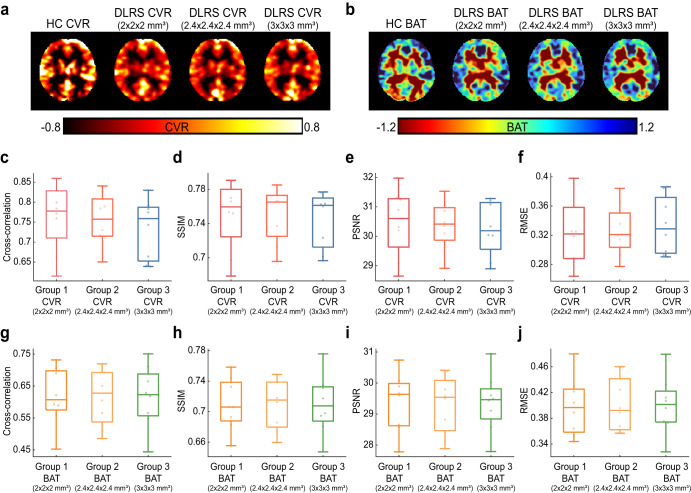
Cerebrovascular disease is a leading cause of death globally. Prevention and early intervention are known to be the most effective forms of its management. Non-invasive imaging methods hold great promises for early stratification, but at present lack the sensitivity for personalized prognosis. Resting-state functional magnetic resonance imaging (rs-fMRI), a powerful tool previously used for mapping neural activity, is available in most hospitals. Here we show that rs-fMRI can be used to map cerebral hemodynamic function and delineate impairment. By exploiting time variations in breathing pattern during rs-fMRI, deep learning enables reproducible mapping of cerebrovascular reactivity (CVR) and bolus arrival time (BAT) of the human brain using resting-state CO2 fluctuations as a natural "contrast media". The deep-learning network is trained with CVR and BAT maps obtained with a reference method of CO2-inhalation MRI, which includes data from young and older healthy subjects and patients with Moyamoya disease and brain tumors. We demonstrate the performance of deep-learning cerebrovascular mapping in the detection of vascular abnormalities, evaluation of revascularization effects, and vascular alterations in normal aging. In addition, cerebrovascular maps obtained with the proposed method exhibit excellent reproducibility in both healthy volunteers and stroke patients. Deep-learning resting-state vascular imaging has the potential to become a useful tool in clinical cerebrovascular imaging.


Conflict of interest statement

The authors declare no competing interests.

Figures

Fig. 1
Fig. 1. Overview of MRI experiment and deep-learning network used in this work.
a An illustration of MRI experiment to measure brain hemodynamic function. Spontaneous fluctuations in breathing pattern during resting-state MRI result in changes in CO2 level in the arterial blood. This CO2 change can be used as an intrinsic marker for the estimation of cerebrovascular reactivity (CVR) and bolus arrival time (BAT) using deep-learning network. b Architecture of the deep-learning network. An encoder-decoder network was used, where primary and supplementary features of the image series were analyzed, and then fused to generate the outcome measures of resting-state CVR and BAT maps.
Fig. 2
Fig. 2. Representative images and quantitative results of the deep-learning resting-state cerebrovascular reactivity (DLRS CVR) and bolus arrival time (DLRS BAT).
ac Representative images from a healthy volunteer (a), Moyamoya disease patient (b), brain tumor patient (c). From left to right, the images are T1-weighted anatomic images, raw BOLD images, hypercapnic (HC) CVR, DLRS CVR, global-regression resting-state (GRRS) CVR, HC BAT, DLRS BAT and GRRS BAT. dg The boxplots display the similarity between resting-state CVR maps and ground-truth HC CVR maps. Two types of resting-state CVR maps were studied: the proposed DLRS CVR and an existing GRRS CVR. Four similarity indices were studied, including Pearson cross-correlation (d), structure similarity index metric (SSIM) (e), peak signal-to-noise ratio (PSNR) (f), root-mean-square error (RMSE) (g). The line within the boxplots represents the median, the box represents the interquartile range (IQR), and the whiskers are 1.5 times the IQR. hk the boxplots display the similarity between resting-state BAT maps and ground-truth HC BAT maps.
Fig. 3
Fig. 3. The performance of deep-learning resting-state cerebrovascular reactivity (DLRS CVR) and bolus arrival time (DLRS BAT) in detecting brain pathologies.
a A patient with Moyamoya disease who suffered from bilateral stenosis with the right hemisphere undergoing a revascularization surgery. Lower CVR and longer BAT can be seen in the non-surgical hemisphere. From left to right, the images are T1-weighted image, the middle cerebral artery (MCA) perfusion ROIs, DLRS CVR, global-regression resting-state cerebrovascular reactivity (GRRS) CVR, DLRS BAT and GRRS BAT. b A diffuse astrocytoma patient with T2-FLAIR image, the lesion/control ROIs, DLRS CVR, GRRS CVR, DLRS BAT and GRRS BAT. c A stroke patient with diffusion-weighted image (DWI) image, the lesion/control ROIs, DLRS CVR, GRRS CVR, DLRS BAT and GRRS BAT. d, e The boxplots of CVR and BAT data in Moyamoya patients, when comparing their values between the surgically revascularized (S) hemispheres and the non-surgery (N) hemispheres. The line, box, and whiskers in the boxplots represent the median, the interquartile range (IQR), and 1.5 times the IQR, respectively. The effect sizes of two groups of DLRS CVR, GRRS CVR and HC CVR were 0.65, 0.42, and 0.73, respectively. The effect size of DLRS BAT, GRRS BAT and HC BAT were −0.55, −0.59, and −0.89. f, g The boxplots of CVR and BAT data in brain tumor patients, when comparing between lesion (L) and contralateral control (C) areas. Tumor regions revealed a lower CVR and a longer BAT. The effect sizes of two groups of DLRS CVR, GRRS CVR, HC CVR, DLRS BAT, GRRS BAT, and HC BAT were 1.16, 0.72, 1.10, −0.93, −0.44, and −1.15, respectively. As can be seen, DLRS parameters showed a larger effect size than the existing GRRS method. h, i The boxplots of CVR and BAT data in stroke patients, when comparing values between lesion (L) and contralateral control (C) areas. The effect sizes of group comparisons were 0.89, 0.75, −1.15, and −0.75 for DLRS CVR, GRRS CVR, DLRS BAT and GRRS BAT, respectively. DLRS parameters generally showed a larger effect size than the GRRS method.
Fig. 4
Fig. 4. Reproducibility of deep-learning resting-state cerebrovascular reactivity (DLRS CVR) and bolus arrival time (DLRS BAT).
a A test-retest example from a healthy participant. The participant underwent two resting-state MRI runs in the same session. From left to right, DLRS CVR, and DLRS BAT, global-regression resting-state cerebrovascular reactivity (GRRS) CVR, and GRRS BAT, hypercapnic (HC) CVR and HC BAT. b A test-retest example from a stroke participant. The patient underwent two resting-state MRI runs in two sessions. From left to right, DLRS CVR, DLRS BAT, GRRS CVR, GRRS BAT, diffusion-weighted image (DWI) and T2-weighted image. c In healthy participants, boxplots display Pearson cross-correlation between DLRS CVR and HC CVR, together with those between GRRS CVR and HC CVR. The line, box, and whiskers in the boxplots represent the median, the interquartile range (IQR), and 1.5 times the IQR, respectively. d In healthy participants, boxplots show Pearson cross-correlation between DLRS BAT and HC BAT, together with those between GRRS BAT and HC BAT. e, f Scatter plots between two repeated scans for CVR and BAT across 133 ROIs in healthy participants. Each plot displayed data from both DLRS and GRRS methods. g, h Scatter plots between two repeated scans for CVR and BAT in stroke patients. il Bland-Altman plots of the CVR and BAT results in healthy participants and stroke patients.
Fig. 5
Fig. 5. A representative example and quantitative metrics of deep-learning resting-state cerebrovascular reactivity (DLRS CVR) and bolus arrival time (DLRS BAT) at different spatial resolutions.
a, b, Representative DLRS CVR (a) and DLRS BAT (b) maps collected using 2 × 2 × 2 mm3, 2.4 × 2.4 × 2.4 mm3, and 3 × 3 × 3 mm3 BOLD protocols from a healthy volunteer. cf Boxplots illustrating similarity between DLRS CVR maps and HC CVR maps, including Pearson cross-correlation (c), structure similarity index metric (SSIM) (d), peak signal-to-noise ratio (PSNR) (e), root-mean-square error (RMSE) (f). In the boxplots, the line shows the median, the box indicates the interquartile range (IQR), and the whiskers stretch to 1.5 times the IQR. gj Similarity indices used to compare between DLRS BAT and HC BAT maps.

References

    1. Barker, P. B., Golay, X. & Zaharchuk, G. Clinical Perfusion MRI: Techniques and Applications (Cambridge University Press, 2013).
    1. Mandell DM, et al. Intracranial vessel wall MRI: principles and expert consensus recommendations of the American Society of Neuroradiology. Am. J. Neuroradiol. 2017;38:218–229. doi: 10.3174/ajnr.A4893. - DOI - PMC - PubMed
    1. Collaborators GBD. Global, regional, and national burden of stroke and its risk factors, 1990-2019: a systematic analysis for the Global Burden of Disease Study 2019. Lancet Neurol. 2021;20:795–820. doi: 10.1016/S1474-4422(21)00252-0. - DOI - PMC - PubMed
    1. Liu PY, De Vis JB, Lu HZ. Cerebrovascular reactivity (CVR) MRI with CO2 challenge: a technical review. Neuroimage. 2019;187:104–115. doi: 10.1016/j.neuroimage.2018.03.047. - DOI - PMC - PubMed
    1. Lv YT, et al. Identifying the perfusion deficit in acute stroke with resting-state functional magnetic resonance imaging. Ann. Neurol. 2013;73:136–139. doi: 10.1002/ana.23763. - DOI - PubMed