. 2023 Aug;20(8):955-968.
doi: 10.1038/s41423-023-01052-7. Epub 2023 Jun 21.

Mannosylated glycans impair normal T-cell development by reprogramming commitment and repertoire diversity

Affiliations

Mannosylated glycans impair normal T-cell development by reprogramming commitment and repertoire diversity

Manuel M Vicente et al. Cell Mol Immunol. 2023 Aug.

Abstract

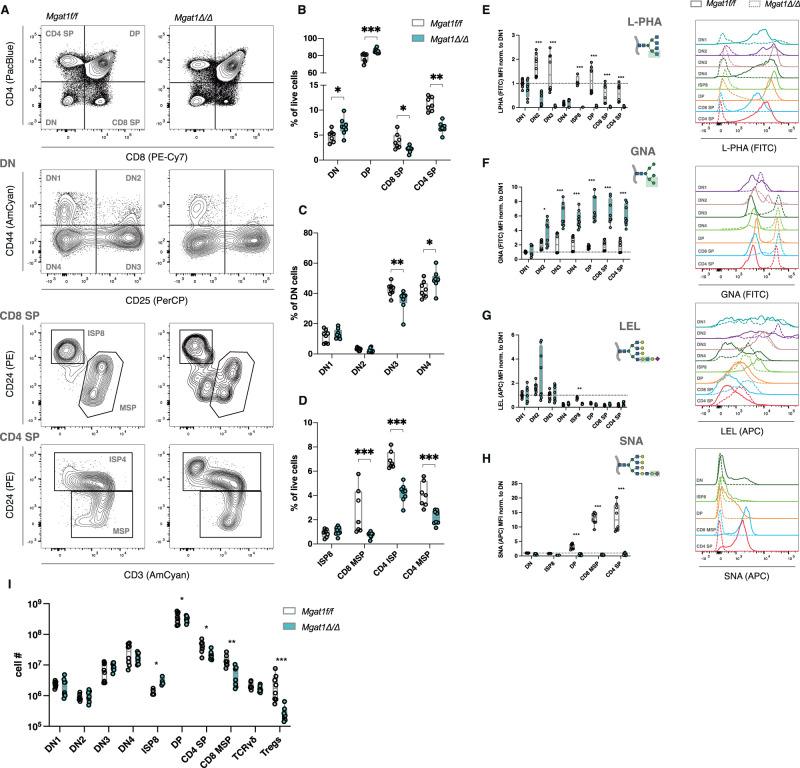
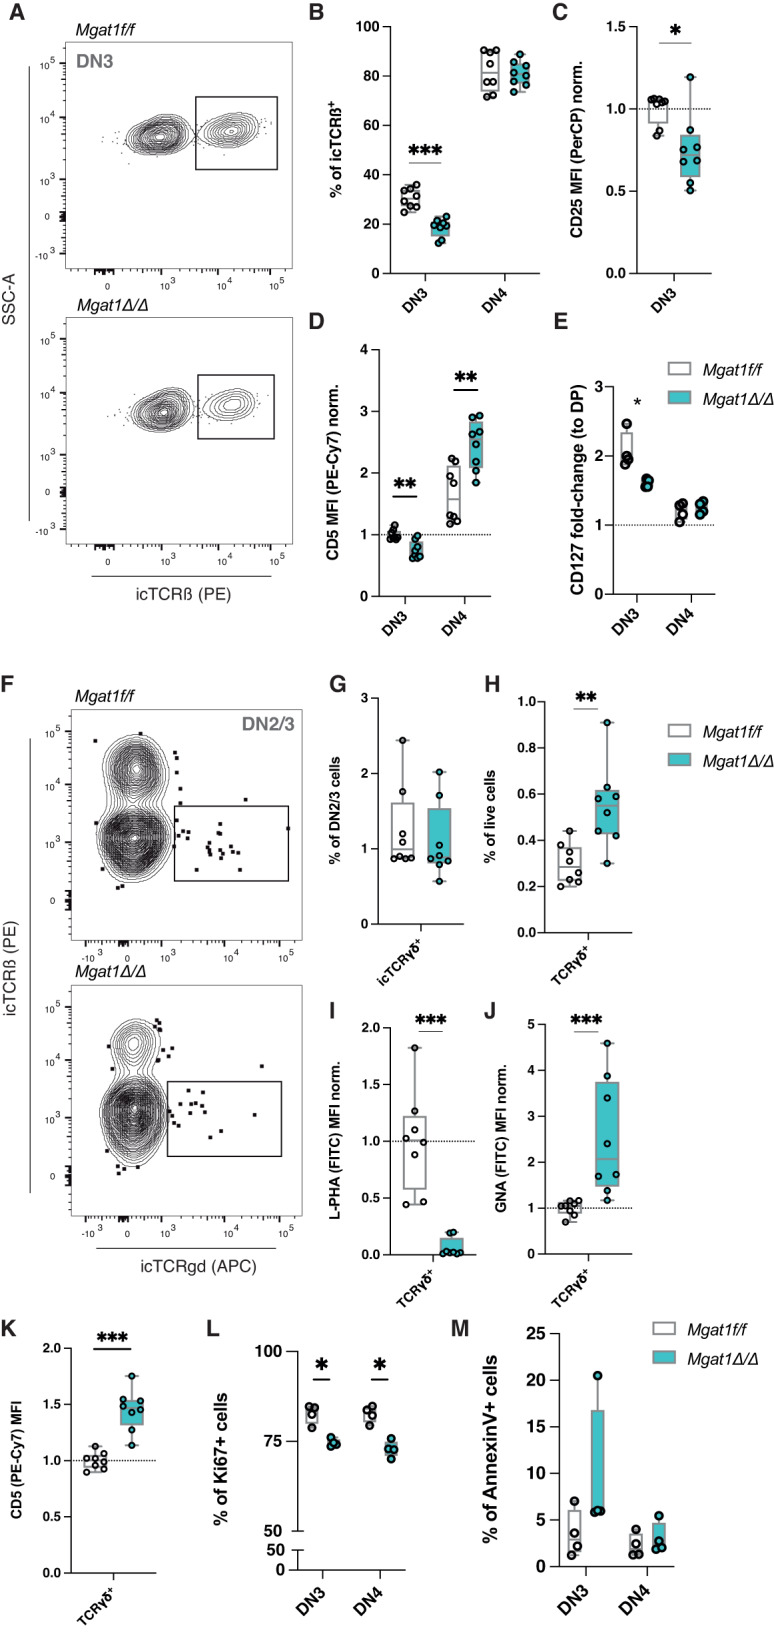
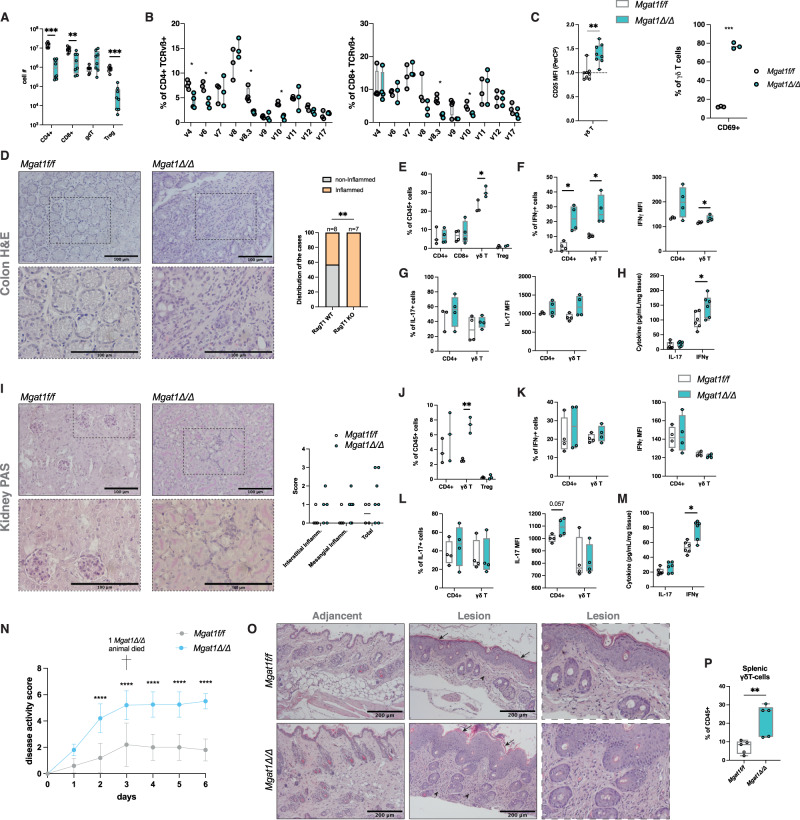
T-cell development ensures the formation of diverse repertoires of T-cell receptors (TCRs) that recognize a variety of antigens. Glycosylation is a major posttranslational modification present in virtually all cells, including T-lymphocytes, that regulates activity/functions. Although these structures are known to be involved in TCR-selection in DP thymocytes, it is unclear how glycans regulate other thymic development processes and how they influence susceptibility to disease. Here, we discovered stage-specific glycome compositions during T-cell development in human and murine thymocytes, as well as dynamic alterations. After restricting the N-glycosylation profile of thymocytes to high-mannose structures, using specific glycoengineered mice (Rag1CreMgat1fl/fl), we showed remarkable defects in key developmental checkpoints, including ß-selection, regulatory T-cell generation and γδT-cell development, associated with increased susceptibility to colon and kidney inflammation and infection. We further demonstrated that a single N-glycan antenna (modeled in Rag1CreMgat2fl/fl mice) is the sine-qua-non condition to ensure normal development. In conclusion, we revealed that mannosylated thymocytes lead to a dysregulation in T-cell development that is associated with inflammation susceptibility.

Keywords: Glycocalyx; Inflammation; N-glycosylation; T-cell development; Thymocytes.


Conflict of interest statement

The authors declare no competing interests.

Figures

Fig. 1
Fig. 1
The human and murine T-cell developmental stages exhibit differential glycan profiles. A Scheme of the isolation of thymocytes from both human (N = 4) and murine (N = 8, 8 weeks old) thymi and subsequent workflow. B Major Golgi-localized steps of the N-glycosylation pathway, GlcNAc antennae formation, elongation and termination. Boxes indicate the specific lectin-binding glycans. C–F Histograms of lectin staining for major human thymocyte populations (top), median fluorescence intensity (MFI) quantifications normalized for the mean DN levels (middle) and heatmap of the mean rank differences showing the Kruskal‒Wallis test multiple comparisons between populations, presented as “population in line” vs. “population in column” (bottom), for L-PHA (C), SNA (D), GNA (E) and LEL (F). As an example for heatmap interpretation, comparison between L-PHA levels of CD8 SP and ISP4 shows a blue color, indicating a negative mean rank difference, i.e., ISP4 levels of L-PHA are lower than those of CD8 SP. G Analysis of MGAT5, ST6GAL1, B3GNT2 and B4GALT1 in a human thymocyte single-cell RNA sequencing dataset [16]. H–K Histograms of lectin staining for major murine thymocyte populations (top), median fluorescence intensity (MFI) quantifications normalized for the mean DN levels (middle) and heatmap of the mean rank differences showing the Kruskal‒Wallis test multiple comparisons between populations, presented as “population in line” vs. “population in column” (bottom), for L-PHA (H), SNA (I), GNA (J) and LEL (K). Kruskal‒Wallis test, q value * < 0.05, ** < 0.005, *** < 0.001. L Analysis of Mgat5, St6gal1, B3gnt2 and B4galt1 in a human thymocyte single-cell RNA sequencing dataset [16]
Fig. 2
Fig. 2
Impairment of T-cell development in high-mannose-restricted thymocytes. A Thymocyte population discrimination in Mgat1f/f mice (N = 8, 6–8 weeks old) and Mgat1Δ/Δ mice (N = 8, 6–8 weeks old). B Frequencies of DN, DP, CD8 SP and CD4 SP subsets within live cells. C Frequencies of DN1, DN2, DN3 and DN4 subsets within the total DN population. D CD8 SP and CD4 SP subset frequencies: ISP8, CD8 MSP, CD4 ISP and CD4 MSP within live cells. E–H Levels of lectin binding (MFI levels) normalized to the indicated population (left) and representative histograms of lectin binding profiles in the indicated thymocyte subsets for L-PHA (E), GNA (F), LEL (G) and SNA (H). I Absolute numbers of cells within the indicated populations. Each dot represents one mouse in all graphs. Mann‒Whitney t-test, p value * < 0.05, ** < 0.005 and *** < 0.001
Fig. 3
Fig. 3
Lack of complex-branched N-glycans impairs ß-selection without affecting the determination of γδ T cells. A Gating strategy for the identification of ß-selected (icTCRß+) DN3 cells and (B) frequencies of those cells in DN3 and DN4 subsets in Mgat1f/f (N = 8) and Mgat1Δ/Δ mice (N = 8). C Quantification of CD25 surface levels (MFI) in the DN3 subset normalized to the mean of Mgat1f/f DN3 levels. D Quantification of CD5 and (E) CD127 surface levels (MFI) in DN3 and DN4 thymocytes normalized to the mean of Mgat1f/f DN3 levels and CD127 DP levels, respectively. F Gating strategy for the identification of icTCRγδ + cells within the DN2/3 subset and (G) frequencies in Mgat1f/f (N = 8) and Mgat1Δ/Δ mice (N = 8). H Frequency of total thymic mature TCRγδ + cells within live cells. I Levels of L-PHA and (J) GNA binding levels in thymic TCRγδ + cells normalized to the mean Mgat1f/f levels. K CD5 surface levels (MFI) of TCRγδ + cells, normalized to the mean Mgat1f/f levels. L Quantification of Ki67+ cell frequencies within the DN3 and DN4 populations. M Quantification of apoptotic cells (Annexin V + ) within the DN3 and DN4 populations. Each dot represents one mouse. Mann‒Whitney t-test, p value * < 0.05, ** < 0.005 and *** < 0.001
Fig. 4
Fig. 4
TCR-selection is impaired in the high-mannose restricted N-glycome, with severe effects on TCR repertoire diversity and thymic Treg generation. A Distribution of each selection subset, preselection, postpositive selection and postnegative selection thymocytes, according to the CD4 and CD8 expression levels, and quantification in Mgat1f/f (N = 8) and Mgat1Δ/Δ mice (N = 8). B Inverse Sympson index of CD4 SP and CD8 SP TCRvß repertoires. C Visualization of clone proportions: most frequent 10 (top 10) – expanded clones; 11–100th most frequent – medium clones; other clones – small clones. D Top 10 clone accumulative frequencies of CD4 SP and CD8 SP. E Top 10 clone frequencies (bars) and treemap visualization showing clone distributions, where each colored box represents the abundance of each clone by its size, colored by V-genes (each color is assigned randomly and does not match between the samples). F Distribution according to each detected Vß region in CD4 SP and (G) CD8 SP mature thymocytes. H Levels of L-PHA binding (MFI) in wild-type thymic CD4 SP CD25-FOXP3- and Treg populations. I Quantification of the frequency of FoxP3+ cells in the DP population. J Frequencies of subsets within CD4 SP thymocytes. K Identification of CD62L+ cells in mature CD4 SP and CD8 SP cells in Mgat1 WT (N = 4) and Mgat1 cKO (N = 4) and Mgat2 WT (N = 4) and Mgat2 cKO (N = 4) mice. Each dot represents one mouse. Mann‒Whitney t-test, p value * < 0.05, ** < 0.005 and *** < 0.001
Fig. 5
Fig. 5
Impairments in T-cell development induced by the absence of complex N-glycans lead to peripheral alterations in homeostasis. A Splenic T-cell numbers in Mgat1f/f (N = 8) and Mgat1Δ/Δ (N = 8). B Screening of TCRvß+ expressing cells in splenic mature CD4+ (right) and CD8 + T cells (right) in Mgat1f/f (N = 4) and Mgat1Δ/Δ (N = 4). C Levels of CD25 surface expression (MFI) in splenic γδ T cells, normalized to the mean Mgat1f/f levels, and the quantification of CD69+ cells within this subset. D H&E staining of colon sections at ×20 (top) and ×40 magnification (bottom) and specimen distribution according to overall detection of inflammation cues (right). Scale bars indicate 100 µm. E T-cell population frequencies within CD45+ cells isolated from colon tissues. F Frequencies of IFNγ-producing cells within CD4+ and γδ T cells and IFNγ expression (MFI) in the same subsets. G Frequencies of IL-17-producing cells within CD4+ and γδ T cells and IL-17 expression (MFI) in the same subsets. H IL-17 and IFNγ concentrations in colon explant culture supernatants normalized to tissue weight. I PAS staining of colon sections at ×20 (top) and ×40 magnification (bottom) and scores of interstitial and mesangial inflammation (right). Scale bars indicate 100 µm. J T-cell population frequencies within CD45+ cells isolated from kidney tissues. K Frequencies of IFNγ-producing cells within CD4+ and γδT cells and IFNγ expression (MFI) in the same subsets. L Frequencies of IL-17-producing cells within CD4+ and γδT cells and IL-17 expression (MFI) in the same subsets. M IL-17 and IFNγ concentrations in colon explant culture supernatants normalized to tissue weight. N Disease activity score for the imiquimod-induced psoriasis model for Mgat1f/f (N = 5 females) and Mgat1Δ/Δ (N = 5 females) mice. O Representative histological analysis of the skin of these mice from lesion-adjacent and lesion tissue. Arrows highlight epithelial thickening, and arrowheads highlight immune infiltrate. P Quantification of splenic γδT cells on the final day of the experiment. Each dot represents one mouse. Mann‒Whitney t-test, p value * < 0.05, ** < 0.005 and *** < 0.001

References

    1. Koch U, Radtke F. Mechanisms of T Cell Development and Transformation. Annu Rev Cell Dev Biol. 2011;27:539–62. doi: 10.1146/annurev-cellbio-092910-154008. - DOI - PubMed
    1. Takaba H, Takayanagi H. The Mechanisms of T Cell Selection in the Thymus. Trends Immunol. 2017;38:805–16. doi: 10.1016/j.it.2017.07.010. - DOI - PubMed
    1. Starr TK, Jameson SC, Hogquist KA. Positive and Negative Selection of T Cells. Annu Rev Immunol. 2003;21:139–76. doi: 10.1146/annurev.immunol.21.120601.141107. - DOI - PubMed
    1. Pereira MS, Alves I, Vicente M, Campar A, Silva MC, Padrao NA, et al. Glycans as Key Checkpoints of T Cell Activity and Function. Front Immunol. 2018;9:7842–13. doi: 10.3389/fimmu.2018.02754. - DOI - PMC - PubMed
    1. Pinho SS, Reis CA. Glycosylation in cancer: mechanisms and clinical implications. Nat Rev Cancer. 2015;15:540–55. doi: 10.1038/nrc3982. - DOI - PubMed

Publication types