. 2023 Jun 22;56(1):33.
doi: 10.1186/s40659-023-00446-1.

Human VDAC pseudogenes: an emerging role for VDAC1P8 pseudogene in acute myeloid leukemia

Affiliations

Human VDAC pseudogenes: an emerging role for VDAC1P8 pseudogene in acute myeloid leukemia

Xena Giada Pappalardo et al. Biol Res. .

Abstract

Background: Voltage-dependent anion selective channels (VDACs) are the most abundant mitochondrial outer membrane proteins, encoded in mammals by three genes, VDAC1, 2 and 3, mostly ubiquitously expressed. As 'mitochondrial gatekeepers', VDACs control organelle and cell metabolism and are involved in many diseases. Despite the presence of numerous VDAC pseudogenes in the human genome, their significance and possible role in VDAC protein expression has not yet been considered.

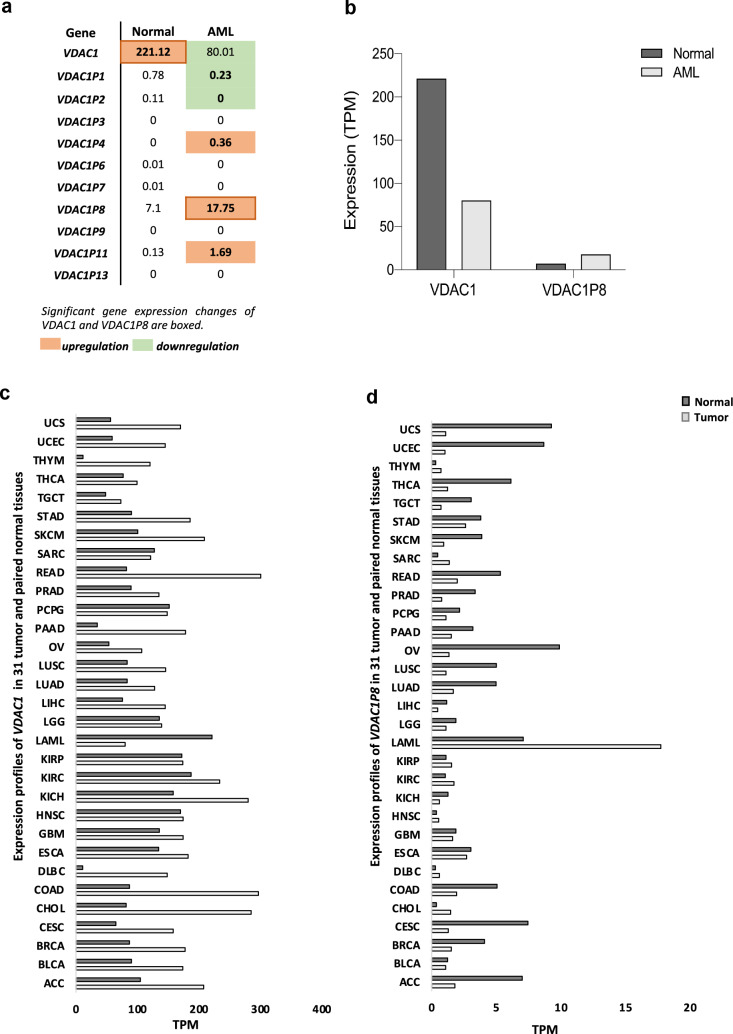
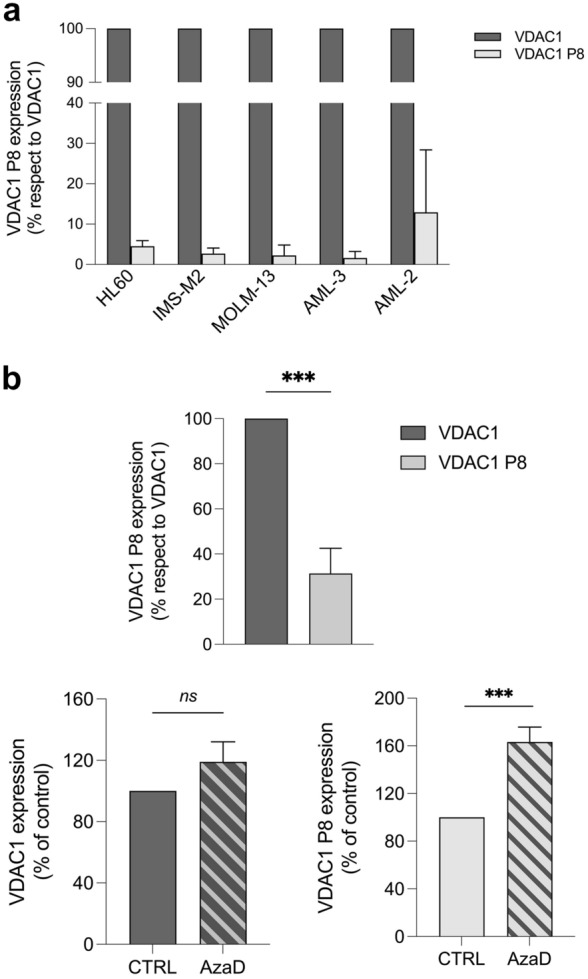
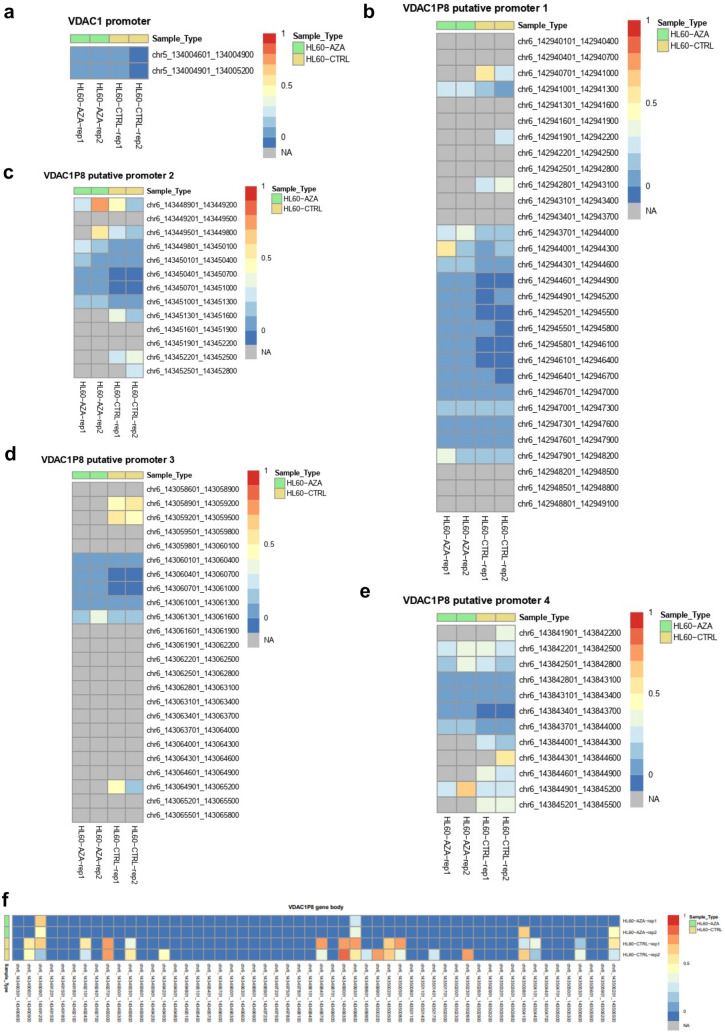
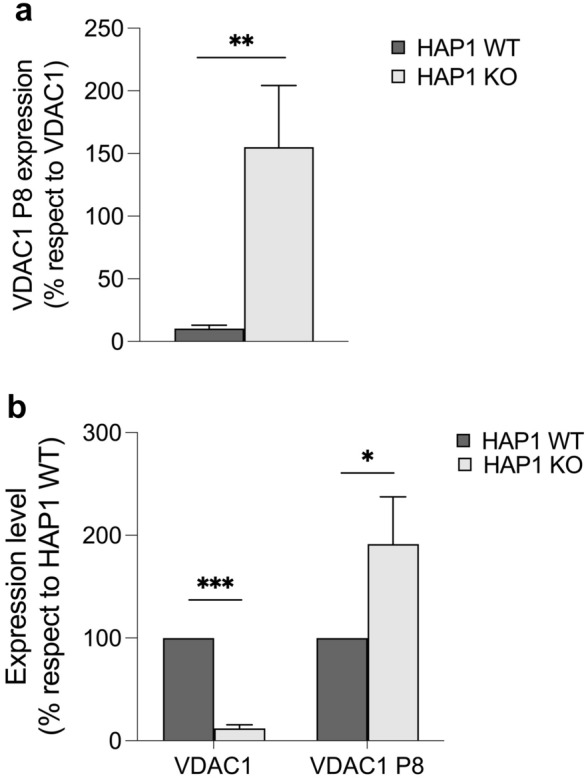
Results: We investigated the relevance of processed pseudogenes of human VDAC genes, both in physiological and in pathological contexts. Using high-throughput tools and querying many genomic and transcriptomic databases, we show that some VDAC pseudogenes are transcribed in specific tissues and pathological contexts. The obtained experimental data confirm an association of the VDAC1P8 pseudogene with acute myeloid leukemia (AML).

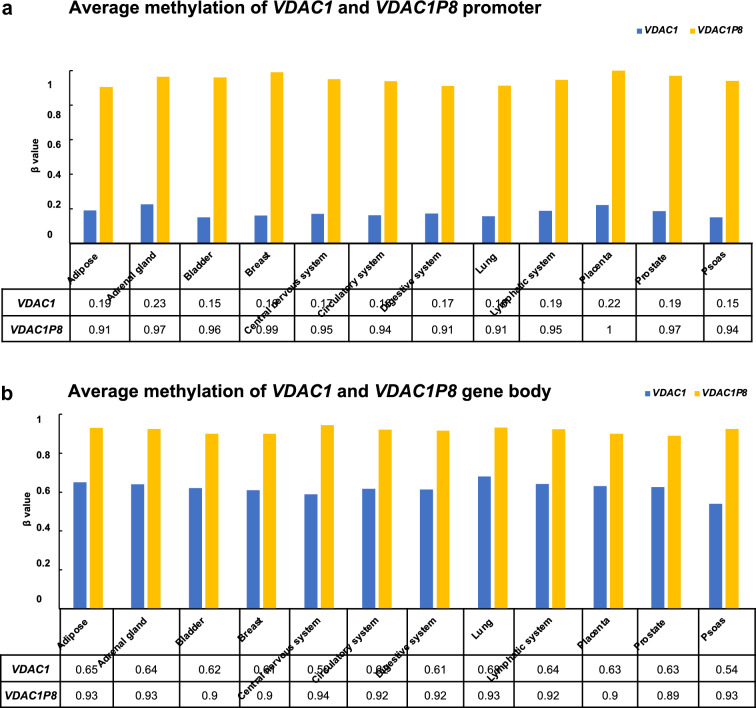
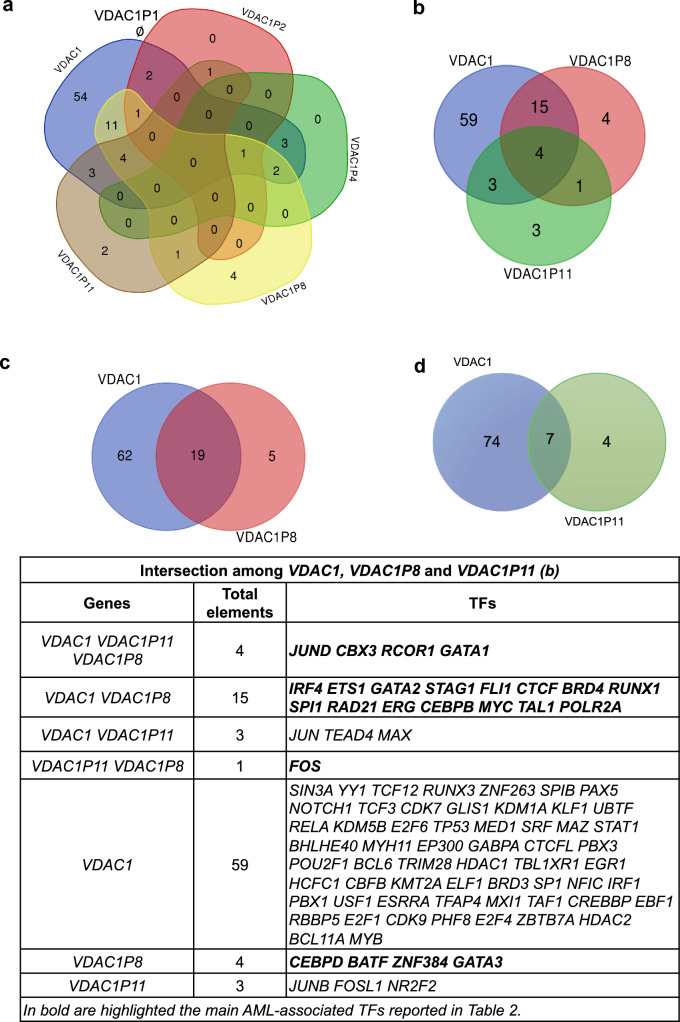
Conclusions: Our in-silico comparative analysis between the VDAC1 gene and its VDAC1P8 pseudogene, together with experimental data produced in AML cellular models, indicate a specific over-expression of the VDAC1P8 pseudogene in AML, correlated with a downregulation of the parental VDAC1 gene.

Keywords: Acute myeloid leukemia (AML); Competing endogenous RNAs (ceRNAs); Disease animal model; Pseudogene; Voltage-dependent anion selective channels (VDACs) gene.


Conflict of interest statement

The authors declare no competing interests.

Figures

Fig. 1
Fig. 1
Chromatin state and genomic features of VDAC1P8 pseudogene from UCSC Genome Browser GRCh37/hg19. The genomic context of VDAC1P8 pseudogene set around 1000 Kb upstream and downstream of the annotated Refseq is shown. The selected regulatory hub tracks are Pseudogene Annotation Set from GENCODE v.38lift37 Ensemble 104, Eukaryotic Promoter Database EPD v.4–6, CpG island track, Genotype-Tissue Expression GTEx RNA-seq v.8 2019, ChIP-Seq data for RNA polymerase II, H3K4me3 and H3K4me1, used as markers of transcriptional activation, while H3K9me3 and H3K27me3 are markers of transcriptional repression, and chromatin state segmentation by Hidden Markov Model from the ENCODE/Broad project of nine different cell lines (GM12878, H1-hESC, HepG2, HMEC, HUVEC, K562, NHEK, NHLF) identified using the following different colors: yellow = weak/poised enhancer; blue = isolator; dark green = transcriptional transition/elongation (Txn), light green = weak transcript
Fig. 2
Fig. 2
a-d. Analysis of gene expression profiles of VDAC1 and its pseudogenes from GEPIA repository. Specific-AML expression changes of VDAC1 compared to its pseudogenes was shown (a). Only values for VDAC1 and VDAC1P8 are plotted (b). Gene expression trend changes in tumor lines of VDAC1 and VDAC1P8 and in their normal counterparts are graphically represented (c-d). Data shown are included in Additional file 8, 9: Tables S1–S2. The height of bars is the median expression of Log2TPM + 1 of normal and AML tissue based on GTEX and TCGA respectively, available from GEPIA repository. TPM  transcripts per kilobase million
Fig. 3
Fig. 3
a-b. Adult (a) and fetal (b) transcripts tissue expression levels of VDAC1 and VDAC1P8 from RNA-seq CAGE in RIKEN FANTOM 5 project. Data cut-off is > 0.05 TPM. Data shown consist of RNA-Seq CAGE (Cap Analysis of Gene Expression) analysis from RIKEN FANTOM5 project (www.ebi.ac.uk/gxa/home). TPM = transcripts per kilobase million
Fig. 4
Fig. 4
a-b. Methylation levels of VDAC1P and VDAC1P8 gene in putative promoter (a) and gene body (b). *The average methylation of single-based resolution methylomes (SRMs) data provided by MethBank v.4.1 (https://ngdc.cncb.ac.cn/methbank) are calculated as β-Value that reflects the methylation intensity at each CpG site. β-Values of 0–1 (represented from 0 to 1) indicate signifying percent methylation, from 0 to 100%, respectively, for each CpG site
Fig. 5
Fig. 5
a-d. Comparative transcriptional analysis between VDAC1 and its pseudogenes. The analysis of TFs was performed by querying the hTFtarget database (http://bioinfo.life.hust.edu.cn/hTFtarget#!/) selecting only candidate TFs found in blood and bone marrow. In (a), the Venn diagram shows the intersection among VDAC1, VDAC1P2-P4-P8 and P11 with a null intersection of VDAC1P1. According to hTFtarget database, the TF found in VDAC1P1 is lamin B1 (LMNB1), not shared by other pseudogenes. In (b), it is illustrated the intersection among VDAC1, VDAC1P8 and VDAC1P11, which elements are represented in the table. In (c), the intersection between VDAC1 and VDAC1P8. In (d), the intersection between VDAC1 and VDAC1P11. The Venn diagrams made by https://bioinformatics.psb.ugent.be/cgi-bin/liste/Venn/calculate_venn.htpl
Fig. 6
Fig. 6
a-b. Expression of VDAC1 gene and VDAC1P8 pseudogene in HL60 AML cell line. In (a), the expression of VDAC1 gene and VDAC1P8 pseudogene was evaluated in different models of leukemia cell line (HL60, IMS-M2, MOLM-13, AML-3, AML-2) by real-time PCR relative quantification. In (b), the expression of VDAC1 and VDAC1P8 both assessed in HL60 by real-time PCR relative quantification were also measured following 48 h of AzaD treatment. The variation of mRNA in treated samples were expressed relatively to control samples, after normalization with the housekeeping gene GAPDH, by the ΔΔCt method. VDAC1P8 expression is reported as % respect to VDAC1 indicating with a value of 100 the level of VDAC1. Data were statistically analyzed by T-test and a value of P < 0.05 was considered significant.
Fig. 7
Fig. 7
a-f. Methylation patterns (β values) of the regulatory regions of VDAC1 and VDAC1P8 in control or AzaD-treated HL60 cells. Data was obtained by MethylCap-seq protocol and processed using the bioinformatic pipeline analysis described in Methods section. The promotors and gene sequences were tiled into 300 bp non overlapping windows; the color scale (range 0–1) represents the methylation levels of 300 bp sequence. Red boxes represent fully methylated windows and blue boxes represent unmethylated windows. Windows with insufficient readings to estimate a β-value are in grey (NA)
Fig. 8
Fig. 8
a, b. Expression of VDAC1 gene and VDAC1P8 pseudogene in VDAC1 KO leukemic cell lines. The level of VDAC1 and VDAC1P8 transcripts expression were evaluated in HAP1 WT and HAP1VDAC1 cells by real-time PCR relative quantification. In (a) VDAC1P8 transcript level was measured relatively to that of VDAC1. In (b) the expression level of both VDAC1 and VDAC1P8 in HAP1VDAC1 cells was measured relatively to their relative amount found in HAP1 WT. After normalization with the housekeeping gene GAPDH, by the ΔΔCt method. VDAC1P8 expression is reported as % respect to VDAC1 indicating with a value of 100 the level of VDAC1. Data were statistically analyzed by T-test and a value of P < 0.05 was considered significant

Similar articles

Cited by

References

    1. Lemasters JJ, Holmuhamedov E. Voltage-dependent anion channel (VDAC) as mitochondrial governator–thinking outside the box. Biochim Biophys Acta. 2006;1762(2):181–190. doi: 10.1016/j.bbadis.2005.10.006. - DOI - PubMed
    1. De Pinto V. Renaissance of VDAC: new insights on a protein family at the interface between mitochondria and cytosol. Biomolecules. 2021;11(1):107. doi: 10.3390/biom11010107. - DOI - PMC - PubMed
    1. Reina S, Magrì A, Lolicato M, Guarino F, Impellizzeri A, Maier E, et al. Deletion of β-strands 9 and 10 converts VDAC1 voltage-dependence in an asymmetrical process. Biochim Biophys Acta. 2013;1827(6):793–805. doi: 10.1016/j.bbabio.2013.03.007. - DOI - PubMed
    1. Aiello R, Messina A, Schiffler B, Benz R, Tasco G, Casadio R, et al. Functional characterization of a second porin isoform in Drosophila melanogaster. DmPorin2 forms voltage-independent cation-selective pores. J Biol Chem. 2004;279(24):25364–25373. doi: 10.1074/jbc.M310572200. - DOI - PubMed
    1. Messina A, Reina S, Guarino F, De Pinto V. VDAC isoforms in mammals. Biochimica et Biophysica Acta (BBA) Biomembranes. 2012;1818(6):1466–1476. doi: 10.1016/j.bbamem.2011.10.005. - DOI - PubMed

MeSH terms

Substances