. 2023 Aug;6(8):e1824.
doi: 10.1002/cnr2.1824. Epub 2023 Jun 21.

Six-transmembrane epithelial antigen of prostate 3 (STEAP3) is a potential prognostic biomarker in clear cell renal cell carcinoma that correlates with M2 macrophage infiltration and epithelial-mesenchymal

Affiliations

Six-transmembrane epithelial antigen of prostate 3 (STEAP3) is a potential prognostic biomarker in clear cell renal cell carcinoma that correlates with M2 macrophage infiltration and epithelial-mesenchymal

Haotian Wei et al. Cancer Rep (Hoboken). 2023 Aug.

Abstract

Background: The six-transmembrane epithelial antigen of the prostate 3 (STEAP3) is a metalloreductase, which is essential for iron uptake. Existing literature has shown that STEAP3 may perform an important role in the onset and progression of tumors. Nonetheless, a complete pan-cancer investigation of the prognostic significance and immune properties of STEAP3 is currently unavailable.

Aims: As part of our investigation into the possible functions of STEAP3 in malignancies, we conducted a comprehensive analysis to examine the prognostic value and immune features of STEAP3 in human pan-cancer.

Methods and results: R and Cytoscape programs were applied to analyze and visualize the data. The expression of STEAP3 in both cell lines and tissues was measured utilizing a variety of approaches. Using the shRNA knockdown technique, we tested the viability of the A498 and 786-O cell lines and validated their functions. Both CCK-8 and transwell assays were conducted to estimate cell proliferation and invasion. The expression of STEAP3 was substantially elevated and was shown to be linked to prognosis in the majority of malignancies, notably in clear cell renal cell carcinoma (ccRCC). In addition, the expression of STEAP3 was shown to have a strong correlation with immune infiltrates, which in turn triggered the recruitment and polarization of M2 macrophages in ccRCC. The protein STEAP3 shows promise as a predictor of responses to immune-checkpoint blockade (ICB) therapy. Positive links between STEAP3 and the epithelial-mesenchymal transition (EMT), the p53 pathway, and the immune-associated pathways were also found in the enrichment analysis. Our results illustrated that the STEAP3 expression level was substantially elevated in ccRCC tissues and suggested that it could stimulate EMT in ccRCC by downregulating CDH1.

Conclusion: In a diverse range of cancers, STEAP3 might serve as a biomarker for determining the prognosis as well as a predictor of immunotherapy responsiveness. STEAP3 is a novel biological marker for determining prognosis, and it also performs a remarkable function in the promotion of tumor growth in ccRCC by enhancing invasion and EMT, as well as by triggering the recruitment and polarization of M2 macrophages.

Keywords: M2 macrophage; STEAP3; clear cell renal cell carcinoma; epithelial-mesenchymal transition; immune infiltration; prognostic biomarker.


Conflict of interest statement

The authors declare that the research was conducted in the absence of any commercial or financial relationships that could be construed as a potential conflict of interest.

Figures
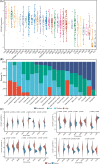
FIGURE 1
FIGURE 1
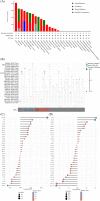
The expression landscape of STEAP3 in human pan‐cancer. (A) The distribution of mRNA expression of STEAP3 in distinct cell lines based on CCLE database. (B) The protein expression distribution of STEAP3 by immunohistochemistry in different cancers based on HPA database. (C) The mRNA expression distribution of STEAP3 in tumor tissues and normal tissues based on TCGA database. The Wilcoxon test was utilized to examine the significance of variations between two sets of data.
FIGURE 2
FIGURE 2
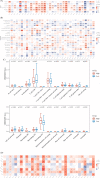
Association between STEAP3 expression and prognosis in pan‐cancer. (A, B) The predictive significance of STEAP3 in various malignancies was shown in a forest plot using univariate Cox regression. (C, D) Kaplan–Meier overall survival curves of STEAP3 in ACC, KIRC, KIRP, and LGG. (E) The correlations between the STEAP3 expression and tumor clinical stage. Red represents a positive and blue a negative correlation. Statistical correlations were assessed using a Spearman correlation analysis. (F) The correlations between the STEAP3 expression and tumor pathological stage. Red represents a positive and blue a negative correlation. Statistical correlations were assessed using a Spearman correlation analysis. (G) The expression distribution of STEAP3 in the different clinical stages. STEAP3 expression levels in Stage I, II, III, and IV groups were 3.69 ± 1.41, 3.80 ± 1.56, 4.34 ± 1.66, and 4.55 ± 1.74. Wilcoxon test was employed to examine the significance of differences between two sets of data. (H) The expression distribution of STEAP3 in the different pathological grades. STEAP3 expression levels in Grade 1, 2, 3, and 4 groups were 3.12 ± 1.07, 3.65 ± 1.35, 3.98 ± 1.63, and 5.24 ± 1.44. Wilcoxon test was employed to examine the significance of differences between two sets of data. (I) The expression distribution of STEAP3 in the different N stages. STEAP3 expression levels in the N0 and N1 groups were 3.94 ± 1.59 and 5.31 ± 1.23. Wilcoxon test was employed to examine the significance of differences between two sets of data. (J) The expression distribution of STEAP3 in the different M stages. STEAP3 expression levels in the M0 and M1 groups were 3.91 ± 1.53 and 4.52 ± 1.73. Wilcoxon test was employed to examine the significance of differences between two sets of data.
FIGURE 3
FIGURE 3
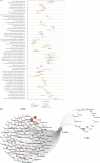
Analysis of STEAP3 gene mutation in pan‐cancer. (A) The STEAP3 gene alteration frequency with different types of mutations in pan‐cancer. (B) Mutation diagram of STEAP3 in pan‐cancer across protein domains. (C, D) Pan‐cancer analysis of the correlation between STEAP3 expression and immunomodulators TMB and MSI. Statistical correlations were assessed using a Spearman correlation analysis.
FIGURE 4
FIGURE 4
Correlation of STEAP3 with immune cell infiltration and immune checkpoint genes in pan‐cancer. (A, B) The correlations between the STEAP3 expression and the infiltration levels of various immune cells based on the TIMER and CIBERSORT algorithms. Statistical correlations were assessed using a Spearman correlation analysis. (C) The difference of immune microenvironment between the high STEAP3 expression group and low STEAP3 expression group in KIRC. Wilcoxon test was employed to examine the significance of differences between two sets of data. (D) The correlations between the STEAP3 and the immune checkpoints related genes expression. Statistical correlations were assessed using a Spearman correlation analysis.
FIGURE 5
FIGURE 5
STEAP3 predicts the response to immunotherapy, chemotherapy agents, and small molecular compounds. (A) STEAP3 expression before and after immune‐checkpoint blockade treatments in different cancers. The asterisk (*p) represents the degree of importance (*p < .05, **p < .01, ***p < .001). (B) The correlations between the STEAP3 expression and drug IC50 based on GDSC and CTRP database. Statistical correlations were assessed using a Spearman correlation analysis.
FIGURE 6
FIGURE 6
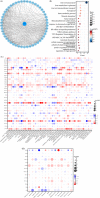
Protein–protein interaction network and functional enrichment of STEAP3. (A) The protein–protein interaction network of STEAP3 based on the STRING database. (B) GO and KEGG functional enrichment of STEAP3‐related genes. (C) The hallmarks ssGSEA of STEAP3 in pan‐cancer. The size of the circle represents the p‐value of each cancer enrichment item, and the color represents the r‐value of each enrichment item. Statistical correlations were assessed using a Spearman correlation analysis. (D) The correlation between STEAP3 expression and 14 cancer functional states using single‐cell sequence data from the CancerSEA database. The size of the circle represents the p‐value of each cancer enrichment item, and the color represents the r‐value of each enrichment item. Statistical correlations were assessed using a Spearman correlation analysis.
FIGURE 7
FIGURE 7
The expressions and biological functions of STEAP3 in ccRCC. (A) STEAP3 expression level in normal renal tissue and renal clear cell cancer tissue from TCGA database. STEAP3 expression levels in the KIRC and Normal groups were 3.97 ± 1.57 and 3.44 ± 0.91. The Wilcoxon test was utilized to examine the significance of variations between two sets of data. (B) STEAP3 expression level in normal renal tissue and renal clear cell cancer tissue from GSE15641 database. STEAP3 expression levels in the KIRC and Normal groups were 8.24 ± 1.43 and 5.69 ± 0.19. The Wilcoxon test was utilized to examine the significance of variations between two sets of data. (C) QRT‐PCR analysis of STEAP3 expression in 10 pairs of ccRCC and normal tissues. Gene expression values were normalized to GADPH expression values. Normal group was used as control. STEAP3 relative expression level in the ccRCC groups was 5.49 ± 1.62 (n = 10). The significant difference of two paired‐group data was tested with the paired t test. (D) Expression of STEAP3 detected in paired ccRCC and adjacent normal tissues using western blot (n = 3). α‐tubulin is included as a reference gene. (E) Representative images of immunohistochemistry showing STEAP3 expression in paired ccRCC and adjacent normal tissues. STEAP3 relative expression levels in the ccRCC and normal groups were 63.98 ± 4.29 and 45.78 ± 3.93 (n = 3). The significance difference of two paired‐group data was tested with the paired t test. (F) Expression of STEAP3 detected after transfection with shRNA in 786‐O and A498 cell lines using western blot. α‐tubulin is included as a reference gene. (G) The CCK‐8 assay indicated that the knockdown of STEAP3 weakened the proliferation ability of 786‐O and A498 cell lines. OD values in the 786‐O and ShSTEAP3 groups were 0.89 ± 0.06 and 0.47 ± 0.03 (n = 3). OD values in the A498 and ShSTEAP3 groups were 0.87 ± 0.04 and 0.60 ± 0.04 (n = 3). The significant difference of two paired‐group data was tested with the paired t test. (H) The transwell experiments indicated that the knockdown of STEAP3 weakened the invasive ability of 786‐O and A498 cell lines. Counts in the 786‐O and ShSTEAP3 groups were 139.67 ± 5.69 and 63.33 ± 7.57 (n = 3). Counts in the A498 and ShSTEAP3 groups were 123.00 ± 4.00 and 39.67 ± 7.02 (n = 3). The significance difference of two paired‐group data was tested with the paired t test. (I) RT‐qPCR analysis of EMT marker (CDH1, CDH2, VIM). Gene expression values were normalized to GADPH expression values. 786‐O and A498 groups were used as control. CDH1 relative expression level in the 786‐O shSTEAP3 and A498 shSTEAP3 groups was 0.50 ± 0.08 (n = 3) and 0.56 ± 0.03 (n = 3). CDH2 relative expression level in the 786‐O shSTEAP3 and A498 shSTEAP3 groups was 1.22 ± 0.05 (n = 3) and 1.14 ± 0.12 (n = 3). VIM relative expression level in the 786‐O shSTEAP3 and A498 shSTEAP3 groups was 1.12 ± 0.05 (n = 3) and 1.65 ± 0.06 (n = 3). The significant difference of two paired‐group data was tested with the paired t test.

Similar articles

Cited by

References

    1. Siegel RL, Miller KD, Fuchs HE, Jemal A. Cancer statistics, 2022. CA Cancer J Clin. 2022;72(1):7‐33. - PubMed
    1. Ribas A, Wolchok JD. Cancer immunotherapy using checkpoint blockade. Science. 2018;359(6382):1350‐1355. - PMC - PubMed
    1. Crichton R. Iron Metabolism: from Molecular Mechanisms to Clinical Consequences. John Wiley & Sons; 2016.
    1. Ni S, Yuan Y, Song S, Li X. A double‐edged sword with a therapeutic target: iron and ferroptosis in immune regulation. Nutr Rev. 2022;81(5):587‐596. - PubMed
    1. Kim SH, Ho JN, Jin H, et al. Upregulated expression of BCL2, MCM7, and CCNE1 indicate cisplatin‐resistance in the set of two human bladder cancer cell lines: T24 cisplatin sensitive and T24R2 cisplatin resistant bladder cancer cell lines. Investig Clin Urol. 2016;57(1):63‐72. - PMC - PubMed

Publication types