. 2023 Jun 22;8(12):e162270.
doi: 10.1172/jci.insight.162270.

CCL24 regulates biliary inflammation and fibrosis in primary sclerosing cholangitis

Affiliations

CCL24 regulates biliary inflammation and fibrosis in primary sclerosing cholangitis

Raanan Greenman et al. JCI Insight. .

Abstract

ˆCCL24 is a pro-fibrotic, pro-inflammatory chemokine expressed in several chronic fibrotic diseases. In the liver, CCL24 plays a role in fibrosis and inflammation, and blocking CCL24 led to reduced liver injury in experimental models. We studied the role of CCL24 in primary sclerosing cholangitis (PSC) and evaluated the potential therapeutic effect of blocking CCL24 in this disease. Multidrug resistance gene 2-knockout (Mdr2-/-) mice demonstrated CCL24 expression in liver macrophages and were used as a relevant experimental PSC model. CCL24-neutralizing monoclonal antibody, CM-101, significantly improved inflammation, fibrosis, and cholestasis-related markers in the biliary area. Moreover, using spatial transcriptomics, we observed reduced proliferation and senescence of cholangiocytes following CCL24 neutralization. Next, we demonstrated that CCL24 expression was elevated under pro-fibrotic conditions in primary human cholangiocytes and macrophages, and it induced proliferation of primary human hepatic stellate cells and cholangiocytes, which was attenuated following CCL24 inhibition. Correspondingly, CCL24 was found to be highly expressed in liver biopsies of patients with PSC. CCL24 serum levels correlated with Enhanced Liver Fibrosis score, most notably in patients with high alkaline phosphatase levels. These results suggest that blocking CCL24 may have a therapeutic effect in patients with PSC by reducing liver inflammation, fibrosis, and cholestasis.

Keywords: Chemokines; Fibrosis; Hepatology; Inflammation; Macrophages.


Conflict of interest statement

Conflict of interest: AK, RG, OL, IV, RA, SA, TS, and AM are employees of Chemomab Therapeutics Ltd. (Israel); NB and MSS are former employees of Chemomab Therapeutics Ltd. MP is a cofounder and shareholder of Engitix Therapeutics Ltd. (United Kingdom); chief medical advisor and shareholder of AcuLive Therapeutics Ltd. (United Kingdom); and advisory board/consultant (active March 2022) of Chemomab Therapeutics Ltd., Resolution Therapeutics (United Kingdom), Dicerna (Novo Nordisk, USA), AstraZeneca (United Kingdom), and Galecto (Sweden). AP is a consultant for Chemomab Therapeutics Ltd.

Figures

Figure 1
Figure 1. scRNA-Seq of monocytes and macrophages from 3-month-old Mdr2–/– mice.
(A) Five populations of monocytes/macrophages and dendritic cells (DCs) were identified using general mononuclear phagocyte markers: Cd86, Aif1 (Iba1), Cd68, and Adgre1 (F4/80). (B) Heatmap, mononuclear phagocyte cluster marker genes (left, color coded by cluster), exemplar genes labeled (bottom). Genes columns, clusters rows. (CH) Each population was characterized using specific genes. Res Mac express Cd163, Marco, and Clec4f (C). Mo/Mac identified by Cx3cr1, H2-M2, and Ccl8 (Mcp2) (D). Mo were characterized by Chil3, Inhba, and Areg expression (E). DCs were characterized by Clec9a, Cd209a (DC-SIGN), and Ccr7 (F). (G) Ccl24’s robust expression by liver-resident macrophages. (H) A potentially unique subpopulation of macrophages express Ccl24 as well as endothelial cell gene markers like Lyve1. (I) Secreted levels of CCL24 from isolated mouse Kupffer cells that were cultured with or without IL-4 supplement (20 ng/mL). Data are shown as mean ± SEM (n = 3). *P ≤ 0.05, t test. Res Mac, resident macrophages; Mo, monocytes; Mo/Mac, monocyte-derived macrophages; Lyve1, lymphatic vessel endothelial hyaluronan receptor 1.
Figure 2
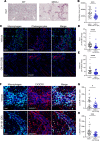
Figure 2. CM-101 (D8) abrogates macrophage accumulation and reduces ductular expansion in Mdr2–/– mice.
(A) Immunohistochemistry staining of Iba1 in 3-month-old WT and Mdr2–/– mice. (BE) Immunofluorescence staining of liver cholangiocytes and macrophages in CM-101–treated (10 mg/kg) or vehicle-treated Mdr2–/– mice. (B) Quantification of the injured peribiliary area, based on Iba1 and pan-CK staining (n = 50 fields, 5 mice in each group). (C) Representative Mdr2–/– liver sections stained against Iba1 for macrophages and pan-CK for cholangiocytes (×40 original magnification). (D and E) Quantification of Iba1 and pan-CK staining (n = 38–40 fields, 7 mice in each group). (F) Representative Mdr2–/– liver sections stained against Iba1 and CX3CR1 for recruited macrophages (×40 original magnification). (G and H) Quantification of recruited macrophages (Iba1-positive and CX3CR1-positive, G) and nonrecruited macrophages (Iba1-positive and CX3CR1-negative, H) (n = 30 fields, 5 mice in each group). Data are mean ± SEM. Mann-Whitney test, *P ≤ 0.05, ***P ≤ 0.001, ****P ≤ 0.0001.
Figure 3
Figure 3. Mdr2–/– mice treated with CM-101 (D8) exhibit reduced liver damage and fibrosis.
(A) Serum levels of liver enzymes ALP and ALT and BA (n = 7, 29, 14, and 16 for WT, Mdr2–/–+vehicle, Mdr2–/–+5 mg/kg CM-101, and Mdr2–/–+10 mg/kg CM-101, respectively). (B and C) Sirius red (SR) staining in Mdr2–/– mice. Representative images (B) and quantification of SR-stained area (C) (n = 12 and 13 for vehicle and 10 mg/kg, respectively. 3 fields per mouse). (D) Timp1 and Col1a1 expression was measured by real-time PCR in livers of treated and vehicle-treated Mdr2–/– mice (n = 28, 16, and 15 mice for vehicle, 5 mg/kg, and 10 mg/kg, respectively). Data are mean ± SEM. *P ≤ 0.05, **P ≤ 0.01, ***P ≤ 0.001, ****P ≤ 0.0001, ANOVA followed by Holm-Šídák multiple comparisons test.
Figure 4
Figure 4. CM-101 (D8) treatment alters cholangiocyte state and immune cell composition in the peribiliary area in Mdr2–/– mice.
(AG) Spatial gene expression analysis (NanoString GeoMx technology) was performed in peribiliary areas from CM101–treated (10 mg/kg) or vehicle-treated Mdr2–/– mice. (A) Regions of interest (ROIs) were separated to pan-CK–positive area or pan-CK–negative area. (B and E) Volcano plot showing the differential gene expression. (C and F) Waterfall plot of gene set enrichment analysis signatures ranked by normalized enrichment score (NES). (D) CCL2 and alkaline phosphatase liver/bone/kidney isozyme gene expression analysis in pan-CK–positive peribiliary areas of treated and vehicle-treated Mdr2–/– mice (n = 12; 4 mice, 3 ROIs for each tissue). (G) Monocytes and macrophages’ percentages in pan-CK–negative peribiliary areas. Bulk RNA counts were deconvoluted using ImmGen cell signatures (n = 12; 4 mice, 3 ROIs for each tissue). (HL) Proliferating macrophages and cholangiocytes were analyzed by immunofluorescence staining against proliferating cell nuclear antigen (PCNA), pan-CK, and Iba1. (H) Representative Mdr2–/– liver sections of CM-101– or vehicle-treated animals (×40 original magnification). (I and J) Quantification of proliferating cholangiocytes (I) and macrophages (J) by total number in peribiliary area (n = 40; 5 mice). (K and L) Proximity analysis between macrophages and either total cholangiocytes (K) or proliferating cholangiocytes (L) (n = 40; 5 mice). Mann-Whitney test, *P ≤ 0.05, **P ≤ 0.01, ***P ≤ 0.001. Scale bar represents 50 μm.
Figure 5
Figure 5. CCL24 is upregulated under pro-fibrotic conditions in human macrophages, hepatic stellate cells, and cholangiocytes.
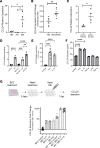
(A) M2 macrophages upregulate CCL24 gene expression (n = 3–4). (B) Secreted levels of CCL24 expression measured in M2 macrophages incubated with or without HSCs (n = 6). (C) Gene expression of CCL24 in HSCs cultured with M0 or M2 macrophage conditioned medium (M0-CM and M2-CM, respectively) (n = 4). (D) Gene expression of CCL24 in LX2 cells cultured with starvation medium or M0 or M2 macrophage conditioned medium (M0-CM and M2-CM, respectively). IL-4 was supplemented at 20 ng/mL (n = 3). (E) CCL24 gene expression in primary cholangiocytes following treatment with IL-4 or IL-13 (n = 3–6). (F) CCL24 quantified by ELISA following different treatments of primary cholangiocytes (n = 3). (G) Secreted levels of CCL24 in macrophages (M0) cocultured with cholangiocytes that had been pretreated with vehicle, IL-4 or IL-13. Upper scheme, experiment procedure: cholangiocytes were treated for 3 days with vehicle, IL-4 or IL-13, then washed, and M0 cells were added on top of the cholangiocytes for 24 hours. Lower graph, detection by ELISA (n = 7). All data are presented as mean ± SEM. *P ≤ 0.05, **P ≤ 0.01, ***P ≤ 0.001, ****P ≤ 0.0001, t test (AC) or ANOVA followed by Holm-Šídák multiple comparisons test (DF).
Figure 6
Figure 6. CCL24 induces human HSC and cholangiocyte proliferation and macrophage polarization.
(AC) Macrophages, HSCs, and cholangiocytes express the CCR3 receptor. Representative histograms of flow cytometric analysis of surface CCR3 expression in primary cholangiocytes (A), primary HSCs (B), and monocyte-derived macrophages (C). The experiment was conducted 4 times. Macrophages in coculture are gated based on expression of CCR5 and CD206. (DF) Proliferation of CFSE-labeled HSCs (D and E) or LX2 cells (F) with or without CM-101 (n = 3–6). (G) Proliferation of BECs with IgG1 or CM-101 was measured based on Ki-67 expression. Cholangiocytes were incubated with or without M2 macrophages with 5 μg/mL of CM-101 or IgG1 isotype control (n = 4). Data are mean ± SEM. *P ≤ 0.05, **P ≤ 0.01, ***P ≤ 0.001, ****P ≤ 0.0001, ANOVA followed by Holm-Šídák multiple comparisons test.
Figure 7
Figure 7. CCL24 and CCR3 are highly expressed in the liver and on PBMCs of patients with PSC and correlate with fibrotic biomarkers.
(A and B) CCL24 staining in PSC sections (×40 original magnification). Positive staining is detected in inflammatory mononuclear cells (red circle) and cholangiocytes (yellow circle). (C) CCR3 staining (×40 original magnification) observed in inflammatory cells (black arrowheads) or fibroblasts (blue circle) surrounding the bile duct. (D) CCR3 staining of PBMCs from PSC patients (n = 10) and healthy individuals (n = 22). Data are mean ± SEM. ****P ≤ 0.0001, t test.
Figure 8
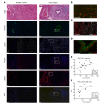
Figure 8. CCL24 and CCR3 are highly expressed in the bile duct areas and costained with inflammatory and fibrotic cellular markers in PSC patients’ liver biopsies.
Sequential slides from bile ducts of patients with PSC and healthy controls were stained. (A) Representative images from healthy control and PSC patient livers stained for H&E, pan-CK, CCR3, CCL24, α-SMA, and Iba1. Staining demonstrates bile ducts surrounded by blood vessels, inflammatory cells, and activated fibroblasts. CCL24 expression is observed in cholangiocytes and in the inflammatory cells surrounding bile duct area. (BD) High-magnification images of the biliary and peribiliary area show the colocalization of Iba1 and CCL24 (B), of α-SMA and CCR3 (C), and of pan-CK and CCL24 (D). Scale bar represents 50 μm. (E) ELF score and CCL24 levels in the serum of patients with PSC (n = 20) were measured for each patient. Pearson’s correlation was used to identify association of CCL24 to fibrotic biomarkers and liver damage. Dividing this cohort by ALP levels associated with higher risk of progression (F), resulting in higher correlation of CCL24 and the fibrotic biomarker, ELF.

References

    1. Friedman SL. Mechanisms of hepatic fibrogenesis. Gastroenterology. 2008;134(6):1655–1669. doi: 10.1053/j.gastro.2008.03.003. - DOI - PMC - PubMed
    1. Bataller R, Brenner DA. Liver fibrosis. J Clin Invest. 2005;115(2):209–218. doi: 10.1172/JCI24282. - DOI - PMC - PubMed
    1. Lazaridis KN, LaRusso NF. The cholangiopathies. Mayo Clin Proc. 2015;90(6):791–800. doi: 10.1016/j.mayocp.2015.03.017. - DOI - PMC - PubMed
    1. Chapman R, et al. Diagnosis and management of primary sclerosing cholangitis. Hepatology. 2010;51(2):660–678. doi: 10.1002/hep.23294. - DOI - PubMed
    1. Charatcharoenwitthaya P, Lindor KD. Primary sclerosing cholangitis: diagnosis and management. Curr Gastroenterol Rep. 2006;8(1):75–82. doi: 10.1007/s11894-006-0067-8. - DOI - PubMed

Publication types