. 2023 Jun 22;8(12):e161318.
doi: 10.1172/jci.insight.161318.

Immune checkpoint activity regulates polycystic kidney disease progression

Affiliations

Immune checkpoint activity regulates polycystic kidney disease progression

Emily K Kleczko et al. JCI Insight. .

Abstract

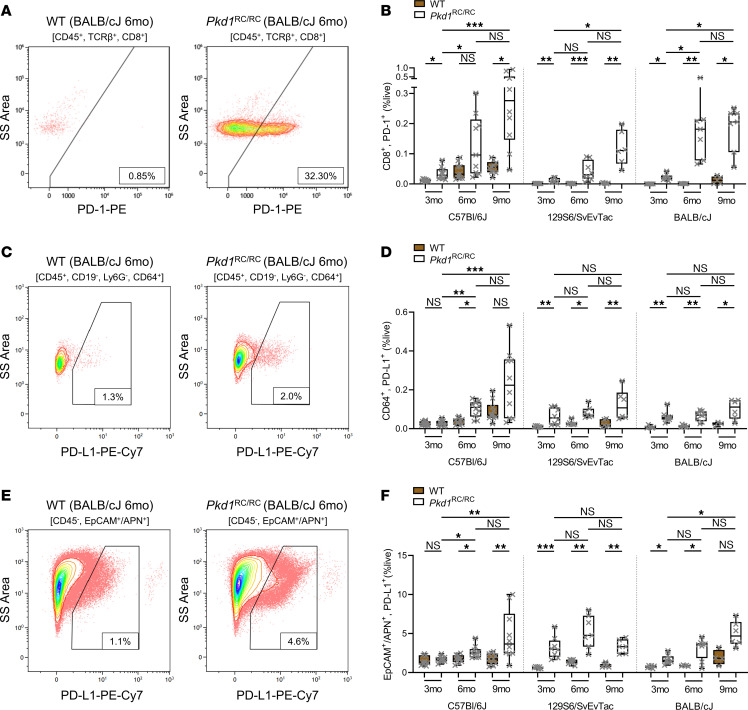
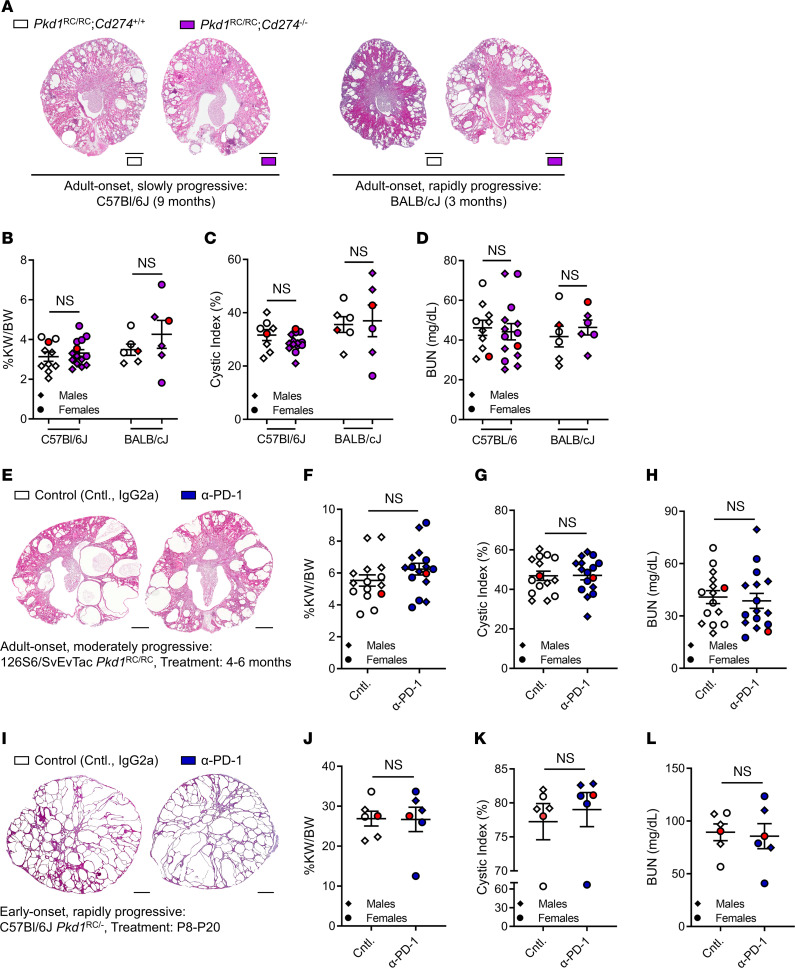
Innate and adaptive immune cells modulate the severity of autosomal dominant polycystic kidney disease (ADPKD), a common kidney disease with inadequate treatment options. ADPKD has parallels with cancer, in which immune checkpoint inhibitors have been shown to reactivate CD8+ T cells and slow tumor growth. We have previously shown that in PKD, CD8+ T cell loss worsens disease. This study used orthologous early-onset and adult-onset ADPKD models (Pkd1 p.R3277C) to evaluate the role of immune checkpoints in PKD. Flow cytometry of kidney cells showed increased levels of programmed cell death protein 1 (PD-1)/cytotoxic T lymphocyte associated protein 4 (CTLA-4) on T cells and programmed cell death ligand 1 (PD-L1)/CD80 on macrophages and epithelial cells in Pkd1RC/RC mice versus WT, paralleling disease severity. PD-L1/CD80 was also upregulated in ADPKD human cells and patient kidney tissue versus controls. Genetic PD-L1 loss or treatment with an anti-PD-1 antibody did not impact PKD severity in early-onset or adult-onset ADPKD models. However, treatment with anti-PD-1 plus anti-CTLA-4, blocking 2 immune checkpoints, improved PKD outcomes in adult-onset ADPKD mice; neither monotherapy altered PKD severity. Combination therapy resulted in increased kidney CD8+ T cell numbers/activation and decreased kidney regulatory T cell numbers correlative with PKD severity. Together, our data suggest that immune checkpoint activation is an important feature of and potential novel therapeutic target in ADPKD.

Keywords: Adaptive immunity; Monogenic diseases; Nephrology.


Figures

Figure 1
Figure 1. The PD-1|PD-L1 immune checkpoint pathway is induced in an orthologous mouse model of autosomal dominant polycystic kidney disease.
Kidneys of WT and Pkd1RC/RC mice in the C57BL/6J, 129S6/SvEvTac, and BALB/cJ strains were harvested at 3, 6, and 9 months of age and analyzed by flow cytometry to identify the expression of PD-1 on CD8+ T cells (CD45+TCRβ+CD8+; A and B), PD-L1 on macrophages (CD45+CD19Ly6GCD64+; C and D), and PD-L1 on epithelial cells (CD45EpCAM+APN+; E and F). (A, C, and E) Representative flow diagrams of 6-month-old BALB/cJ WT and Pkd1RC/RC kidneys. SS, side scatter. (B, D, and F) Quantification of PD-1–positive CD8+ T cells (B), PD-L1–positive CD64+ macrophages (D), and PD-L1–positive epithelial cells (F) as percentage live (%live) comparing WT (brown) with Pkd1RC/RC (white) kidneys. PD-1 or PD-L1 expression is significantly upregulated on the respective cell type in Pkd1RC/RC compared with WT kidneys and correlative with increasing disease severity in most instances. Data are presented as box plot (25th to 75th percentile and median) with whiskers of 10th and 90th percentiles; single data points are depicted. Kruskal-Wallis 1-way ANOVA with multiple-comparison follow-up by controlling for false discovery rate (Benjamini, Krieger, Yekutieli) was performed. *P < 0.05, **P < 0.01, ***P < 0.001. N = 9–10 for C57BL/6J WT or Pkd1RC/RC, N = 6–8 for 129S6/SvEvTac WT or Pkd1RC/RC, N = 5–6 for BALB/cJ WT, and N = 7–8 BALB/cJ Pkd1RC/RC. Data points are half male and half female for all groups.
Figure 2
Figure 2. PD-1|PD-L1 immune checkpoint protein expression is increased at cystic lesions of Pkd1RC/RC kidneys and in human ADPKD samples.
(A) Immunofluorescence (IF) labeling of PD-1 (left) and PD-L1 (right) in BALB/cJ WT and Pkd1RC/RC kidneys. Merged IF image is shown; Supplemental Figures 1 and 2 contain single-channel images. PD-1 or PD-L1 (green), T cells/CD3 (red), epithelial cells/E-cadherin (white), nuclei/DAPI (blue). In Pkd1RC/RC but not WT kidneys, T cells stain positive for PD-1 and are in close proximity to cystic lesions. Further, in cystic regions, interstitial cells and tubular epithelial cells stain positive for PD-L1 in Pkd1RC/RC but not WT kidneys. Asterisks in WT: T cells; asterisks in Pkd1RC/RC: PD-1–positive T cells in contact with epithelial cells, PD-L1–positive interstitial or epithelial cells in contact with T cells. Pkd1RC/RC: 2 separate animals are shown. Scale bar: 50 μm. (B) PD-L1 expression in immortalized human renal cortical tubular epithelial (RCTE) cells (PKD1+/+) versus 9-12 cells (PKD1–/–). 9-12 cells have significantly increased levels of PD-L1 compared with control. Top: Representative Western blot image. Bottom: Quantification of Western blots from 3 independent samples. (C) IHC staining for PD-L1 in end-stage kidney tissue of 3 ADPKD patients, an autosomal recessive PKD (ARPKD) patient, and a normal human kidney (NHK). 2° only control: kidney tissue slide of an ADPKD patient stained without addition of primary antibody. The tubular/cystic epithelium in ADPKD and ARPKD shows increased expression of PD-L1 compared with tubules of NHK. PD-L1 expression is also found in some interstitial cells within the ADPKD or ARPKD tissue sections (asterisks). Scale bars: 100 μm. Data are presented as mean ± SEM (B); single data points are depicted. An unpaired 2-tailed t test was performed (B). **P < 0.01.
Figure 3
Figure 3. Genetic loss of Pd-l1 or monoclonal anti–PD-1 treatment does not affect PKD severity in mice with slowly or rapidly progressive ADPKD.
(AD) Pkd1RC/RC mice were crossed with Pd-l1–/– (NCBI gene ID: Cd274) mice to obtain Pkd1RC/RC Cd274+/+ (control group; white) and Pkd1RC/RC Cd274–/– (experimental group; purple) mice. Animals were euthanized at 9 months of age in the C57BL/6J strain and 3 months in the BALB/cJ strain. (EH) 129S6/SvEvTac Pkd1RC/RC mice were treated with 10 mg/kg of anti–PD-1 (α-PD-1; blue) or IgG2a (control, white) twice weekly by i.p. injection from 4 to 6 months of age. (IL) C57BL/6J Pkd1RC/– mice were treated with 10 mg/kg of α-PD-1 (blue) or IgG2a (control, white) every other day by i.p. injection from P8 until P20. (A, E, and I) Representative H&E cross-sectional images of the kidneys. Scale bars: 1 mm. (B, F, and J) Percentage kidney weight/body weight (%KW/BW). (C, G, and K) Cystic index as measured by kidney area occupied by cysts (%). (D, H, and L) Blood urea nitrogen (BUN) levels. There was no significant difference in any of the analyzed PKD parameters, suggesting that inhibition of the PD-1|PD-L1 immune checkpoint does not impact adult-onset or early-onset PKD progression (also see Supplemental Table 3). Data are presented as mean ± SEM; single data points are depicted. Diamonds, males; circles, females. Red data points indicate the animal shown in A, E, and I. Nonparametric Mann-Whitney tests were performed. (AD) N = 10–14 for C57BL/6J or N = 6 for BALB/cJ mice per group. (EH) N = 15–16 mice per group. (IL) N = 6 mice per group.
Figure 4
Figure 4. Combination immune checkpoint inhibition reduces cystic kidney disease in Pkd1RC/RC mice.
BALB/cJ Pkd1RC/RC mice were treated from 1 to 3 months of age. One-month baseline PKD phenotypes obtained from a separate cohort of BALB/cJ Pkd1RC/RC mice are summarized in Supplemental Table 4 and shown as light gray dotted lines in BE (line is set at the analysis mean). Experimental groups: control (white, IgG2a plus IgG2b), α-PD-1 (blue, plus IgG2b), α-CTLA-4 (green, plus IgG2a), and combination (Comb., yellow, α-PD-1 plus α-CTLA-4). (A) Representative H&E cross-sectional images of the kidneys. Scale bars: 1 mm. (B) Percentage kidney weight/body weight (%KW/BW). (C) Cystic index as measured by kidney area occupied by cysts (%), average cyst size, and average cyst number normalized by tissue area. (D) Fibrotic index. (E) BUN levels. Data are presented as mean ± SEM; single data points are depicted. Diamonds, males; circles, females. Red data points indicate the animal shown in A. Kruskal-Wallis 1-way ANOVA with multiple-comparison follow-up by controlling for false discovery rate (Benjamini, Krieger, Yekutieli) was performed. *P < 0.05, **P < 0.01. N = 7–8 mice per group. Nonsignificant pairwise comparisons are not shown.
Figure 5
Figure 5. Treatment with α–PD-1 plus α–CTLA-4 results in rebalancing of adaptive immunity within the cystic immune microenvironment.
(AD, F, and G) Kidney flow cytometry data from BALB/cJ Pkd1RC/RC mice treated with α–PD-1 (blue), α–CTLA-4 (green), or combination (Comb.; yellow); control, white. (A) Numbers of immune cells (CD45+; % live), (B) CD8+ T cells (% CD45+), and (C and D) CD8+ T cells expressing CD44 and CD69 (C) or Ki67 (D) (% CD45+). α–PD-1 or α–CTLA-4 increased CD8+ T cell numbers, activation, and proliferation, which was further amplified by Comb. (E) Analysis of Treg numbers in 3-month-old BALB/cJ Pkd1RC/RC mice (white) versus WT (brown) shows a significant increase in ADPKD mice. Left: Representative flow diagrams. Right: Quantification. (F) CD4+ T cell numbers (% CD45+). (G) CD4+ Treg numbers (FoxP3+; % CD4+). CD4+ T cell numbers increased with monotherapy, with additive effects in Comb. Treg numbers decreased with α–CTLA-4 versus control. (H) Correlation analyses of CD8+ T cell activation and %KW/BW. Left: Data points of individual animals color-coded by severity of fibrotic burden and sized by number of Tregs. Mildest PKD (low %KW/BW, small fibrotic index) correlated with high numbers of activated CD8+ T cells plus low numbers of Tregs. Right: Same correlation plot with data points color-coded by treatment (Supplemental Table 5). (AG) Box plot (25th to 75th percentile and median) with whiskers of 10th and 90th percentiles; single data points are shown. (AD, F, and G) Kruskal-Wallis 1-way ANOVA with multiple-comparison follow-up by controlling for false discovery rate (Benjamini, Krieger, Yekutieli). (E) Nonparametric Mann-Whitney test. (H) Pearson’s correlation using 2-tailed multivariate analyses. *P < 0.05, **P < 0.01, ***P < 0.001. (AD and FH) N = 7–8 mice per group. (E) N = 6–8 mice per genotype. Nonsignificant pairwise comparisons are not shown.
Figure 6
Figure 6. The immune checkpoint proteins CTLA-4|CD80/CD86 are upregulated in ADPKD.
Kidneys of BALB/cJ WT and Pkd1RC/RC mice were harvested at 1 and 6 months of age and analyzed by flow cytometry for expression of CTLA-4 on CD8+ T cells (CD45+TCRβ+CD8+; A and B), CD80 or CD86 on macrophages (CD45+CD19Ly6GCD64+; C and D), and CD80 or CD86 on epithelial cells (CD45EpCAM+APN+; E and F). (A, C, and E) Representative flow diagrams of 1-month-old BALB/cJ WT and Pkd1RC/RC kidneys. (B, D, and F) Quantification of CTLA-4–positive CD8+ T cells (B), CD80/CD86–positive CD64+ macrophages (D), and CD80/CD86–positive epithelial cells (F) as percentage live and percentage parent population comparing WT (brown) with Pkd1RC/RC (white). CTLA-4 or CD80/CD86 expression is significantly upregulated on the respective cell type in Pkd1RC/RC versus WT. (G) Analysis of CD8+ T cells that express PD-1 (blue), CTLA-4 (green), PD-1 and CTLA-4 (yellow), or no immune checkpoint receptor (gray). (H) Analysis of macrophages/epithelial cells that express PD-L1 (blue), CD80/CD86 (green), PD-L1 and CD80/CD86 (yellow), or no immune checkpoint ligand (gray). Few cells coexpress both immune checkpoint proteins on the same cell, suggesting that treatment with antibodies against each immune checkpoint targets different cells. Supplemental Figure 4 contains quantification of CTLA-4 expression on CD4+ T cells and individual CD80 or CD86 expression on macrophages/epithelial cells. (B, D, and F) Box plot (25th to 75th percentile and median) with whiskers of 10th and 90th percentiles; single data points are depicted. (B, D, and FH) Brown-Forsythe 1-way ANOVA with multiple-comparison follow-up by controlling for false discovery rate (Benjamini, Krieger, Yekutieli). Nonsignificant pairwise comparisons are not shown. (G and H) Comparisons are limited to cells expressing neither immune checkpoint protein. *P < 0.05, **P < 0.01. N = 4 BALB/cJ WT; N = 3 BALB/cJ Pkd1RC/RC. Data points are male and female.
Figure 7
Figure 7. CTLA-4|CD80/CD86 immune checkpoint protein expression is increased at cystic lesions of Pkd1RC/RC kidneys and in human ADPKD samples.
(A) Immunofluorescence (IF) labeling of CTLA-4 (left) and CD80 (right) in BALB/cJ WT and Pkd1RC/RC kidneys. Merged IF image is shown; Supplemental Figures 5 and 6 contain single-channel images. CTLA-4 or CD80 (green), T cells/CD3 (red), epithelial cells/E-cadherin (white), nuclei/DAPI (blue). In Pkd1RC/RC but not WT kidneys, T cells stain positive for CTLA-4 and are in proximity to cystic lesions. Pkd1RC/RC sections: T cells positive for CTLA-4 differ from ones positive for PD-1; compared with Figure 2A, serial sections were stained. Cystic epithelial cells stain strongly positive for CD80 in Pkd1RC/RC but not WT kidneys. Asterisks in WT: T cells; asterisks in Pkd1RC/RC: CTLA-4–positive T cells in contact with epithelial cells, CD80-positive interstitial or epithelial cells in contact with T cells. Pkd1RC/RC: 2 separate animals are shown. Scale bars: 50 μm. (B) CD80 expression in immortalized human RCTE cells (PKD1+/+) versus 9-12 cells (PKD1–/–). Band size (kDa) of kidney CD80 correlates with prior publications (72). 9-12 cells have increased levels of CD80 compared with control. Top: Representative Western blot image. Bottom: Quantification of Western blots from 4 independent samples. (C) IHC staining for CD80 in end-stage kidney tissue of 3 ADPKD patients, an ARPKD patient, and a normal human kidney (NHK). 2° only control: kidney tissue slide of an ADPKD patient stained without addition of primary antibody. Scale bars: 100 μm. The tubular/cystic epithelium in ADPKD and ARPKD samples shows increased expression of CD80 compared with CD80 expression in tubules of NHK. Data are presented as mean ± SEM (B); single data points are depicted. An unpaired 2-tailed t test was performed (B). *P < 0.05.

Comment in

References

    1. Bergmann C, et al. Polycystic kidney disease. Nat Rev Dis Primers. 2018;4(1):50. doi: 10.1038/s41572-018-0047-y. - DOI - PMC - PubMed
    1. Cornec-Le Gall E, et al. Genetic complexity of autosomal dominant polycystic kidney and liver diseases. J Am Soc Nephrol. 2018;29(1):13–23. doi: 10.1681/ASN.2017050483. - DOI - PMC - PubMed
    1. Hopp K, et al. Detection and characterization of mosaicism in autosomal dominant polycystic kidney disease. Kidney Int. 2020;97(2):370–382. doi: 10.1016/j.kint.2019.08.038. - DOI - PMC - PubMed
    1. Harris PC, et al. Cyst number but not the rate of cystic growth is associated with the mutated gene in autosomal dominant polycystic kidney disease. J Am Soc Nephrol. 2006;17(11):3013–3019. doi: 10.1681/ASN.2006080835. - DOI - PubMed
    1. Seeger-Nukpezah T, et al. The hallmarks of cancer: relevance to the pathogenesis of polycystic kidney disease. Nat Rev Nephrol. 2015;11(9):515–534. doi: 10.1038/nrneph.2015.46. - DOI - PMC - PubMed

Publication types