Review
. 2023 Jul 11;59(56):8626-8643.
doi: 10.1039/d3cc01319g.

Cloneable inorganic nanoparticles

Affiliations
Review

Cloneable inorganic nanoparticles

Alexander R Hendricks et al. Chem Commun (Camb). .

Abstract

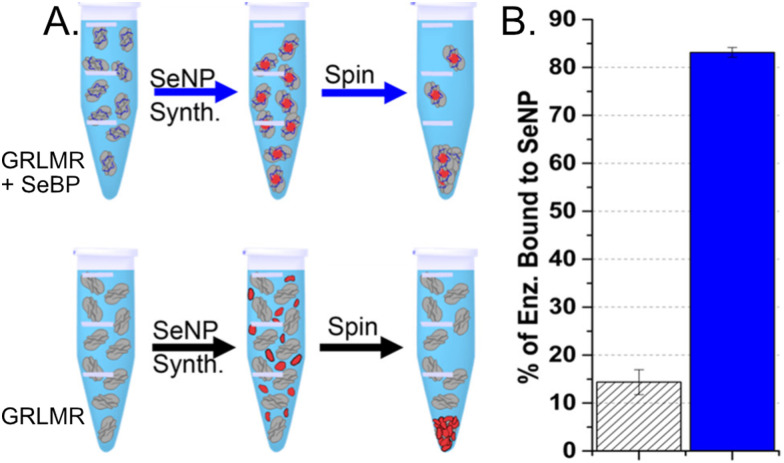
When a defined protein/peptide (or combinations thereof) control and define the synthesis of an inorganic nanoparticle, the result is a cloneable NanoParticle (cNP). This is because the protein sequence/structure/function is encoded in DNA, and therefore the physicochemical properties of the nanoparticle are also encoded in DNA. Thus the cloneable nanoparticle paradigm can be considered as an extension of the central dogma of molecular biology (e.g. DNA → mRNA → protein → cNP); modifications to the DNA encoding a cNP can modify the resulting properties of the cNP. Inorganic ion oxidoreductases (e.g., mercuric reductase, tellurite reductase, etc.) can select and reduce specific inorganic oxyanions and coordination complexes, creating zerovalent precipitates. Other proteins/peptides (often genetically concatenated to the parent oxidoreductase) serve as ligands, directing the size, shape, crystal structure and other properties of the nanoparticle. The DNA encoding a cNP can be recombinantly transferred into any organism. Ideally, this enables recombinant production of cNPs with the same defined physiochemical properties. Such cNPs are of interest for applications ranging from molecular imaging, bio-remediation, catalysis, and biomining. In this Feature Article we detail and define the cNP concept, and retrace the story of our creation of a cloneable Se NanoParticle (cSeNP). We also describe our more preliminary work that we expect to result in cloneable semiconductor quantum dots, cloneable Te nanoparticles, and other cNP formulations. We highlight the application of cNPs in cellular electron microscopy and compare this approach to other cloneable imaging contrast approaches.


Conflict of interest statement

There are no conflicts to declare.

Figures

Fig. 1
Fig. 1. Schematics showing reductive nanoparticle synthesis approaches in vitro (top panel) and in vivo (bottom panel).
Fig. 2
Fig. 2. Panel a shows P. moraviensis stanleyae growing on SeO32− supplemented agar. The red color is indicative of red Se(0) formation as a result of selenite reduction. Panel b shows a TEM image of P. moraviensis stanleyae grown in the presence of selenite. The bacteria appear coated with SeNPs. Figure adapted from (38) with permission.
Fig. 3
Fig. 3. Aerobic growth of P. moraviensis stanleyae in Luria Broth media without Se oxyanions (x), and in the presence of 10 mM selenite (solid circles) and 10 mM SeO42− (open circles). Figure adapted from (38) with permission.
Fig. 4
Fig. 4. Aerobic reduction of SeO42− (open circles) and SeO32− (closed circles) by P. moraviensis stanleyae as a function of time. Figure adapted from (38) with permission.
Fig. 5
Fig. 5. Electron tomographic reconstruction of P. moraviensis stanleyae grown in SeO32− media. The reconstruction was segmented to reveal the outer membrane and SeNPs (panels A–C). Panels D and E show two of the SeNPs at higher magnification. Figure adapted (40) with permission.
Fig. 6
Fig. 6. Non-denaturing gel of soluble proteins from P. moraviensis stanleyae, stained with NADPH and SeO32−. The lanes correspond to fractions eluted from a hydrophobic interaction column at various concentrations of ammonium sulfate. Bands appear where NADPH dependent SeO32− activity is spatially localized. Figure adapted from (40) with permission.
Fig. 7
Fig. 7. Enzyme kinetic assays for GRLMR (panel a) and GSHR (panel c). Lineweaver–Burke plots for GRLMR (panel b) and GSHR (panel d). The drop in rate at high concentrations of GS-Se-SG is attributed to SeNP formation interfering with the optical assay. GSSG indicated by blue circles, GS-Se-SG indicated by red triangles. Figure adapted from (22) with permission. Further permissions related to the material excerpted should be directed to the ACS.
Fig. 8
Fig. 8. Panels a and b show the substrate binding region from yeast and E. coli GSHR crystal structures. Panel c shows the same region for a homology model of GRLMR. The residue shown in red is glutathionylated in panel a. In panel c, the red-colored residue is not capable of being glutathionylated. Figure adapted from ACS Omega 2018, 3, 14902–14909.
Fig. 9
Fig. 9. Panels a–d show SEM images of fixed BL21 E. coli. Panels a and c show cells without the GRLMR plasmid, whereas panels b and d show cells that include the plasmids that are expressing GRLMR. Panels c and d show EDS overlay, where areas that are mapped to Se are colored red. Figure adapted from (22) with permission. Further permissions related to the material excerpted should be directed to the ACS.
Fig. 10
Fig. 10. SEM images of nanoparticles formed using GRLMR-SeBP or GRLMR at indicated concentrations of SeO32−. A histogram of the size distributions is shown where it could be determined. Figure adapted from (46) with permission. Copyright 2020 American Chemical Society.
Fig. 11
Fig. 11. (a) Schematic of the centrifugation assay used to assess enzyme-nanoparticle binding for GRLMR-SeBP (top) and GRLMR (bottom). (b) Percentage of enzyme that remained bound to nanoparticles following centrifugation for GRLMR (diagonal stripe) versus GRLMR-SeBP (blue). Figure adapted from (46) with permission. Copyright 2020 American Chemical Society.
Fig. 12
Fig. 12. V 0 plotted against substrate concentration of GRLMR (black) and GRLMR-SeBP (blue) using (a) HNaSeO3 as a substrate, (b) GSSG as a substrate. Figure adapted from (46) with permission. Copyright 2020 American Chemical Society.
Fig. 13
Fig. 13. (a) Native PAGE gel sections incubated in indicated metal(loid) ions and NADPH. The arrow indicates reduced insoluble TE0 particulate. Cu(ii) was precipitated in gel with and without protein. (b) Proteins associated with the excised Te(0) by LC-MS/MS. Entries in italics indicate the presence of an NAD(P)H binding domain. Figure adapted from (21) with permission.
Fig. 14
Fig. 14. Elemental composition of precipitates resulting from enzymatic reactions in indicated ratios of tellurite and selenite as determined by ICP MS. Figure adapted from (21) with permission.
Fig. 15
Fig. 15. The effect of pH on mycothione reductase substrate selectivity; Y-axis shows initial velocity of mycothione reductase with tellurite or selenite. Each substrate was present at 2 mM. Figure adapted from (21) with permission.
Fig. 16
Fig. 16. (A) Sketch of suggested selenite reduction pathway via GRLMR. Fluorescence can be visualized through UV illumination of particles formed by reduction of Se2+ to Se2− by GRLMR with Cd2+ present in (B) air-free conditions and (C) in atmosphere. Figure adapted from (49) with permission.
Fig. 17
Fig. 17. Tomographic slices of (A) wild-type desmin (B) metallothionein-labeled desmin. Scale bars = 100 nm. Figure adapted from (53) with permission. Copyright 2015 Royal Microscopical Society.
Fig. 18
Fig. 18. (A) Diagram of spc42; the metallothionein tag was added to the C-terminus. (B) Tomographic slices of wild-type spc42. Tomographic slices of Spc42-2x metallothionein (C) incubated with aurothiomalate alone, and (D) first stained with aurothiomalate followed by enhancement with the Nanoprobes gold enhancement kit. Scale bars = 100 nm. Figure adapted from (53) with permission. Copyright 2015 Royal Microscopical Society.
Fig. 19
Fig. 19. Staining of wild-type spc42 during freeze substitution (A) without diglyme treatment and silver enhancement and (B) with diglyme treatment and silver enhancement. Staining is not observed in either condition. Staining of Spc42-2xMTH sections (C) without diglyme and silver enhancement and (D) with diglyme treatment and silver enhancement, which allowed for the detection of particles (D, inset). Scale bars = 100 nm. Figure adapted from (53) with permission. Copyright 2015 Royal Microscopical Society.
Fig. 20
Fig. 20. Papers on the topic of ‘biogenic nanoparticles’ per year, from Web of Science.
None
Alexander R. Hendricks
None
Bradley F. Guilliams
None
Rachel S. Cohen
None
Tony Tien
None
Gavin A. McEwen
None
Kanda M. Borgognoni
None
Christopher J. Ackerson

References

    1. Dieudonné A. Pignol D. Prévéral S. Magnetosomes: Biogenic Iron Nanoparticles Produced by Environmental Bacteria. Appl. Microbiol. Biotechnol. 2019;103(9):3637–3649. doi: 10.1007/s00253-019-09728-9. doi: 10.1007/s00253-019-09728-9. - DOI - DOI - PubMed
    1. Jogler C. Lin W. Meyerdierks A. Kube M. Katzmann E. Flies C. Pan Y. Amann R. Reinhardt R. Schüler D. Toward Cloning of the Magnetotactic Metagenome: Identification of Magnetosome Island Gene Clusters in Uncultivated Magnetotactic Bacteria from Different Aquatic Sediments. Appl. Environ. Microbiol. 2009;75(12):3972–3979. doi: 10.1128/AEM.02701-08. doi: 10.1128/AEM.02701-08. - DOI - DOI - PMC - PubMed
    1. Wang Q. Mercogliano C. P. Löwe J. A Ferritin-Based Label for Cellular Electron Cryotomography. Structure. 2011;19(2):147–154. doi: 10.1016/j.str.2010.12.002. doi: 10.1016/j.str.2010.12.002. - DOI - DOI - PubMed
    1. Clarke N. I. Royle S. J. FerriTag Is a New Genetically-Encoded Inducible Tag for Correlative Light-Electron Microscopy. Nat. Commun. 2018;9(1):2604. doi: 10.1038/s41467-018-04993-0. doi: 10.1038/s41467-018-04993-0. - DOI - DOI - PMC - PubMed
    1. Jiang B. Fang L. Wu K. Yan X. Fan K. Ferritins as Natural and Artificial Nanozymes for Theranostics. Theranostics. 2020;10(2):687–706. doi: 10.7150/thno.39827. doi: 10.7150/thno.39827. - DOI - DOI - PMC - PubMed

MeSH terms