

A novel signature incorporating lipid metabolism- and immune-related genes to predict the prognosis and immune landscape in hepatocellular carcinoma
- PMID: 37346073
- PMCID: PMC10279962
- DOI: 10.3389/fonc.2023.1182434
A novel signature incorporating lipid metabolism- and immune-related genes to predict the prognosis and immune landscape in hepatocellular carcinoma
Abstract
Background: Liver hepatocellular carcinoma (LIHC) is a highly malignant tumor with high metastasis and recurrence rates. Due to the relation between lipid metabolism and the tumor immune microenvironment is constantly being elucidated, this work is carried out to produce a new prognostic gene signature that incorporates immune profiles and lipid metabolism of LIHC patients.
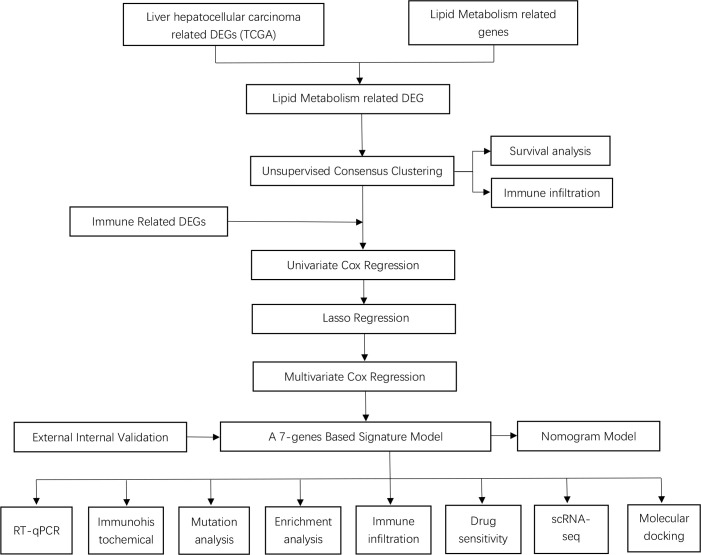
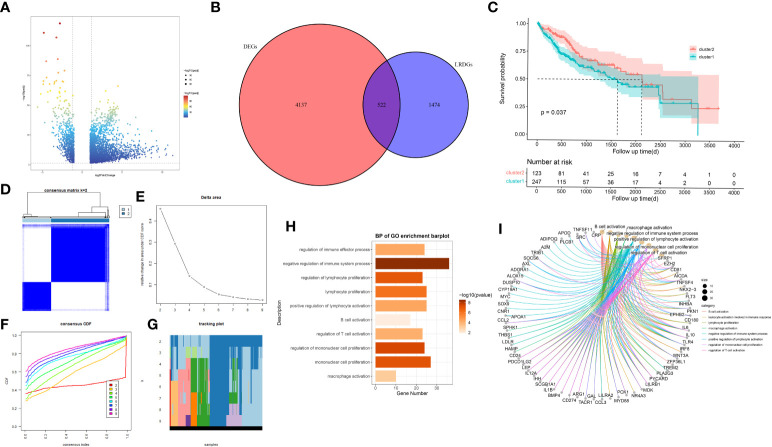
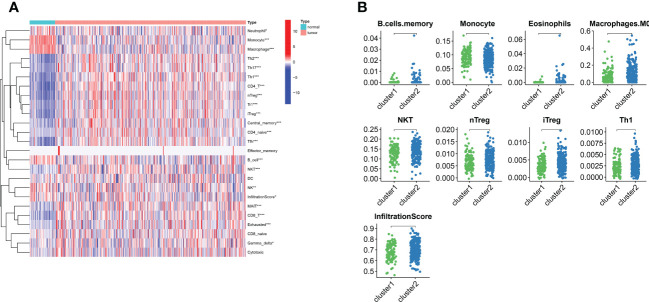
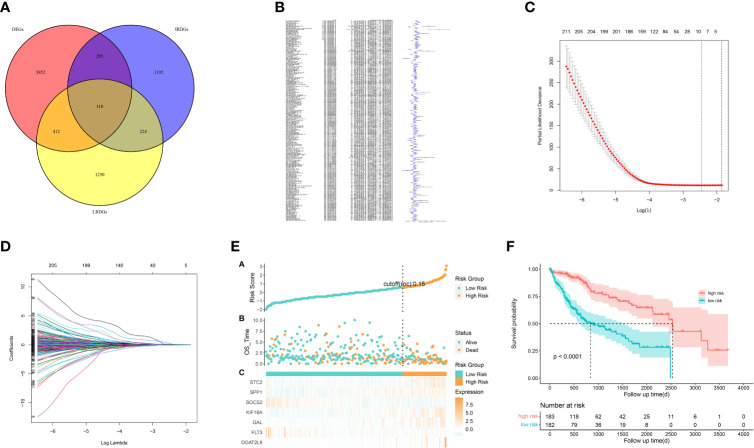
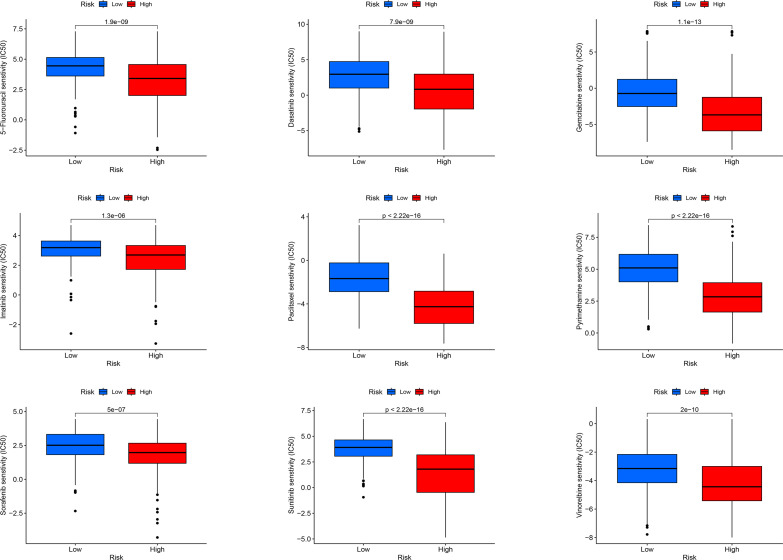
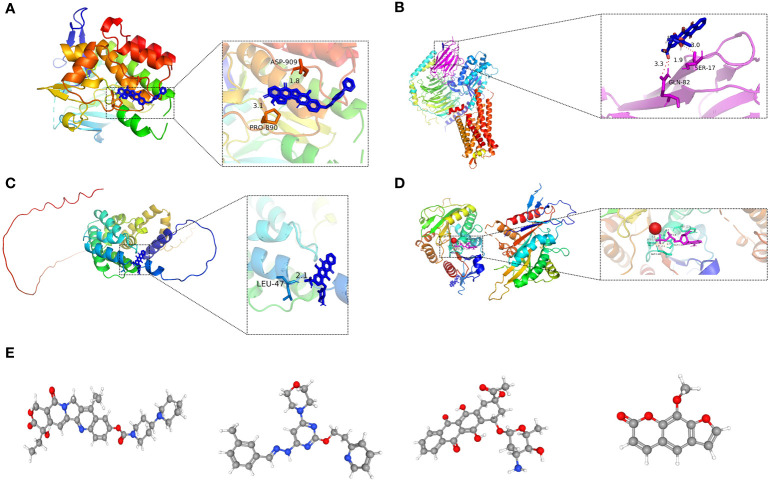
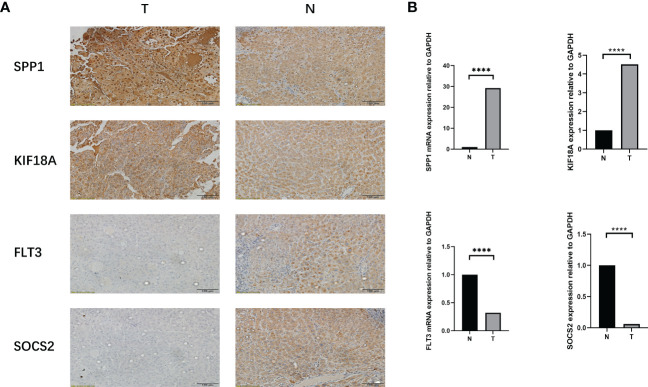
Methods: We used the "DEseq2" R package and the "Venn" R package to identify differentially expressed genes related to lipid metabolism (LRDGs) in LIHC. Additionally, we performed unsupervised clustering of LIHC patients based on LRDGs to identify their subgroups and immuno-infiltration and Gene Ontology (GO) enrichment analysis on the subgroups. Next, we employed multivariate, LASSO and univariate Cox regression analyses to determine variables and to create a prognostic profile on the basis of immune- and lipid metabolism-related differential genes (IRDGs and LRDGs). We separated patients into low- and high-risk groups in accordance with the best cut-off value of risk score. We conducted Decision Curve Analysis (DCA), Receiver Operating Characteristic curve analysis as a function of time as well as Survival Analysis to evaluate this signature's prognostic value. We incorporated the clinical characteristics of patients into the risk model to obtain a nomogram prognostic model. GEO14520 and ICGC-LIRI JP datasets were employed to externally confirm the accuracy and robustness of signature. The gene set variation analysis (GSVA) and gene set enrichment analysis (GSEA) were applied for investigating the underlying mechanisms. Immune infiltration analysis was implemented to examine the differences in immune between both risk groups. Single-cell RNA sequencing (scRNA-SEQ) was utilized to characterize the genes that were involved in the distribution of signature and expression characteristics of different LIHC cell types. The patients' sensitivity in both risk groups to commonly used chemotherapeutic agents and semi-inhibitory concentrations (IC50) of the drugs was assessed using the GDSC database. On the basis of the differentially expressed genes (DEGs) in the two groups, the CMAP database was adopted for the prediction of potential small-molecule compounds. Small-molecule compounds were molecularly docked with prognostic markers. Lastly, we investigated the prognostic gene expression levels in normal and LIHC tissues with immunohistochemistry (IHC) and quantitative reverse transcription polymerase chain reaction(qRT-PCR).
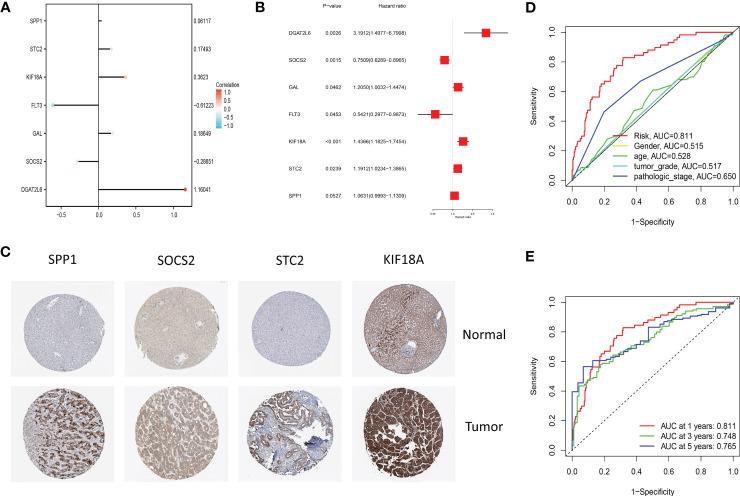
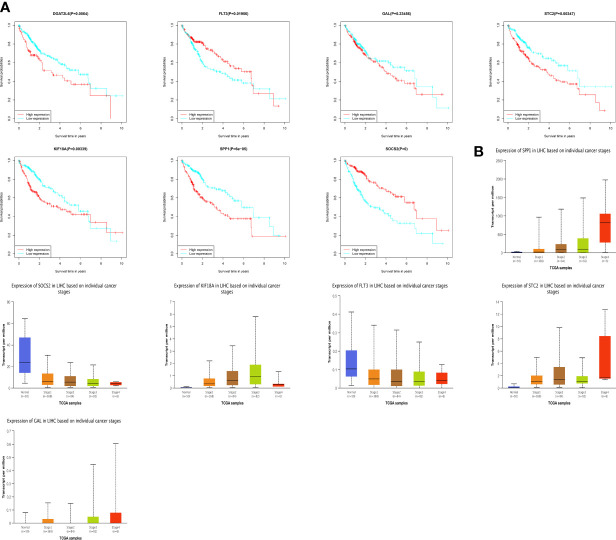
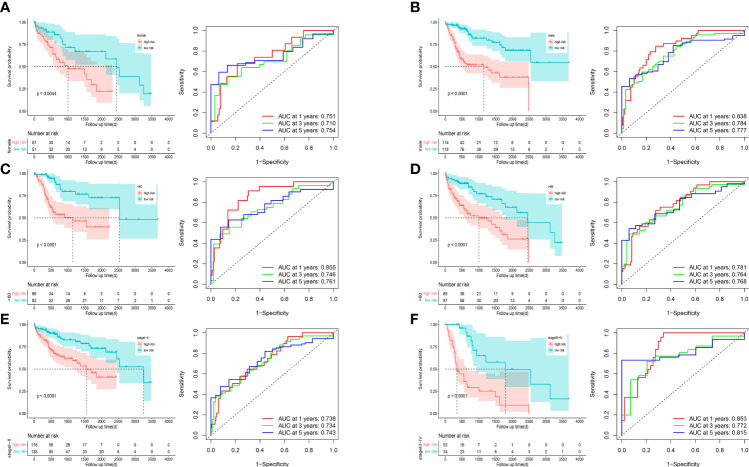
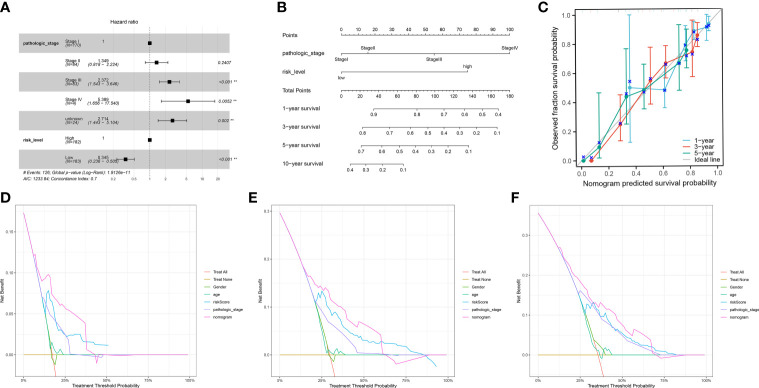
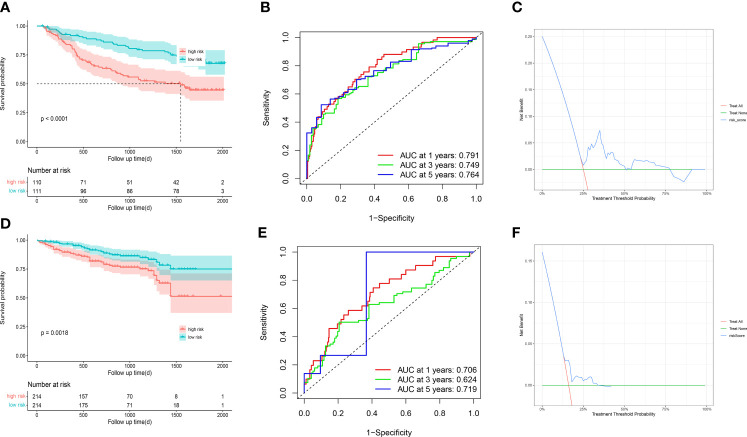
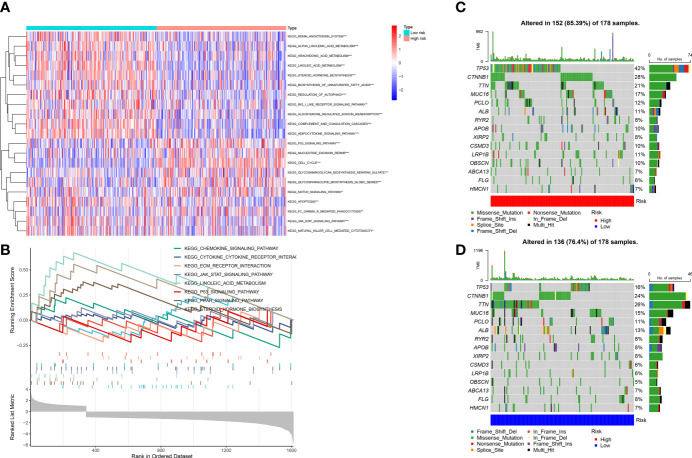
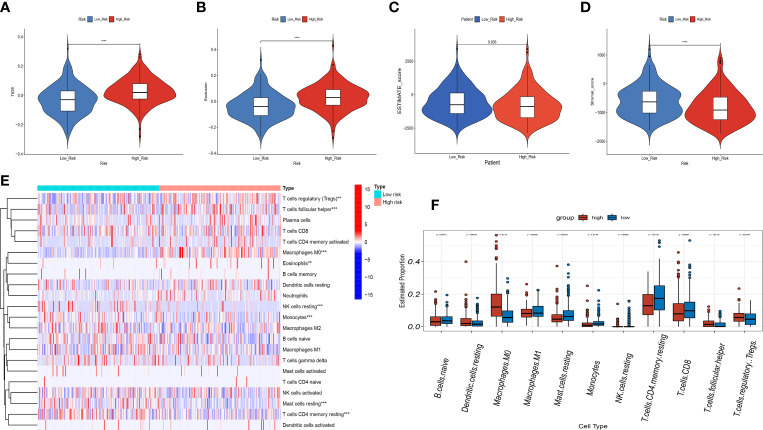
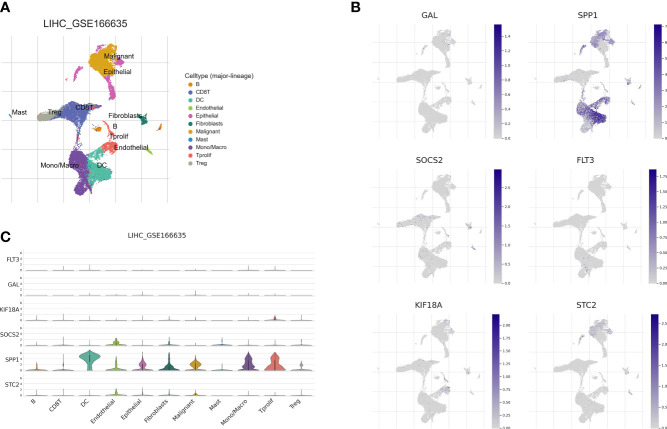
Results: We built and verified a prognostic signature with seven genes that incorporated immune profiles and lipid metabolism. Patients were classified as low- and high-risk groups depending on their prognostic profiles. The overall survival (OS) was markedly lower in the high-risk group as compared to low-risk group. Time-dependent ROC curves more precisely predicted patients' survival at 1, 3 and 5 years; the area under the ROC curve was 0.81 (1 year), 0.75 (3 years) and 0.77 (5 years). The DCA curves showed the value of the prognostic genes in this signature for clinical applications. We included the patients' clinical characteristics in the risk model for both multivariate and univariate Cox regression analyses, and the findings revealed that the risk model represents an independent factor that influences OS in LIHC patients. With immune analysis, GSVA and GSEA, we identified that there are remarkable differences between the two risk groups in immune pathways, lipid metabolism, tumor development, immune cell infiltration and immune microenvironment, response to immunotherapy, and sensitivity to chemotherapy. Moreover, those with higher risk scores presented greater sensitivity to the chemotherapeutic agents. Experiments in vitro further elucidated the roles of SPP1 and FLT3 in the LIHC immune microenvironment. Furthermore, four small-molecule drugs that could target LIHC were screened. In vitro qRT-PCR , IHC revealed that the SPP1,KIF18A expressions were raised in LIHC in tumor samples, whereas FLT3,SOCS2 showed the opposite trend.
Conclusions: We developed and verified a new signature comprising immune- and lipid metabolism-associated markers and to assess the prognosis and the immune status of LIHC patients. This signature can be applied to survival prediction, individualized chemotherapy, and immunotherapeutic guidance for patients with liver cancer. This study also provides potential targeted therapeutics and novel ideas for the immune evasion and progression of LIHC.
Keywords: individualized chemotherapy; lipid metabolism; liver hepatocellular carcinoma; prognostic gene signature; survival prediction; targeted chemotherapy; tumor immune microenvironment.
Copyright © 2023 Yang, Luo, Liu, Liu, Ma, Liu, LI, Wen, Chen and Zeng.
Conflict of interest statement
The research was conducted in the absence of any commercial or financial relationships that could be construed as a potential conflict of interest.
Figures
Similar articles
-
Construction of a novel choline metabolism-related signature to predict prognosis, immune landscape, and chemotherapy response in colon adenocarcinoma.Front Immunol. 2022 Nov 14;13:1038927. doi: 10.3389/fimmu.2022.1038927. eCollection 2022. Front Immunol. 2022. PMID: 36451813 Free PMC article.
-
Comprehensive analysis of a novel signature incorporating lipid metabolism and immune-related genes for assessing prognosis and immune landscape in lung adenocarcinoma.Front Immunol. 2022 Aug 25;13:950001. doi: 10.3389/fimmu.2022.950001. eCollection 2022. Front Immunol. 2022. PMID: 36091041 Free PMC article.
-
Development and validation of multi-omic prognostic signature of anoikis-related genes in liver hepatocellular carcinoma.Medicine (Baltimore). 2023 Nov 17;102(46):e36190. doi: 10.1097/MD.0000000000036190. Medicine (Baltimore). 2023. PMID: 37986299 Free PMC article.
-
Proposing a novel molecular subtyping scheme for predicting distant recurrence-free survival in breast cancer post-neoadjuvant chemotherapy with close correlation to metabolism and senescence.Front Endocrinol (Lausanne). 2023 Oct 12;14:1265520. doi: 10.3389/fendo.2023.1265520. eCollection 2023. Front Endocrinol (Lausanne). 2023. PMID: 37900131 Free PMC article. Review.
-
Phosphorus Metabolism-Related Genes Serve as Novel Biomarkers for Predicting Prognosis in Bladder Cancer: A Bioinformatics Analysis.Iran J Public Health. 2024 Sep;53(9):1935-1950. doi: 10.18502/ijph.v53i9.16449. Iran J Public Health. 2024. PMID: 39429662 Free PMC article. Review.
Cited by
-
Efficacy of photodynamic therapy using hematoporphyrin derivative nanomedicine on hepatocellular carcinoma cells.J Cancer. 2024 Sep 3;15(17):5594-5604. doi: 10.7150/jca.97637. eCollection 2024. J Cancer. 2024. PMID: 39308685 Free PMC article.
-
Role of ACSL4 in modulating farnesoid X receptor expression and M2 macrophage polarization in HBV-induced hepatocellular carcinoma.MedComm (2020). 2024 Sep 12;5(9):e706. doi: 10.1002/mco2.706. eCollection 2024 Sep. MedComm (2020). 2024. PMID: 39268355 Free PMC article.
-
Immunotherapy and drug sensitivity predictive roles of a novel prognostic model in hepatocellular carcinoma.Sci Rep. 2024 Apr 25;14(1):9509. doi: 10.1038/s41598-024-59877-9. Sci Rep. 2024. PMID: 38664521 Free PMC article.
References
LinkOut - more resources
Full Text Sources
Research Materials
Miscellaneous