. 2023 Jun 6:17:1179796.
doi: 10.3389/fncel.2023.1179796. eCollection 2023.

Moderate intrinsic phenotypic alterations in C9orf72 ALS/FTD iPSC-microglia despite the presence of C9orf72 pathological features

Affiliations

Moderate intrinsic phenotypic alterations in C9orf72 ALS/FTD iPSC-microglia despite the presence of C9orf72 pathological features

Ileana Lorenzini et al. Front Cell Neurosci. .

Abstract

While motor and cortical neurons are affected in C9orf72 amyotrophic lateral sclerosis and frontotemporal dementia (ALS/FTD), it remains largely unknown if and how non-neuronal cells induce or exacerbate neuronal damage. We differentiated C9orf72 ALS/FTD patient-derived induced pluripotent stem cells into microglia (iPSC-MG) and examined their intrinsic phenotypes. Similar to iPSC motor neurons, C9orf72 ALS/FTD iPSC-MG mono-cultures form G4C2 repeat RNA foci, exhibit reduced C9orf72 protein levels, and generate dipeptide repeat proteins. Healthy control and C9orf72 ALS/FTD iPSC-MG equally express microglial specific genes and perform microglial functions, including inflammatory cytokine release and phagocytosis of extracellular cargos, such as synthetic amyloid beta peptides and healthy human brain synaptoneurosomes. RNA sequencing analysis revealed select transcriptional changes of genes associated with neuroinflammation or neurodegeneration in diseased microglia yet no significant differentially expressed microglial-enriched genes. Moderate molecular and functional differences were observed in C9orf72 iPSC-MG mono-cultures despite the presence of C9orf72 pathological features suggesting that a diseased microenvironment may be required to induce phenotypic changes in microglial cells and the associated neuronal dysfunction seen in C9orf72 ALS/FTD neurodegeneration.

Keywords: C9orf72; amyotrophic lateral sclerosis; frontotemporal dementia; iPSC-microglia; neuroinflammation.


Conflict of interest statement

The authors declare that the research was conducted in the absence of any commercial or financial relationships that could be construed as a potential conflict of interest.

Figures
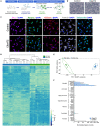
Figure 1
Figure 1
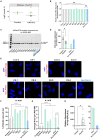
Healthy control and mutant C9orf72 ALS/FTD patient iPSC lines differentiate into mature microglia. (A) Schematic illustration of iPSC-MG differentiation protocol. (B) Phase contrast images of mature iPSC-MG differentiated from healthy control and C9orf72 ALS/FTD iPSCs (DIV 40). The representative images show typical ramified microglia morphology in both experimental groups. Scale bar, 120 μm. (C) Representative immunofluorescence of DIV 40 control (n = 3) and C9orf72 ALS/FTD iPSC-MG (n = 3–5) stained for myeloid transcription factor PU.1 and microglia specific markers such as purinergic surface receptor P2ry12, C-X3-C Motif Chemokine Receptor 1 (Cx3cr1), triggering receptor expressed on myeloid cells 2 (TREM2), and the transmembrane protein 119 (TMEM119). For quantification of marker protein expression/percentage of DAPI-positive cells, see Supplementary Figure S1A. For quantitative marker gene expression levels, see Supplementary Figure S1B. Scale bar, 20 μm. (D) Heatmap of the iPSC-MG (control, n = 4 cell lines with 1–2 differentiations each and C9orf72 ALS/FTD, n = 7 cell lines with 1–2 differentiations each) and iPSC-CN (n = 12 cell lines with 1-3 differentiations each) transcriptome demonstrating distinct gene expression profiles between the two cell populations. All iPSC-MG and iPSC-CN samples were normalized together by DESeq2 and Z-score scaled. (E) Principal component analysis of the RNA-seq expression data revealed a highly similar gene expression profile within both iPSC-MG (green cluster) and iPSC-CN (blue cluster) and confirmed these populations as distinct from each other (PC1, 94.87% variance; PC2, 1.66% variance). (F) Normalized counts for genes associated with microglia, astrocytes, oligo-precursor cells (OPC), oligodendrocytes, neurons, endothelial cells, and pericytes within the iPSC-MG population (Control n = 4 lines; C9orf72 ALS/FTD n = 7 lines). Bar graphs are presented as mean ± SD.
Figure 2
Figure 2
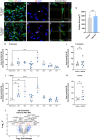
RNA sequencing analyses revealed minor transcriptional changes in mono-cultures of C9orf72 ALS/FTD iPSC-MG and postmortem brain tissues of C9orf72 ALS/FTD patients. (A) Volcano plot showing differentially expressed transcripts between healthy control (n = 4) and C9orf72 ALS/FTD (n = 7) from the full iPSC-MG transcriptome (unadjusted p-value < 0.005; log2 fold change (FC) ± 1). Using these selection criteria, 20 genes were found to be differentially expressed in C9orf72 ALS/FTD iPSC-MG. (B) Volcano plot of differentially expressed microglial-enriched transcripts (total of 881) indicates that there are no significant expression changes of these particular genes in mono-cultures of C9orf72 ALS/FTD iPSC-MG (n = 7) compared to healthy control (n = 4) (unadjusted p-value <0.005; log2 fold change (FC) ± 1). (C, D) Differentially expressed microglia-enriched transcripts in postmortem brain tissues from the frontal cortex (control n = 16; C9orf72 ALS/FTD n = 8) and motor cortex (control n = 15; C9orf72 ALS/FTD n = 12) from the Target ALS dataset. Volcano plots show 12 differentially expressed microglia transcripts in C9orf72 ALS/FTD for frontal cortex (C) and 14 for motor cortex (D) when compared to controls (unadjusted p-value <0.05; log2 fold change (FC) ± 1).
Figure 3
Figure 3
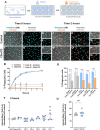
C9orf72 ALS/FTD iPSC-MG exhibit reduced C9orf72 protein expression, present intranuclear HRE-associated RNA foci, and produce poly-(GP) DPR protein. (A) Dot plot showing C9orf72 level of expression as log2 (counts +1) in control and C9orf72 ALS/FTD iPSC-MG (Control, n = 4 lines; C9orf72, n = 7 lines; multiple differentiations per line are shown as individual data points; Student's t-test). (B) Relative human C9orf72 mRNA expression performed by qRT-PCR in control and C9orf72 ALS/FTD iPSC-MG (normalized expression to beta-2-microglobulin (B2M) in control, n = 3 lines, n = 1–4 differentiations per line; C9orf72, n = 6 lines, n = 1–3 differentiations per line; Student's t-test). (C) Western blot analysis shows a reduction in human C9orf72 protein expression in C9orf72 ALS/FTD iPSC-MG. The 54 kDa C9orf72 protein band and 42 kDa actin protein band were used as a loading control (control, n = 4 lines, including an isogenic control-4, n = 1–2 differentiation per line; C9orf72, n = 5 lines, n = 1–2 differentiation per line). Bone marrow-derived macrophages (BMDM) from a C9orf72 knockout mouse were used to validate the antibody used for the Western blot analysis. (D) Quantification of C9orf72 Western blot analysis revealed a significant reduction in C9orf72 protein levels (C9orf72 protein expression normalized to actin; control, 197.4, n = 4 lines, n = 1–2 differentiation per line; C9orf72, 112.1, n = 5 lines, n = 1–2 differentiation per line; p-value = 0.0115; Student's t-test, *p ≤ 0.05). Blue dots in the bar graph represent C9-4 and its isogenic pair. (E) Representative images of control and C9orf72 iPSC-MG treated with scramble or C9orf72-(G4C2)6 R-HCR initiator probes. Images show the presence of repeat-associated RNA foci in C9orf72 ALS/FTD iPSC-MG. Scale bar = 20 μm. (F) Quantification of the percentage of iPSC-MG with detectable G4C2 RNA foci. A significant difference was observed for all C9 iPSC-MG lines when compared to control lines, including C9-4 as compared with corrected isogenic line 4 (control, n = 3 lines, including an isogenic control-4; C9orf72, n = 4 lines, one-way ANOVA followed by Tukey's multiple comparison test, ****p ≤ 0.0001). (G) Quantification of RNA foci number per iPSC-MG cell line. The evident increase in RNA foci number in C9 iPSG-MG when compared to control lines (control, n = 3 lines, including an isogenic control-4; C9orf72, n = 4 lines, one-way ANOVA followed by Tukey's multiple comparison test, ****p < 0.0001). (H) A significant increase in intracellular levels of poly-(GP) was detected in C9orf72 ALS/FTD iPSC-MG using an ELISA assay (relative abundance of poly-(GP) in control, 5.46, n = 3 lines; C9orf72, 46.18, n = 7 lines, p = 0.0167, two-tailed Mann–Whitney test). Data are presented as Median ± SEM for C9orf72 level expression. Exact significant p-values are reported in the figure legend. ****p ≤ 0.0001, *p ≤ 0.05.
Figure 4
Figure 4
C9orf72 ALS/FTD and healthy control iPSC-MG show equal response to LPS stimulation. (A–D) Cytokine/chemokine profile analysis of iPSC-MG using the U-plex Multiplex Assay. C9orf72 ALS/FTD iPSC-MG mono-cultures respond with an increase in IL1α, IL6, and TNFα inflammatory cytokines similar to controls (see Supplementary Figures S5A–D for response per replicate within a sample). Data presented as the average concentration of secreted proteins (pg/ml), Mean ± SEM, n = 4 control lines, 2–3 replicates; n = 3 C9orf72 lines, three replicates. P-values displayed in the graphs; *p ≤ 0.05; two-way ANOVA followed by Tukey's Test and post hoc analysis. (E) Volcano plot showing differentially expressed genes in C9orf72 ALS/FTD (n = 4) from 6 h LPS stimulation when compared to healthy control (n = 5) (Log2 fold change (FC) ± 1, p-value <0.005; see Supplementary Figure S5E).
Figure 5
Figure 5
C9orf72 ALS/FTD iPSC-MGs show increased phagocytosis of synthetic Aβ (1–40) in select patient lines. (A, D) Representative images of healthy controls and C9orf72 ALS/FTD iPSC-MG stained for TREM2 (green) and highlighting Aβ (1–40) TAMRA (red) inside the cells at 30 min. White arrow point at phagocytic cells containing Aβ (1–40) TAMRA (red). Scale bar, 20 μm. (B, E) Aβ (1–40) TAMRA (red) internalized by healthy controls and C9orf72 ALS/FTD iPSC-MG. Scale bar, 20 μm. (C, F) Extended view showing phagocytic activity in both iPSC-MG groups. Scale bar, 20 μm. (G) No significant differences in the microglia cell surface area were observed upon Aβ exposure (control, n = 5 lines; C9orf72, n = 6 lines; n = 1–2 differentiations per line; 2–3 replicates; 6–7 pictures per replicate; n = 6–10 cells per picture; p = 0.58 using Student's t-test). (H–K) Select patient lines showed significant differences in the percentage of cell surface area covered by Aβ (1–40)-TAMRA after 5 min (1 out of 7 lines) or 1 h (3 out of 7 lines) (control, n = 6 lines; C9orf72, n = 7 lines; n = 1–2 differentiations per line; 2–3 replicates; 6–7 images per replicate; n = 6–10 cells per image). One-way ANOVA followed by a Dunnett's post hoc correction was performed, **p ≤ 0.01; ***p ≤ 0.001; ****p ≤ 0.0001. Note: when grouped, no significance was observed at either time point; therefore, the Student's t-test was performed. (L) Differentially expressed genes from C9orf72 ALS/FTD Aβ (1–40) treated iPSC-MG (control, n = 5 lines; C9orf72, n = 4 lines; Log2 fold change (FC) ± 1, p < 0.005; see Supplementary Figure S6E).
Figure 6
Figure 6
Phagocytic uptake of human brain synaptoneurosomes by iPSC-MGs. (A) Illustration of iPSC-MGs treated with human brain synaptoneurosomes. Cultured control and C9orf72 ALS/FTD iPSC-MGs (Day 40) are plated onto fibronectin-coated slides and labeled with Hoechst nuclear marker followed by hSN-rodo treatment ± 10 μM Cytochalasin D (actin polymerization inhibitor). (B–I) Control and C9orf72 ALS/FTD iPSC-MG images were taken at 0 h time point. IPSC-MGs labeled with live nuclear stain Hoechst (cyan) and exposed to hSN-rodo (orange). Differential interference images (DIC) enhance the visualization of individual iPSC-MG morphology (B, F). No evident phagocytosis of hSN-rodo is seen at this time point (C, G). Scale bars = 50 μm. Higher magnification representative images at 0 h time point of control (D, E) and C9orf72 ALS/FTD iPSC-MGs (H, I). Scale bars = 10 μm. (J–Q) Representative images of control and C9orf72 ALS/FTD iPSC-MG at 2 h show an increase in hSN-rodo fluorescent signal inside iPSC-MG indicative of phagocytosis and uptake into intracellular acidic compartments. Scale bar = 40 μm. (L, M, P, Q) Higher magnification representative images highlighting the increase in hSN-rodo signal in individual iPSC-MG at 2 h. Scale bar = 10 μm. (R) Percentage of iPSC-MG engulfing hSN-rodo during the 6 h initial time course of live imaging. At 2 h, control and C9orf72 iPSC-MG showed 69% and 71% phagocytic activity, respectively. No significant differences in synaptoneurosome uptake were observed between groups. Approximately 10 uM cytochalasin D, an actin polymerization inhibitor, was used as a negative control to inhibit phagocytic activity in iPSC-MGs (For 6 h initial time course; control, n = 1 line; C9orf72, n = 2 lines; 3 replicates; n = 6 images/replicates/time points; n = 8 cells per image for hSN-rodo; for cytochalasin D, n = 6 images/groups/time points; n = 10 cells per image). (S) Percentage of iPSC-MG engulfing hSN-rodo at 2 h time point with cytochalasin D treatment. A significant decrease in phagocytic activity was observed in controls and C9orf72 ALS/FTD iPSC-MG in the presence of cytochalasin D (Cyto-D, control, n = 2 lines; C9orf72, n = 3 lines, n =6 images/group; ****p ≤ 0.0001 using Student's t-test). (T, U) HSN-rodo mean intensity per cell normalized to average control at 2 h (control, n = 7 lines; C9orf72, n = 6 lines; 3 replicates; 6–7 images per replicate; n = 6–10 cells per image). Each iPSC-MG line was normalized and compared to the average controls. One-way ANOVA statistical analysis showed no significant differences in phagocytosis of control human brain synaptoneurosomes between groups. Student's t-test showed no significant differences when grouped. Data presented as Mean intensity ± SEM.

References

    1. Abud E. M., Ramirez R. N., Martinez E. S., Healy L. M., Nguyen C. H. H., Newman S. A., et al. . (2017). iPSC-derived human microglia-like cells to study neurological diseases. Neuron 94, 278-293 e9. 10.1016/j.neuron.2017.03.042 - DOI - PMC - PubMed
    1. Abutbul S., Shapiro J., Szaingurten-Solodkin I., Levy N., Carmy Y., Baron R., et al. . (2012). TGF-beta signaling through SMAD2/3 induces the quiescent microglial phenotype within the CNS environment. Glia 60, 1160–1171. 10.1002/glia.22343 - DOI - PubMed
    1. Al-Sarraj S., King A., Troakes C., Smith B., Maekawa S., Bodi I., et al. . (2011). p62 positive, TDP-43 negative, neuronal cytoplasmic and intranuclear inclusions in the cerebellum and hippocampus define the pathology of C9orf72-linked FTLD and MND/ALS. Acta Neuropathol. 122, 691–702. 10.1007/s00401-011-0911-2 - DOI - PubMed
    1. Amick J., Roczniak-Ferguson A., erguson S. M. (2016). C9orf72 binds SMCR8, localizes to lysosomes, and regulates mTORC1 signaling. Mol. Biol. Cell 27, 3040–3051. 10.1091/mbc.e16-01-0003 - DOI - PMC - PubMed
    1. Amick J., Tharkeshwar A. K., Talaia G., Ferguson S. M. (2020). PQLC2 recruits the C9orf72 complex to lysosomes in response to cationic amino acid starvation. J. Cell Biol. 219. 10.1083/jcb.201906076 - DOI - PMC - PubMed