. 2022 Nov 28;11(24):12746-12758.
doi: 10.1039/d2ta07686a. eCollection 2023 Jun 20.

The role of ion solvation in lithium mediated nitrogen reduction

Affiliations

The role of ion solvation in lithium mediated nitrogen reduction

O Westhead et al. J Mater Chem A Mater. .

Abstract

Since its verification in 2019, there have been numerous high-profile papers reporting improved efficiency of lithium-mediated electrochemical nitrogen reduction to make ammonia. However, the literature lacks any coherent investigation systematically linking bulk electrolyte properties to electrochemical performance and Solid Electrolyte Interphase (SEI) properties. In this study, we discover that the salt concentration has a remarkable effect on electrolyte stability: at concentrations of 0.6 M LiClO4 and above the electrode potential is stable for at least 12 hours at an applied current density of -2 mA cm-2 at ambient temperature and pressure. Conversely, at the lower concentrations explored in prior studies, the potential required to maintain a given N2 reduction current increased by 8 V within a period of 1 hour under the same conditions. The behaviour is linked more coordination of the salt anion and cation with increasing salt concentration in the electrolyte observed via Raman spectroscopy. Time of flight secondary ion mass spectrometry and X-ray photoelectron spectroscopy reveal a more inorganic, and therefore more stable, SEI layer is formed with increasing salt concentration. A drop in faradaic efficiency for nitrogen reduction is seen at concentrations higher than 0.6 M LiClO4, which is attributed to a combination of a decrease in nitrogen solubility and diffusivity as well as increased SEI conductivity as measured by electrochemical impedance spectroscopy.


Conflict of interest statement

The authors declare no conflicts of interest.

Figures
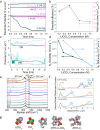
Fig. 1
Fig. 1. (a) The change in working electrode (WE, molybdenum foil coated with in situ deposited LixNyHz) stability with LiClO4 concentration. A constant current density of −2 mA cm−2 is applied until −10C is passed. Stability occurs at 0.6 M LiClO4, where the counter electrode (CE, platinum mesh) potential also settles at a lower value. WE and CE potentials reported vs. the observed lithium plating potential and corrected for ohmic losses. A Pt wire is used as a pseudo-reference. The electrolyte is varying concentrations of LiClO4 in THF containing of 1% v/v EtOH as a sacrificial proton donor. Further experimental details can be found in the ESI (Fig. S2–S4†) (b) The change in faradaic efficiency and yield rate with LiClO4 concentration (n = 3 separate experiments, error bar is standard error in the mean) for a chronopotentiometry experiment at an applied constant current of −2 mA cm−2 until −10C is passed. (c) The extended operation of a 0.6 M LiClO4 electrolyte. Potential reported vs. the observed lithium plating potential and corrected for ohmic losses. Two other greyed out traces are shown to indicate the reproducibility of the experiment. −2 mA cm−2 was applied for 12 hours. (d) The change in N2 solubility and diffusivity in THF at different concentrations of LiClO4. Solubility and diffusivity were measured using N2 absorption with a porosity analyser. See ESI section 8 and Fig. S7 for full experimental details. (e) Simulated and experimental Raman spectra of various co-ordination geometries of LiClO4 in THF. Simulated spectra are obtained using Density Functional Theory (DFT). See ESI part 9 for details on DFT calculations. (f) Theoretical Radial Distribution Functions (RDFs) for lithium in 0.5 M, 1 M and 1.5 M LiClO4 concentrations in THF. The RDFs were obtained using ab initio molecular dynamics, as explained in ESI part 9. (g) Space filling diagrams of LiClO4, THF, ClO4 and the 4THF–Li and 3THF–Li–ClO4 clusters. DFT data set can be found in ref. .
Fig. 2
Fig. 2. X-ray photoelectron spectroscopy spectra of a Cu working electrode after passing 10C at −2 mA cm−2 under N2 for 0.2 M, 0.6 M and 1 M LiClO4 in 99 : 1 THF : EtOH electrolyte. All spectra are normalised to the maximum value for that spectrum. Therefore, all intensities are relative rather than absolute. (a) Cl 2p, (b) Li 1s, (c) C 1s, (d) how the relative atomic concentration of O, Li, C and Cl change as electrolyte salt concentration varies according to XPS. The O 1s core level had no clear features (see Fig. S9†). The N 1s core level was too low intensity to be observable.
Fig. 3
Fig. 3. Comparison of the ToF-SIMS traces for the 0.2 M, 0.6 M, and 1 M LiClO4 samples on a Cu working electrode after passing −10C under N2 at −2 mA cm−2. (a–c) Cl species for 0.2, 0.6, and 1 M samples, (d–f) Li species for 0.2, 0.6, and 1 M samples, (g–i) C species for 0.2, 0.6, and 1 M samples and (j–l) N and H species for 0.2, 0.6, and 1 M samples. All traces normalised to total counts point-to-point. The traces are shown from the surface of the SEI (0 μm) to the Cu surface of that sample. Sputtering was done with Ar+ clusters (n = 1159). Depth is estimated using the crater depth and assuming a constant sputter rate. Crater depth was measured using an optical interferometer. Full experimental details can be found in the ESI section 4b.
Fig. 4
Fig. 4. Time-of-flight secondary ion mass spectrometry depth profiles of a Cu working electrode after passing 10C at −2 mA cm−2 under N2 for 0.2 M, 0.6 M and 1 M LiClO4 in 99 : 1 THF : EtOH electrolyte. All intensities are normalised to total counts point-to-point. The relative depth parameter represents the depth through the SEI, where 0% is the surface of the sample and 100% is the completed removal of the SEI. The 0.2 M SEI sample was approximately 0.5 μm thick, the 0.6 M SEI sample was approximately 2.8 μm thick and the 1 M SEI sample was approximately 3.3 μm thick. (a) Shows the change in the Li signal with relative depth, (b) shows the change in Cl signal with relative depth, (c) shows the change in O signal with relative depth, and (d) shows the change in C signal with relative depth. Sputtering was done with Arn+ clusters (n = 1159), which is more gentle than single Ar+ ions. Full experimental details can be found in the ESI section 4b.
Fig. 5
Fig. 5. Potentiostatic electrochemical impedance spectroscopy spectra of the same Cu electrodes examined for Fig. 2–4 at the end of a choronopotentiometry experiment. All spectra were recorded between 200 kHz and 100 mHz at an amplitude of 10 mV about open circuit potential, which is approximately 0 V vs. Li/Li+. In general, the spectra became noisier at lower frequencies so some data points at lower frequencies were omitted. (a) 0.2 M LiClO4 electrolyte, (b) 0.6 M LiClO4 electrolyte, (c) 1 M LiClO4 electrolyte. Fitting parameters shown in ESI Table S3.

References

    1. Morlanés N. Katikaneni S. P. Paglieri S. N. et al., A technological roadmap to the ammonia energy economy: Current state and missing technologies. Chem. Eng. J. 2021;408:127310. doi: 10.1016/j.cej.2020.127310. - DOI
    1. Seh Z. W. Kibsgaard J. Dickens C. F. et al., Combining theory and experiment in electrocatalysis: Insights into materials design. Science. 2017;355:eaad4998. doi: 10.1126/science.aad4998. - DOI - PubMed
    1. Lazouski N. Schiffer Z. J. Williams K. et al., Understanding Continuous Lithium-Mediated Electrochemical Nitrogen Reduction. Joule. 2019;3:1127–1139. doi: 10.1016/j.joule.2019.02.003. - DOI
    1. Wang M. Kahn M. A. Mohsin I. et al., Can sustainable ammonia synthesis pathways compete with fossil-fuel based Haber–Bosch processes? Energy Environ. Sci. 2021;14(5):2535–2548. doi: 10.1039/D0EE03808C. - DOI
    1. Comer B. M. Fuentes P. Dimkpa C. O. et al., Prospects and Challenges for Solar Fertilizers. Joule. 2019;3:1578–1605. doi: 10.1016/j.joule.2019.05.001. - DOI

LinkOut - more resources