. 2023 Jun 22;7(7):e00144.
doi: 10.1097/HC9.0000000000000144. eCollection 2023 Jul 1.

CSNK2A1-mediated MAX phosphorylation upregulates HMGB1 and IL-6 expression in cholangiocarcinoma progression

Affiliations

CSNK2A1-mediated MAX phosphorylation upregulates HMGB1 and IL-6 expression in cholangiocarcinoma progression

Bing Yang et al. Hepatol Commun. .

Abstract

Background: We established a novel diethylnitrosamine (DEN) -induced mouse model that reflected the progression of cholangiocarcinoma (CCA) from atypical cystic hyperplasia.

Methods: BALB/c mice were administered DEN by oral gavage. Cells isolated from livers were analyzed for expression of CSNK2A1, MAX and MAX-interacting proteins. Human CCA cell lines (MzChA-1, HuCCT1), normal human cholangiocyte (H69), human hepatic stellate cells (LX-2), macrophages (RAW 264.7), and primary hepatic cells were used for cellular and molecular biology assays.

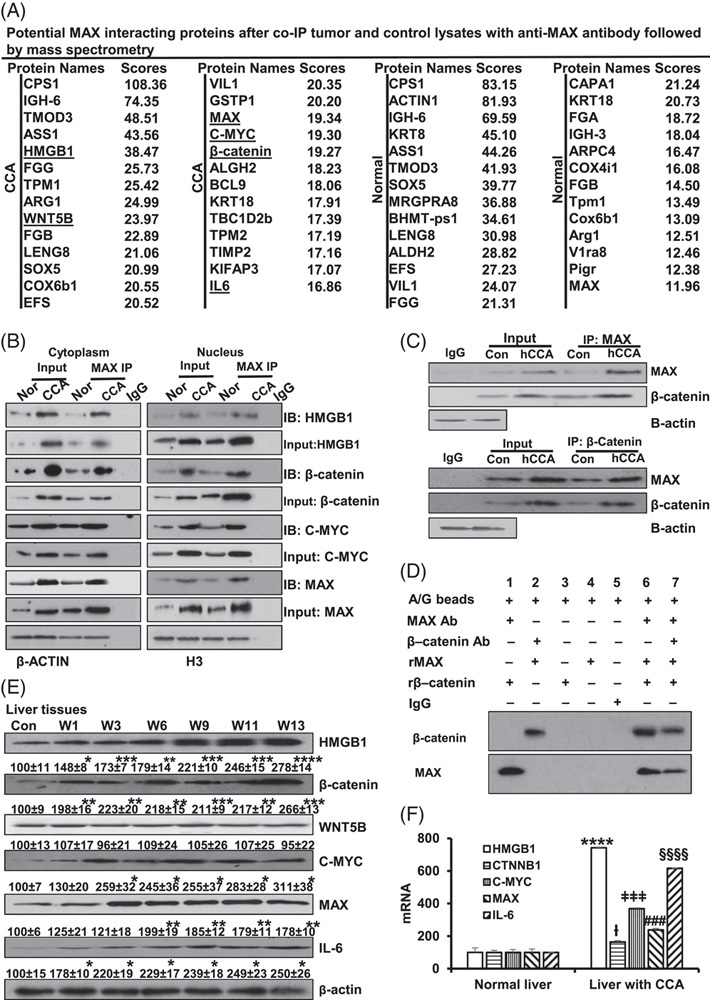
Results: Expression of MAX, CSNK2A1, C-MYC, β-catenin, HMGB1, and IL-6 was upregulated in hepatic cells from CCA liver tissue. The half-life of MAX is higher in CCA cells, and this favors their proliferation. Overexpression of MAX increased growth, migration, and invasion of MzChA-1, whereas silencing of MAX had the opposite effect. MAX positively regulated IL-6 and HMGB1 through paracrine signaling in HepG2, LX2, and RAW cells and autocrine signaling in MzChA-1 cells. CSNK2A1-mediated MAX phosphorylation shifts MAX-MAX homodimer to C-MYC-MAX and β-catenin-MAX heterodimers and increases the HMGB1 and IL-6 promoter activities. Increase of MAX phosphorylation promotes cell proliferation, migration, invasion, and cholangiocarcinogenesis. The casein kinase 2 inhibitor CX-4945 induces cell cycle arrest and inhibits cell proliferation, migration, invasion, and carcinogenesis in MzChA-1 cells through the downregulation of CSNK2A1, MAX, and MAX-interaction proteins.

Conclusion: C-MYC-MAX and β-catenin-MAX binding to E-box site or β-catenin-MAX bound to TCFs/LEF1 enhanced HMGB1 or IL-6 promoter activities, respectively. IL-6 and HMGB1 secreted by hepatocytes, HSCs, and KCs exert paracrine effects on cholangiocytes to promote cell growth, migration, and invasion and lead to the progression of cholangiocarcinogenesis. CX-4945 provides perspectives on therapeutic strategies to attenuate progression from atypical cystic hyperplasia to cholangiocarcinogenesis.


Conflict of interest statement

The authors have no conflicts to report.

Figures

None
Graphical abstract
FIGURE 1
FIGURE 1
Pathological and biochemical changes in DEN-treated mice. (A) Representative livers showing cholangiocyte proliferation of bile duct in the portal area (weeks 1 and 3, denoted by arrow), atypical proliferation from portal areas to the periportal area along sinusoid and in the adjacent liver parenchyma with the formation of irregular and tortuous ductular structures (week 6, denoted by arrow), atypical cystic hyperplasia (week 9, denoted by arrow), cholangiomas showing neoplastic cells in small cords and the stroma extends around the reactive ductulus (week 11, denoted by arrow), and CCA showing the papillary proliferation of the atypical biliary epithelium with a multilayering of nuclei, loss of cell polarity, and nuclear hyperchromasia within the bile ducts (week 13, donated by arrow). Magnifications are ×20 for the images on the left; areas indicated by arrows are further magnified on the right for each. H&E representative pictures are shown from n=3. (B) Survival curves, % of saline in different groups of mice. Blue represents the DEN group and orange represents the control group. Liver/Body weight (C), body weight (D), and liver weight (E) of the mice, % of saline. Total serum was extracted from the treated groups to assess the serum bilirubin (μmol/L) (F), alanine aminotransferase (ALT, U/L) (G), and aspartate aminotransferase (AST, U/L) (H) levels. Analysis of CK19-positive area/total area (I), F4/80 positive number, % of saline (J), and hydroxyproline (ug/g liver) (K). Twelve samples from the DEN treatment groups and 6 samples from the control groups were used in the above assays. Control group vs. DEN treatment groups, *p < 0.05, **p < 0.01, ****p <0.001, and ****p <0.0001. Abbreviations: W1, week 1; W3, week 3; W6, week 6; W9, week 9; W11, week 11; W13, week 13.
FIGURE 2
FIGURE 2
Expression and stability of MAX and its role in MzChA-1 growth, migration, invasion, and tumorigenicity. (A) MAX strongly stained in the proliferated bile duct of primary sclerosing cholangitis (PSC) and cholangiocarcinoma (CCA). H&E stains are shown in the top (×10), and IHCs are shown in the bottom (×20). Local magnification of boxed areas is shown right for each IHC. IHC representative pictures are shown from n=3. (B) MAX mRNA levels in NHL, CCA and PSC from 2-way ANOVA assay. Results are mean % ± SEM of NHL. †††p < 0.001, ****p  <  0.0001 vs. NHL. (C) MAX protein level in cytoplasm and nucleus from NHL and CCA was measured by Western blotting (n=3 each) were normalized to housekeeping control β-actin (cytoplasm) or nucleus (Histone H3). Densitometric values are summarized below the blots, expressed as mean% of normal liver ± SEM. **p  <  0.01, ***P<0.001 vs. normal liver. (D) MzChA-1 and cholangiocytes isolated from mouse liver tissues with CCA and control livers were cultured at 24 hours, and then CHX treatment and Western blotting (top) were conducted. The MAX band intensity was normalized to β-actin and then normalized to the t=0 controls. Graph showing relative level of MAX below western blotting. Data are shown as mean ± SEM, in 3 different experiments (n=3) (bottom). (E) The half-life of MAX in cholangiocytes from CCA (above) and normal tissue (mid) and MzChA-1 (below), *p <0.05 in 2-way ANOVA assays. (F) Protein levels of MAX were measured in MzChA-1 and normalized to housekeeping β-actin to determine the efficiency of MAX silence (MAX Si) and overexpression (MAX OV). Numbers below the blots represent mean ± SEM densitometric changes, expressed as % of scramble siRNA (SC) or empty vector (EV). ** p <0.01, *** p <0.001. Data are shown as mean ± SEM. in 3 different experiments by 2-way ANOVA assays (n=3). (G–I) MzChA-1 cells were transfected with MAX siRNA, MAX overexpressed vector, SC, or EV for 24 hours. Results are expressed as mean % of control ± SEM from 3 experiments done, ** p <0.01, ***p <0.001 vs. SC or EV. Migration (G), MTT (H), and invasion (I) assays were done in MzChA-1 cells after treatment with MAX siRNA or MAX overexpressed vector for 24 hours. Results are shown as mean% of SC or EV ± SEM from 3 independent experiments done. MTT statistic assays were done by 2-way ANOVA. **p <0.01, ****p  < 0.0001 vs. SC or EV. ††††P<0.0001. (J and K) The effect of MAX OV or siRNA on cell cycle progression in the MzChA-1 cell line. (J) Distribution of the MzChA-1 cells in different phases of the cell cycle were determined by flow cytometry and analyzed with FCS Express 5 Flow software to determine the percentage of cells in each phase of the cell cycle. (K) Flow cytometry was done for fraction of MzChA-1 cells in the G1, S, and G2 phases in MAX OV or siRNA. **** p <0.0001 G1 or S phase vs. G2 phase. (L) Protein levels of MAX OV and CRISPR MAX were measured in the MzChA-1 cell. (M) Morphological changes of liver after CRISPR MAX and MAX OV treatment. Arrow points to tumor (top). H&E staining is shown in the middle, and PCNA staining is shown in the bottom. PCNA-positive cells are shown as mean % in tumor tissues. Abbreviations: CHX, cycloheximide; Chol-CCA, cholangiocytes from CCA liver tissues; Chol-Nor, cholangiocytes from normal liver tissues; eCCA, extrahepatic CCA; EV, empty vector; iCCA, intrahepatic CCA; NBEC, normal biliary epithelial cells; NHL, normal human liver; N, sample number; NT, nontumor bile duct; NTBD, nontumor bile duct; OV, overexpressed; SC, scramble siRNA.
FIGURE 3
FIGURE 3
The analysis of MAX and potential MAX-interacting proteins. (A) Potential MAX-interacting proteins after coimmunoprecipitation (Co-IP) of CCA and normal lysates with anti-MAX antibody followed by mass spectrometry. Three specimens per group were pooled for the IP. (B) Verification of potential MAX-interacting proteins in the cytoplasm and nucleus isolated from liver tissues with CCA and normal control were detected by MAX IP and western blotting. (C) MAX and β-catenin interaction in Con and hCCA were detected by Co-IP and western blotting. (D) In vitro pull-down shows direct interaction between MAX and β-catenin using recombinant MAX and β-catenin proteins. Results represent 3 independent experiments done in duplicate. (E) Western blots show the time course of protein expression of HMGB1, β-catenin, WNT5B, C-MYC, MAX, and IL-6 in liver tissue. Densitometric values are shown below the blots, expressed as mean% of Con ± SEM from 3 experiments done, *p  < 0,05. **p  < 0.01, ***p  < 0.001, ****p  < 0.0001 vs. Con. (F) The mRNA level of HMGB1, CTNNB1, C-MYC, MAX, and IL-6 isolated from livers between CCA and normal controls. Abbreviations: ACT1, actin1 gene; ALDH2, aldehyde dehydrogenase 2; Arg1, arginase1; ARPC4, actin related protein 2/3 complex subunit 4; ASS1, argininosuccinate synthetase; BCL9, B-cell lymphoma 9; Bhmt-ps1, betaine-homocysteine methyltransferase, pseudogene 1; CAPA1, calpain 1; COX4I1, cytochrome c oxidase subunit 4I1; COX6B1, cytochrome c oxidase subunit 6B1; CPS1, carbamoyl phosphate synthetase 1; EFS, embryonal Fyn-associated substrate; FGA, fibrinogen alpha chain; FGB, fibrinogen beta chain; FGG, fibrinogen gamma chain; GSTP1, Glutathione S-transferase Pi; hCCA, hilar cholangiocarcinoma; KIFAP3, KIF-associated protein 3; KRT18, keratin 18; IGH3(Ighg2b), immunoglobulin heavy constant gamma 2B; LENG8, leukocyte receptor cluster, member 8; Mrgpra8, MAS-related GPR member A8; PIGR, polymeric immunoglobulin receptor; SOX5, SRY-box transcription factor 5; TMOD3, tropomodulin 3; TPM1, Tropomyosin alpha-1 chain; VIL1, Villin 1; V1ra8, vomeronasal 1 receptor, A8.
FIGURE 4
FIGURE 4
The cell-specific expression of MAX and MAX-interaction proteins, and verification of interaction and cellular location. The protein of HMGB1, β-catenin, C-MYC, MAX, CK19, and IL-6 in cholangiocytes (A). The protein of HMGB1, β-catenin, C-MYC, MAX, and IL-6 in hepatocytes (B), KCs (C, left) or HSCs (C, right) isolated from livers with CCA and normal controls. (D) Verification for HMGB1, β-catenin, C-MYC and MAX interaction for cholangiocytes isolated from CCA and control liver was detected by Co-IP and western blotting. (E) Immunofluorescence (IF) of cholangiocytes from normal and CCA liver after transfections of HMGB1, β-catenin, C-MYC, MAX, and IL-6. The top row shows DAPI staining. The second row shows the Ab staining. The third row merged DAPI, and Ab staining [original magnification, ×630 (oil immersion)] and the fourth row shows the magnified images of the regions. Abbreviations: Ab, antibodies; H69, human normal cholangiocyte H69 cells; HuCCT1, human intrahepatic CCA cells; MzChA-1, human biliary adenocarcinoma.
FIGURE 5
FIGURE 5
CSNK2A1, CX-4945 and MAX phosphorylation, and MAX’s effect on MAX-interaction proteins. (A) MAX contains an important binding site at S11. (B) Phospho-MAX (S11) protein levels in the cholangiocytes isolated from mouse liver tissues with CCA and normal livers. Densitometric values are summarized below the blots, expressed as mean% of normal liver ± SEM. *p  < 0.05, ***P<0.001 vs. cholangiocytes from normal liver. (C, D) The mRNA and protein levels of HMGB1, β-catenin, C-MYC, MAX, and IL-6 after MAX OV in MzChA-1 cells. (E, F) The mRNA and protein levels of HMGB1, β-catenin, C-MYC, MAX, and IL-6 after MAX siRNA treatment in MzChA-1 cells. (G) Protein expression patterns of CSNK2A1, phosphor S11 MAX, and MAX in hepatic cells, H69, and MzChA-1. (H, I) The mRNA levels of HMGB1, β-catenin, C-MYC, MAX, and IL-6 after MAX knockdown (H) and overexpression (I) in H69, % of SC or EV. (J, K) The mRNA and protein levels of HMGB1, β-catenin, C-MYC, MAX, and IL-6 after DMSO+EV, CX-4945+EV, DMSO+MAX OV, and CX-4945+MAX OV in MzCHA-1. For mRNA, results are mean % ± SEM of SC or EV. **p  < 0.01, ****p  < 0.0001 vs. SC or EV for HMGB1. ††p <0.01, ††† p <0.001 vs. SC or EV for CTNNB1. ‡‡p  < 0.01, ‡‡‡p  < 0.001, ‡‡‡‡p  < 0.0001 vs. SC for C-MYC. §§§p<0.001, §§§§p<0.0001 vs. SC or EV for MAX. ¥p<0.05, ¥¥p<0.01, ¥¥¥p<0.001, ¥¥¥¥p<0.0001 vs. SC for IL-6. Densitometric values are summarized below the western blots, expressed as mean% of normal liver ± SEM. ** p<0.01, *****p<0.001, ****p<0.0001 vs. SC or EV. Data are shown in 3 different experiments (n=3).
FIGURE 6
FIGURE 6
CSNK2A1- and CX-4945-mediated MAX phosphorylation regulate HMGB1 promoter activity through E-box element. (A) MAX siRNA and CX-4945 regulated HMGB1 promoter activity in MzChA-1 cells. Results are mean % of WT+SC+D ± SEM from 3 experiments done, ****p  < 0.0001 vs. others, ††p <0.01.vs. WT+SC+D. The top diagram shows E-box element and its mutant in the human HMGB1 promoter. (B) MAX overexpression and CX-4945 regulated HMGB1 promoter activity in MzChA-1 cells. Results are mean % of WT+EV+D ± SEM from 3 experiments done, **p <0.01, ***p <0.001, ****p  < 0.0001, †††p <0.001 vs. WT+MAX OV+D. (C) ChIP and qPCR analysis was performed by spanning E-box region of the HMGB1 promoter in MzChA-1 cells using MAX and phosphor S11 MAX antibodies. Results are mean % of input ± SEM from 3 experiments done, *p <0.05, ***p <0.001, ****p <0.0001 vs. SC+EV+D in MAX antibody, ††p<0.01 SC+EV+D vs. MAX si+EV+D, ‡‡‡p <0.001 MAX si+EV+D vs. MAX si+EV+CX-4945, ##p  < 0.01 MAX OV+SC+D vs. MAX OV+SC+CX-4945 in phosphor S11 MAX antibody. (D) Seq-ChIP and qPCR analysis was performed by spanning E-box region of the HMGB1 promoter in MzChA-1 cells using C-MYC antibody after ChIP of MAX and phosphor S11 MAX antibodies. Results are mean % of input ± SEM from 3 experiments done, *p <0.05, ***p <0.001 vs. SC+EV+D in MAX antibody, ††p<0.01 SC+EV+D vs. MAX si+EV+D, ‡‡p <0.01 MAX si+EV+D vs. MAX si+EV+CX-4945, ####p  < 0.0001 MAX OV+SC+D vs. MAX OV+SC+CX-4945 in phosphor S11 antibody. (E) Seq-ChIP and qPCR analysis was performed by spanning E-box region of the HMGB1 promoter in MzChA-1 cells using β–catenin antibody after ChIP of MAX and phosphor S11 MAX antibodies. Results are mean % of input ± SEM from 3 experiments done, *p <0.05, ****p <0.001 vs. SC+EV+D in MAX antibody, ††††p<0.0001 SC+EV+D vs. MAX si+EV+D, ‡‡p <0.01 MAX si+EV+D vs. MAX si+EV+CX-4945, ####p  <  0.0001 MAX OV+SC+D vs. MAX OV+SC+CX-4945 in phosphor S11 antibody. (F) IF of MAX in cholangiocyte after transfections. The top row shows DAPI staining. The second row shows the MAX staining [including antibodies of MAX and phosphor S11 MAX (p)]. The third row merged DAPI and MAX staining [original magnification, ×630 (oil immersion)]. (G) EMSA analyses using labeled probes containing 2 E-box elements of the HMGB1 promoter were performed in H69 and MzChA-1 cells. Probe only and IgG served as controls. Abbreviations: Ab, antibody; D, DMSO; EV, empty vector; MU, E-box element CACGTG mutation into CACGGG in −298/+1 HMGB1 promoter; p, phospho S11 MAX antibody; SC, scramble siRNA; Seq-ChIP, sequencing chromatin immunoprecipitation; WT, −298/+1 wild-type HMGB1.
FIGURE 7
FIGURE 7
CSNK2A1 and CX-4945-mediated MAX phosphorylation regulate IL-6 promoter activity through TCF1/LEF1 element. (A) MAX siRNA and CX-4945 regulated IL-6 promoter activity in MzChA-1 cells. Results are mean % of WT+SC+D ± SEM from 3 experiments done, ***p <0.001, ****p  < 0.0001 vs. others, †††p <0.001.vs. WT+SC+D. The top diagram shows TCFs/LEF1 element and its mutant in the human IL-6 promoter. (B) MAX overexpression and CX-4945 regulated IL-6 promoter activity in MzChA-1 cells. Results are mean % of WT+EV+D ± SEM from 3 experiments done, *p <0.05, **p <0.01, ****p  < 0.0001 vs. WT+EV+D, †††p <0.001 vs. WT+MAX OV+D, ‡p <0.05 vs. WT+MAX OV+CX-4945. (C) ChIP and qPCR analysis was performed by spanning TCFs/LEF1 region of the IL-6 promoter in MzChA-1 cells using β-catenin antibody. Results are mean % of input ± SEM from 3 experiments done, ***p <0.001 vs. SC+EV+D in β-catenin antibody, †p<0.05 vs. MAX si+EV+D, ‡‡‡p <0.001 vs. MAX OV+SC+D. (D) Seq-ChIP and qPCR analysis was performed by spanning TCFs/LEF1 region of the IL-6 promoter in MzChA-1 cells using MAX and phosphor S11 MAX antibodies after β-catenin antibody ChIP. Results are mean % of input ± SEM from 3 experiments done, *p <0.05, **p <0.001 vs. SC+EV+D in MAX antibody, †††p<0.01 vs. SC+EV+D, ‡‡‡p <0.01 vs. MAX si+SC+D in phosphor S11 antibody. #### p <0.0001 vs. MAX OV+SC+D in phosphor S11 antibody (E) EMSA analyses using probe containing double TCFs/LEF1 element of the IL-6 promoter were performed in H69 and MzChA-1 cells. Probe only and IgG served as controls. Abbreviations: Ab, antibody; D, DMSO; EV, empty vector; MU, TCFs/LEF1 element CCTCCAACAAAGATT mutation to CCTCCAACAGAGATT in −491/+1; SC, scramble siRNA; Seq-ChIP, sequencing chromatin immunoprecipitation; WT, −491/+1 wild-type IL-6 promoter.
FIGURE 8
FIGURE 8
MAX promotes paracrine or autocrine of HMGB1 or IL-6, and CX-4945 treatment shows therapeutic efficacy in tumor growth in immunodeficient mice (A) The protein expression of HMGB1 and IL-6 in cell culture medium. Results are expressed as mean % of EV ± SEM, *p <0.05, **p <0.01, ***p <0.001, and ****p <0.0001 vs. EV. The coculture with overexpressed MAX in HepG2, LX2 and RAW cells were analyzed in MzChA-1 cells with MTT (B), migration (C), and invasion (D). Results for MTT, migration and invasion are shown as mean% of EV ± SEM; MTT: **p < 0.01, †††p<0.001, and ####p <0.0001 vs. EV; migration and invasion: **p  < 0.01, ***p <0.001, and ****p <0.0001 vs. EV. Data are shown in 3 different experiments (n=3). Media from IL-6 (E) and HMGB1 (F) knockdown or overexpression in HepG2, LX2 and Raw cell affects MzChA-1 migration, *p  < 0.05, **p  < 0.01, ***p < 0.001. The proliferation (G), invasion (H), and migration (I) of MzChA-1 in vitro after CX-4945 treatment. Results are mean % ± SEM of EV. ***p  < 0.001. ****p  < 0.0.01. (J) Tumor was developed by injecting immunodeficient mice with MzChA-1 cells per mouse through the left lobe of liver. Mice received vehicle or 100 mg/kg of CX-4945 through gavage twice daily from day 3 after injection MzChA-1 cells. The arrows point to representative tumor. **** p < 0.0001. (K) The protein expression of HMGB1, β-catenin, C-MYC, total MAX, phosphor-MAX S11, IL-6, and CSNK2A1 in MzChA-1 isolated from mouse tumor tissues with CX-4945 (left) and vehicle treatment (right).

References

    1. Arcognato S, Sacchi D, Fassan M, Fabris L, Cadamuro M, Zanus G, et al. . Cholangiocarcinoma. Pathologica. 2021;113:158–69. - PMC - PubMed
    1. Khan SA, Davidson BR, Goldin RD, Heaton N, Karani J, Pereira SP, et al. . Guidelines for the diagnosis and treatment of cholangiocarcinoma: an update. Gut. 2012;61:1657–69. - PubMed
    1. Abdelrahim M, Al-Rawi H, Esmail A, Xu J, Umoru G, Ibnshamsah F, et al. . Gemcitabine and cisplatin as neo-adjuvant for cholangiocarcinoma patients prior to liver transplantation: case-series. Curr Oncol. 2022;29:3585–94. - PMC - PubMed
    1. Gutiérrez-Larrañaga M, González-López E, Roa-Bautista A, Rodrigues PM, Díaz-González Á, Banales JM, et al. . Immune checkpoint inhibitors: the emerging cornerstone in cholangiocarcinoma therapy? Liver Cancer. 2021;10:545–60. - PMC - PubMed
    1. Yang H, Li TW, Peng J, Tang X, Ko KS, Xia M, et al. . A mouse model of cholestasis-associated cholangiocarcinoma and transcription factors involved in progression. Gastroenterology. 2011;141:378–88. - PMC - PubMed

Publication types