Review
. 2023 Jun;3(6):e804.
doi: 10.1002/cpz1.804.

The Rat Genome Database: Genetic, Genomic, and Phenotypic Data Across Multiple Species

Affiliations
Review

The Rat Genome Database: Genetic, Genomic, and Phenotypic Data Across Multiple Species

Stanley J F Laulederkind et al. Curr Protoc. 2023 Jun.

Abstract

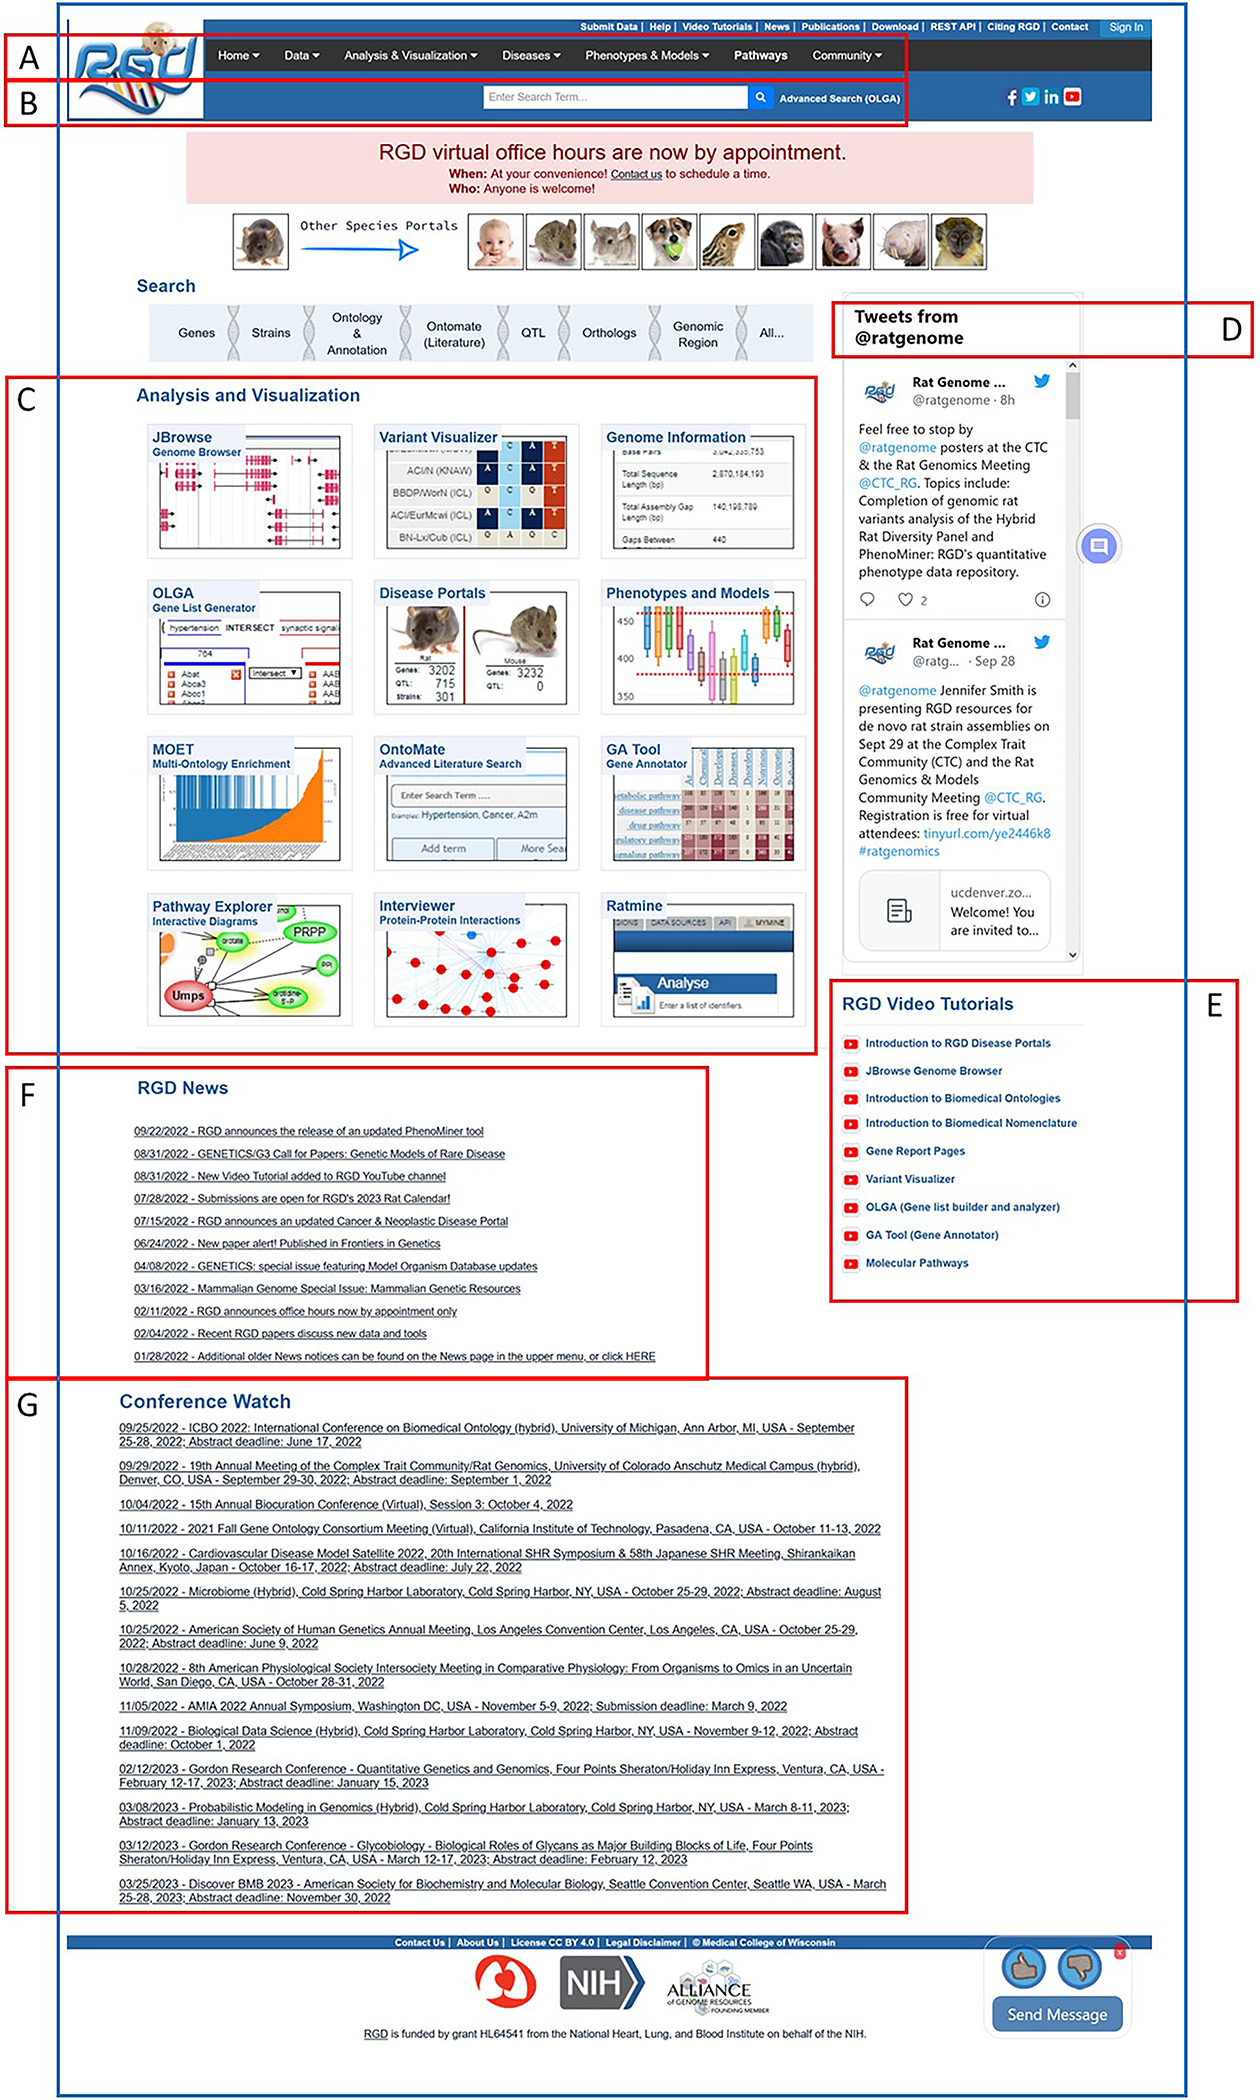
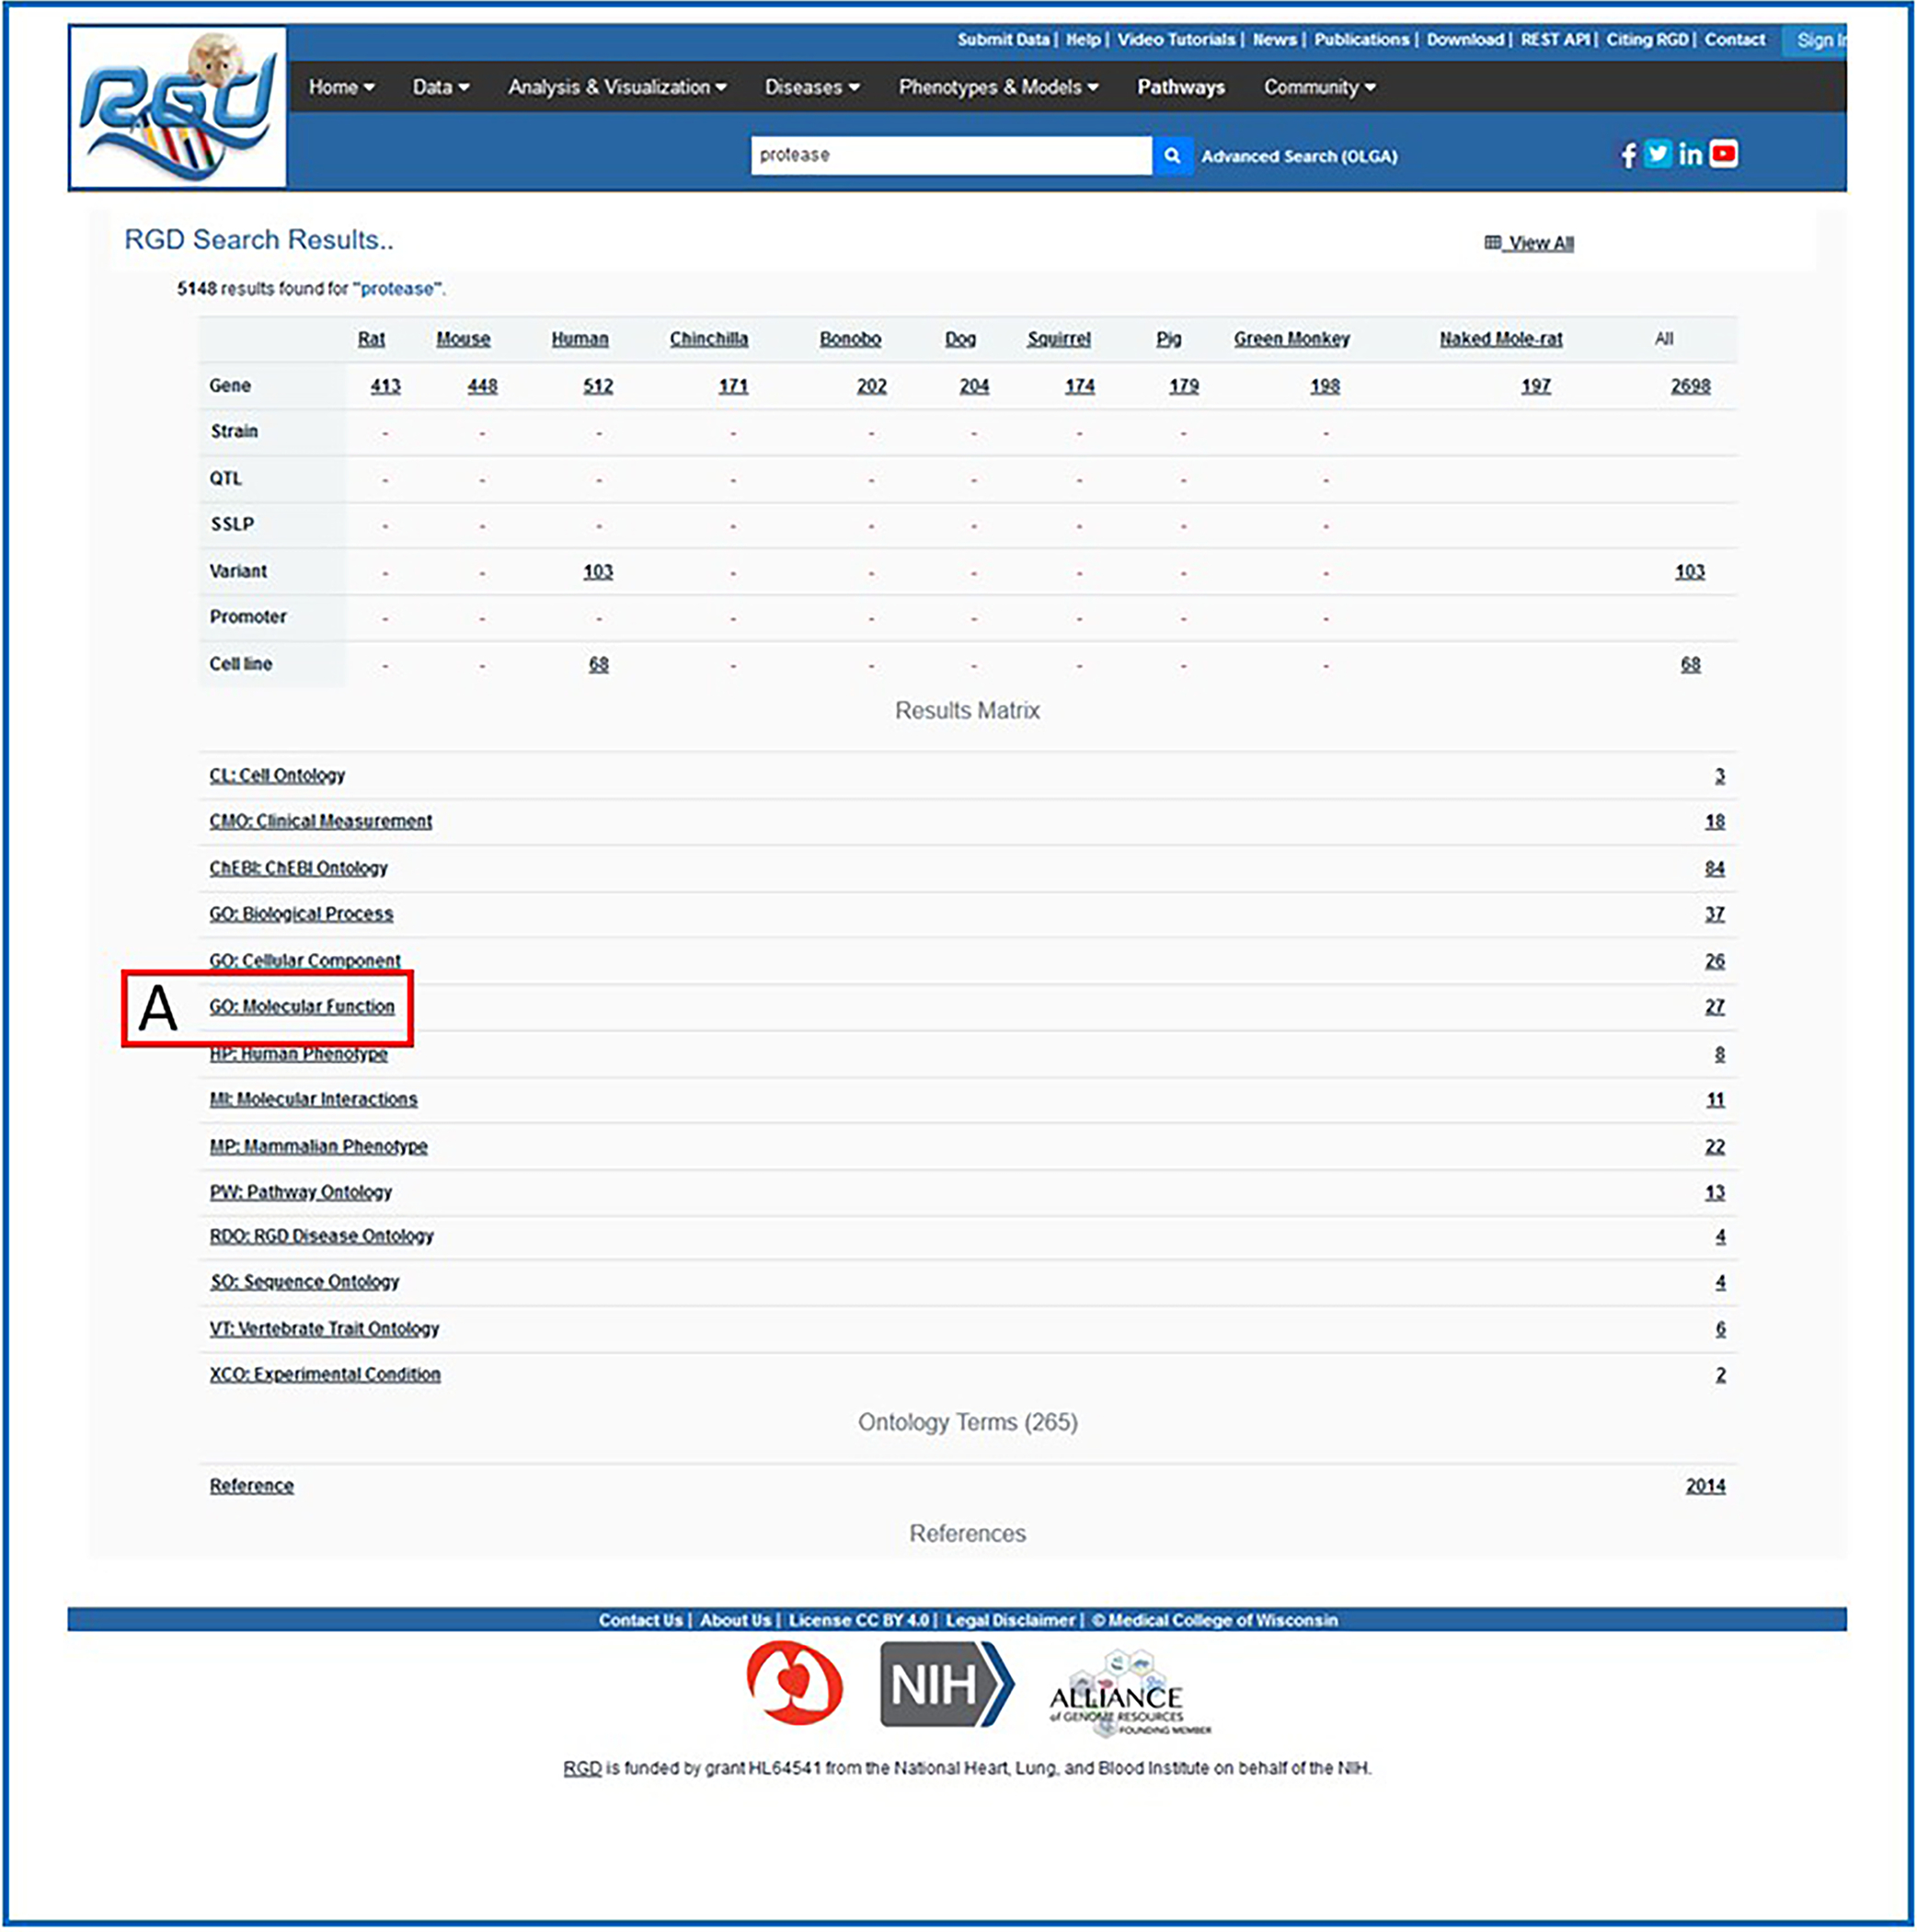
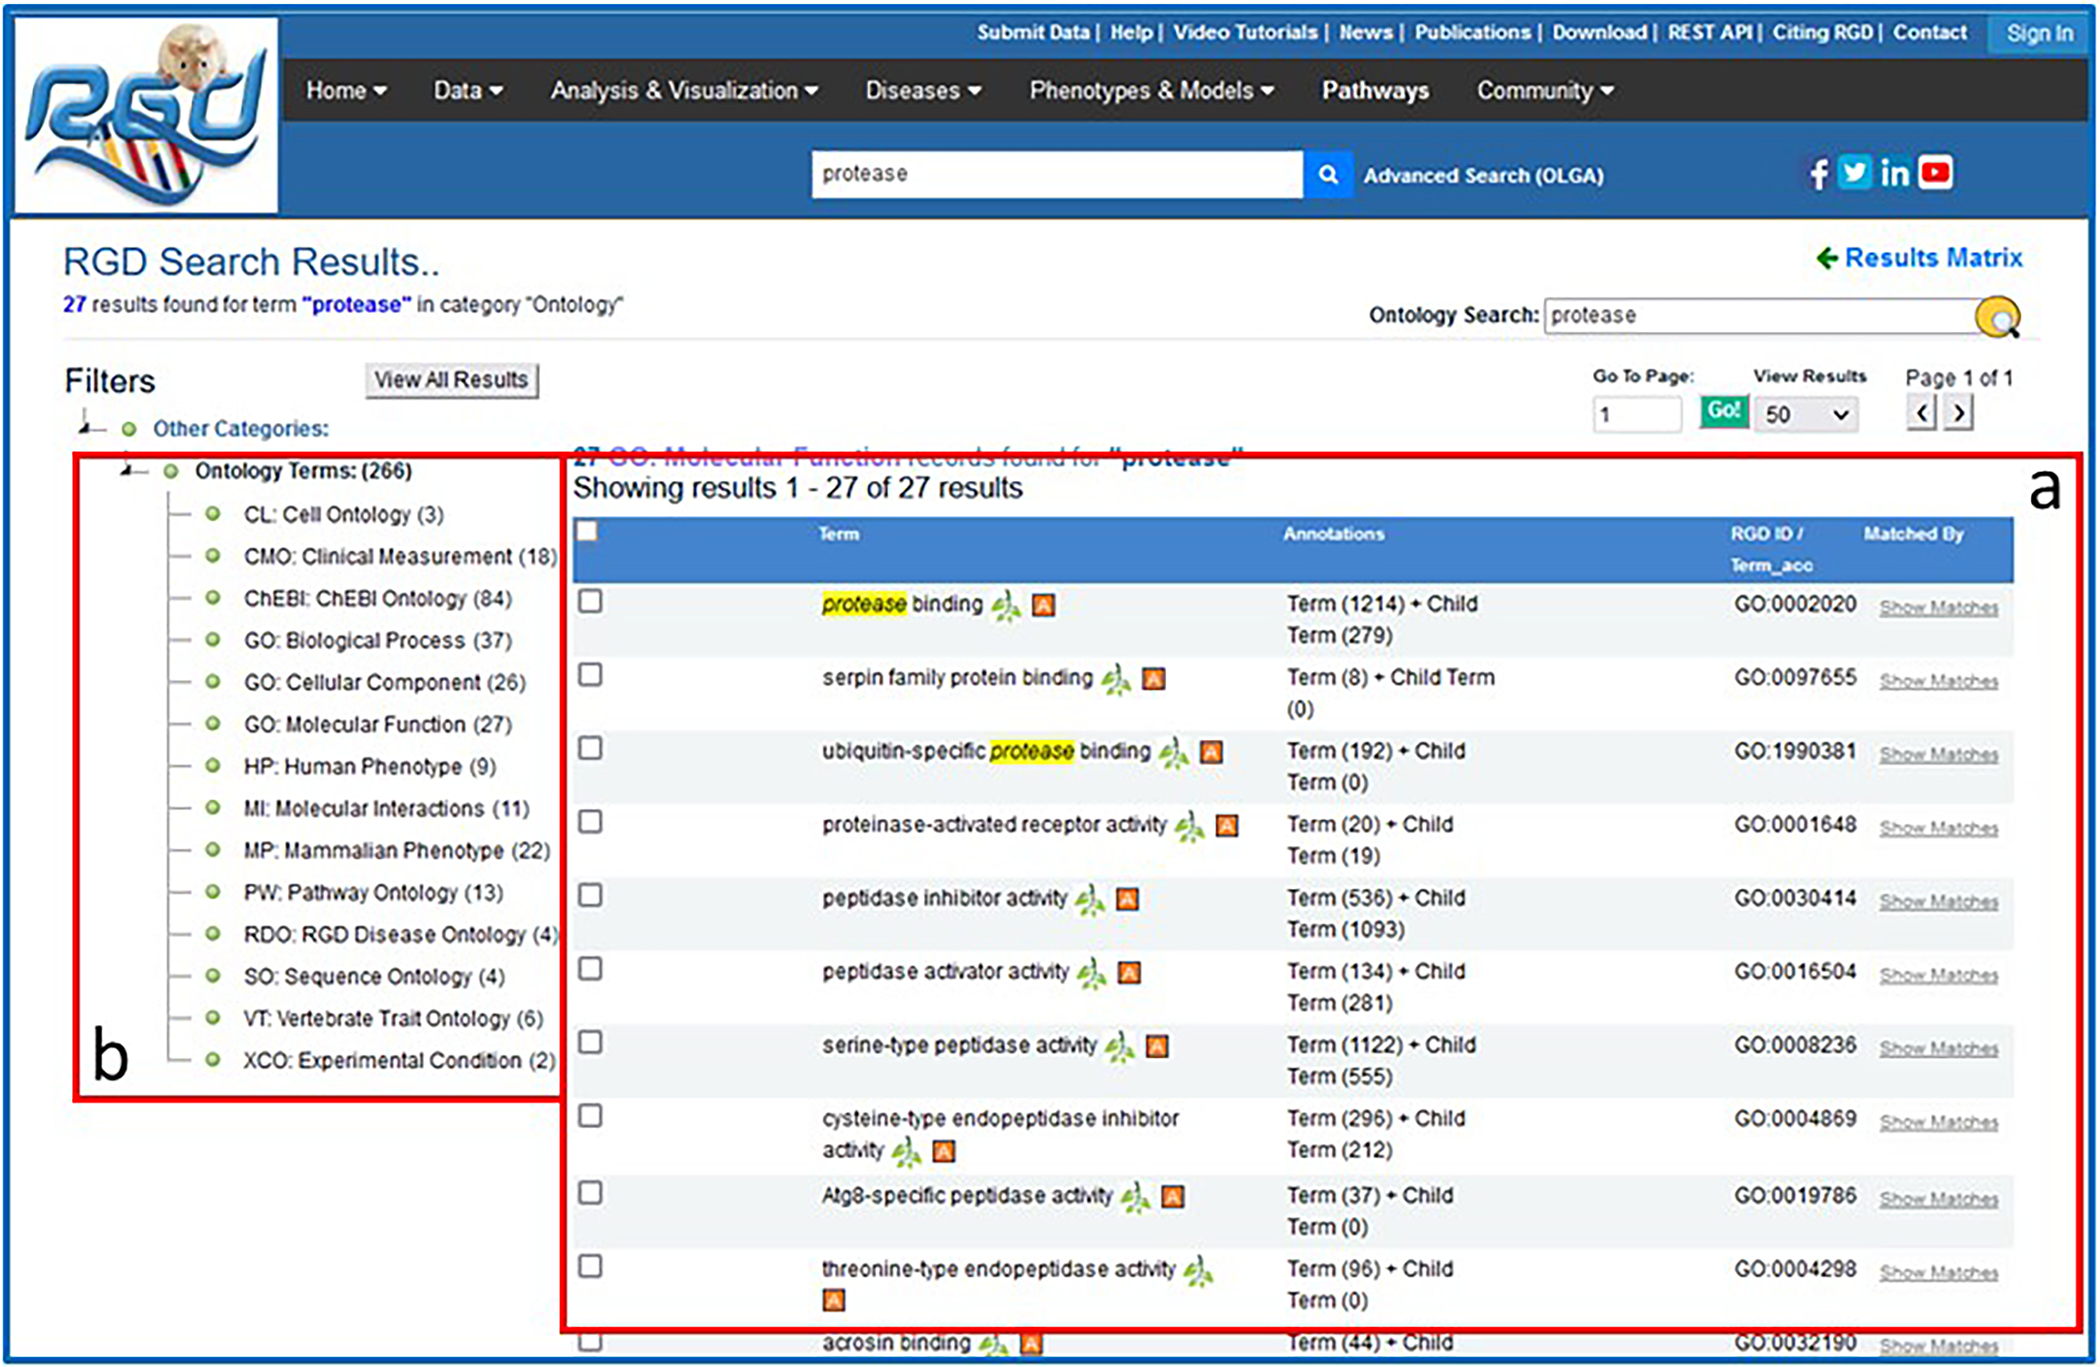
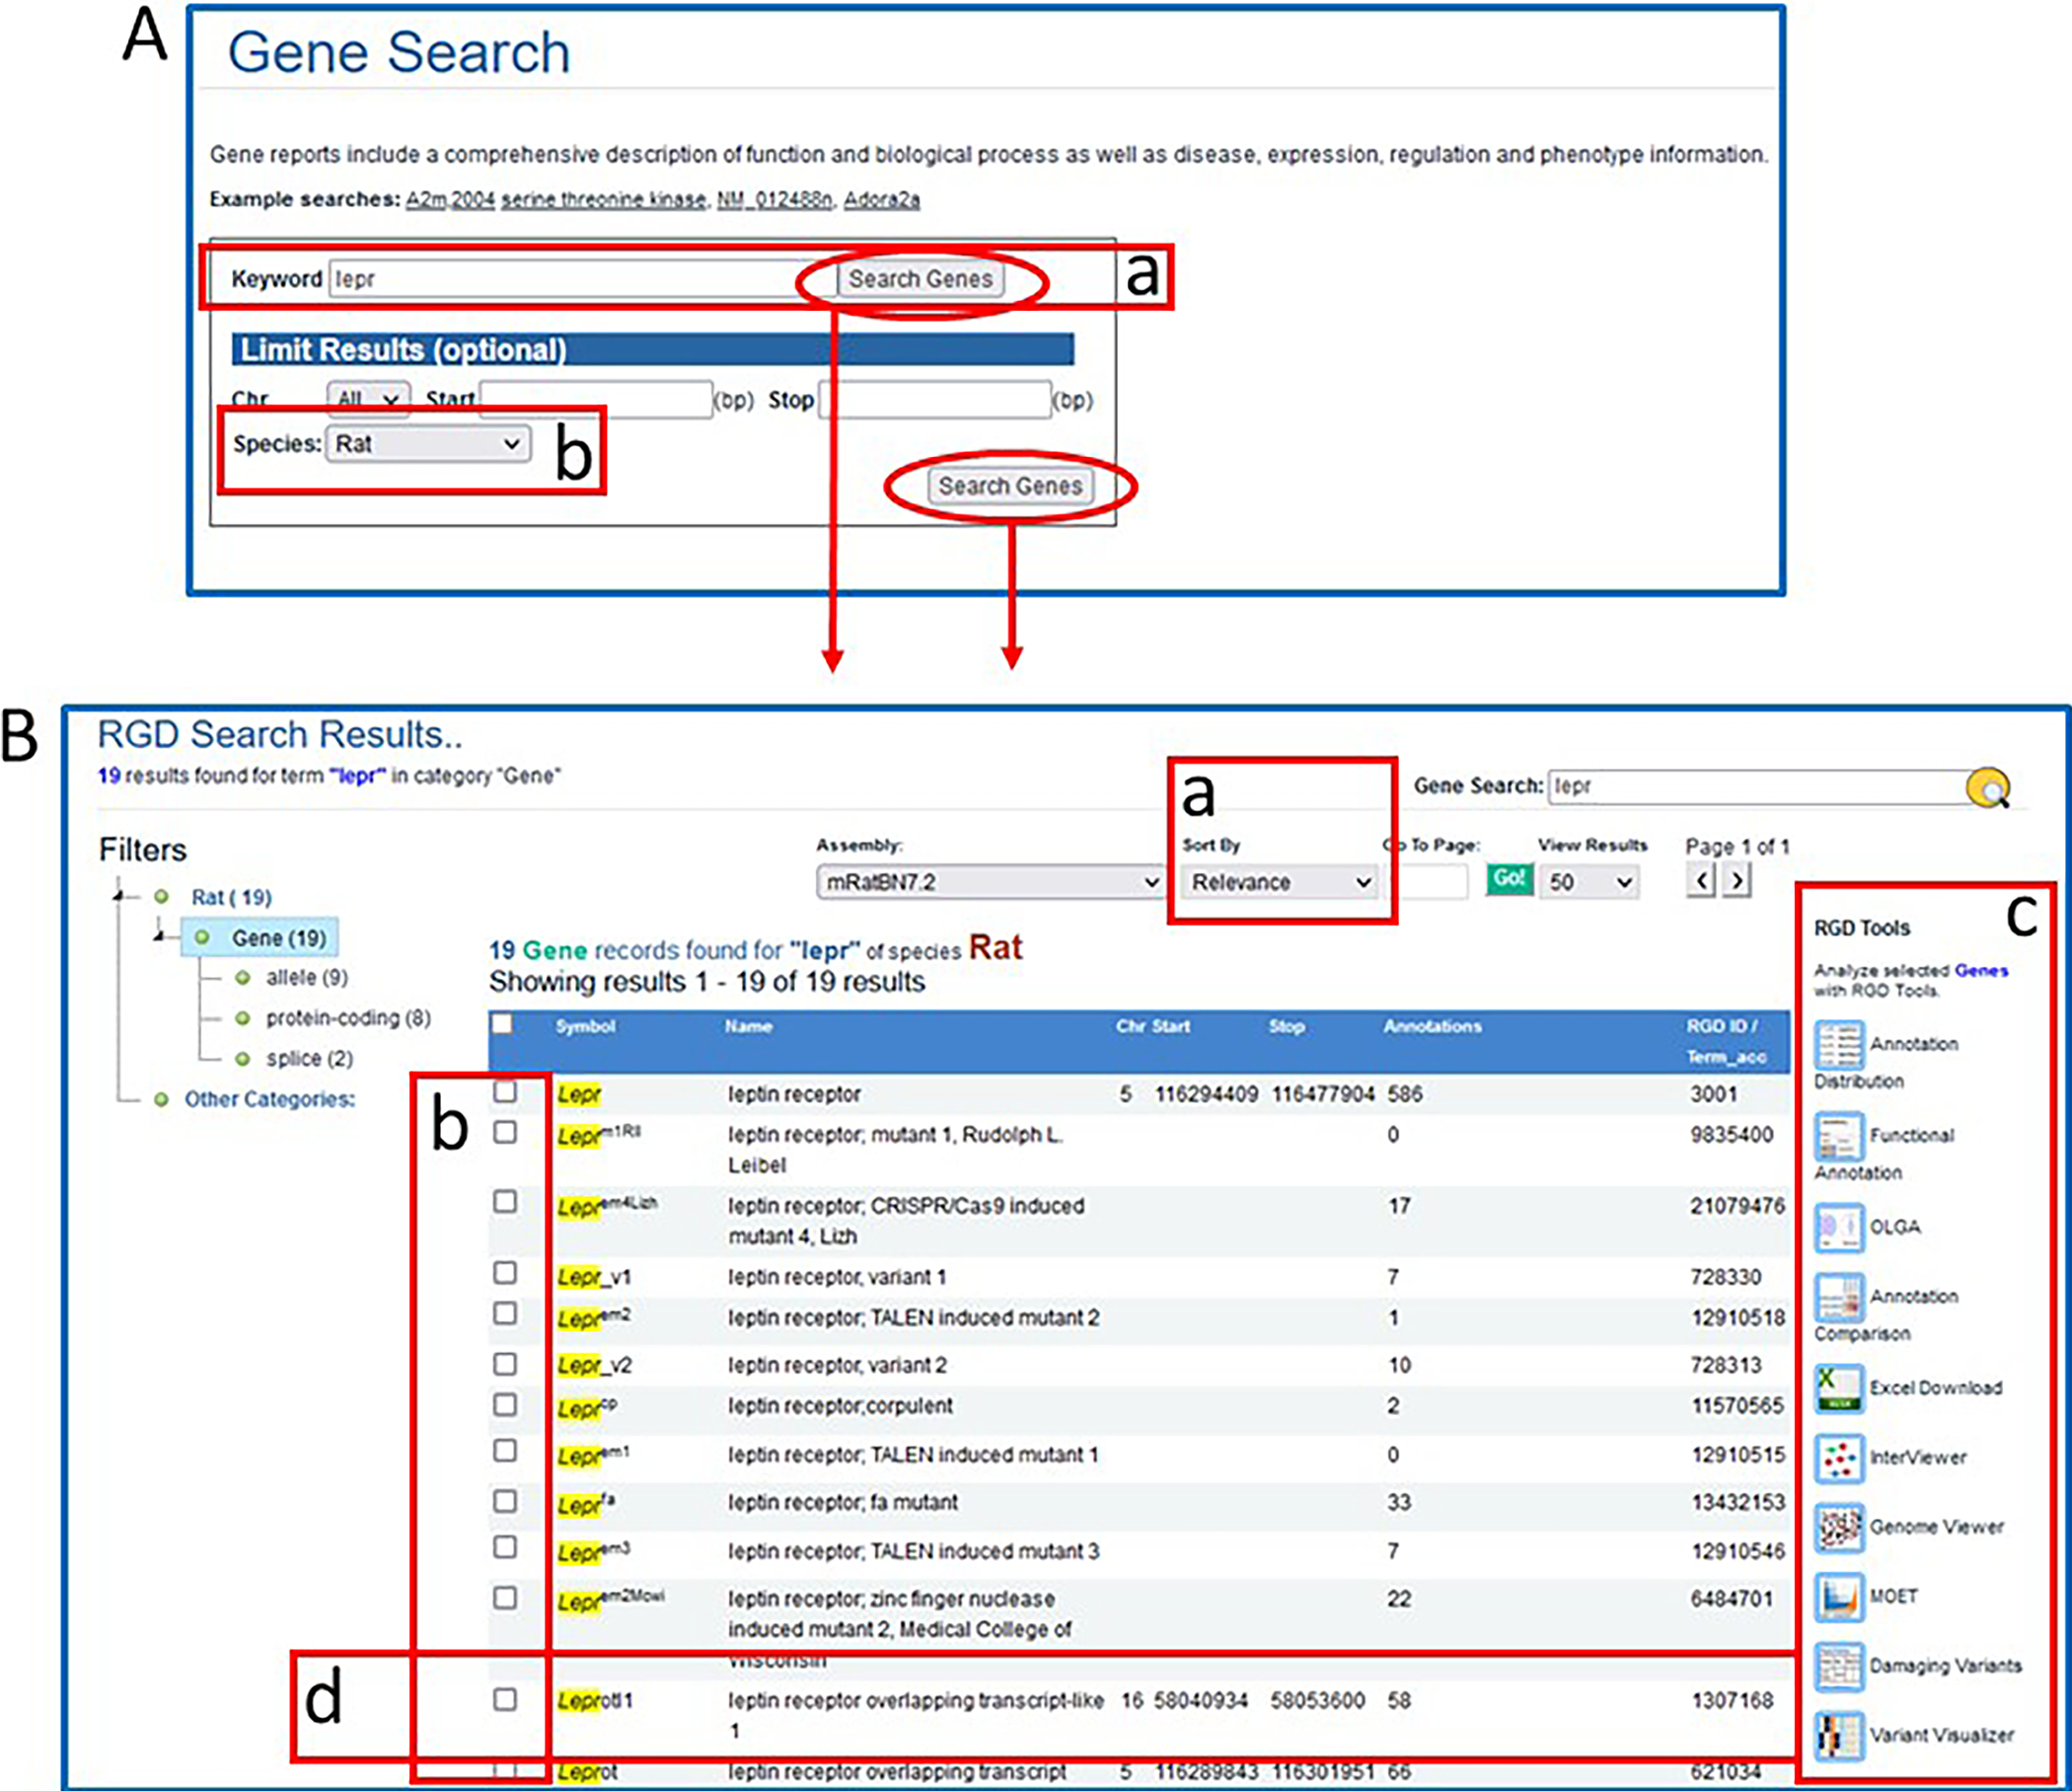
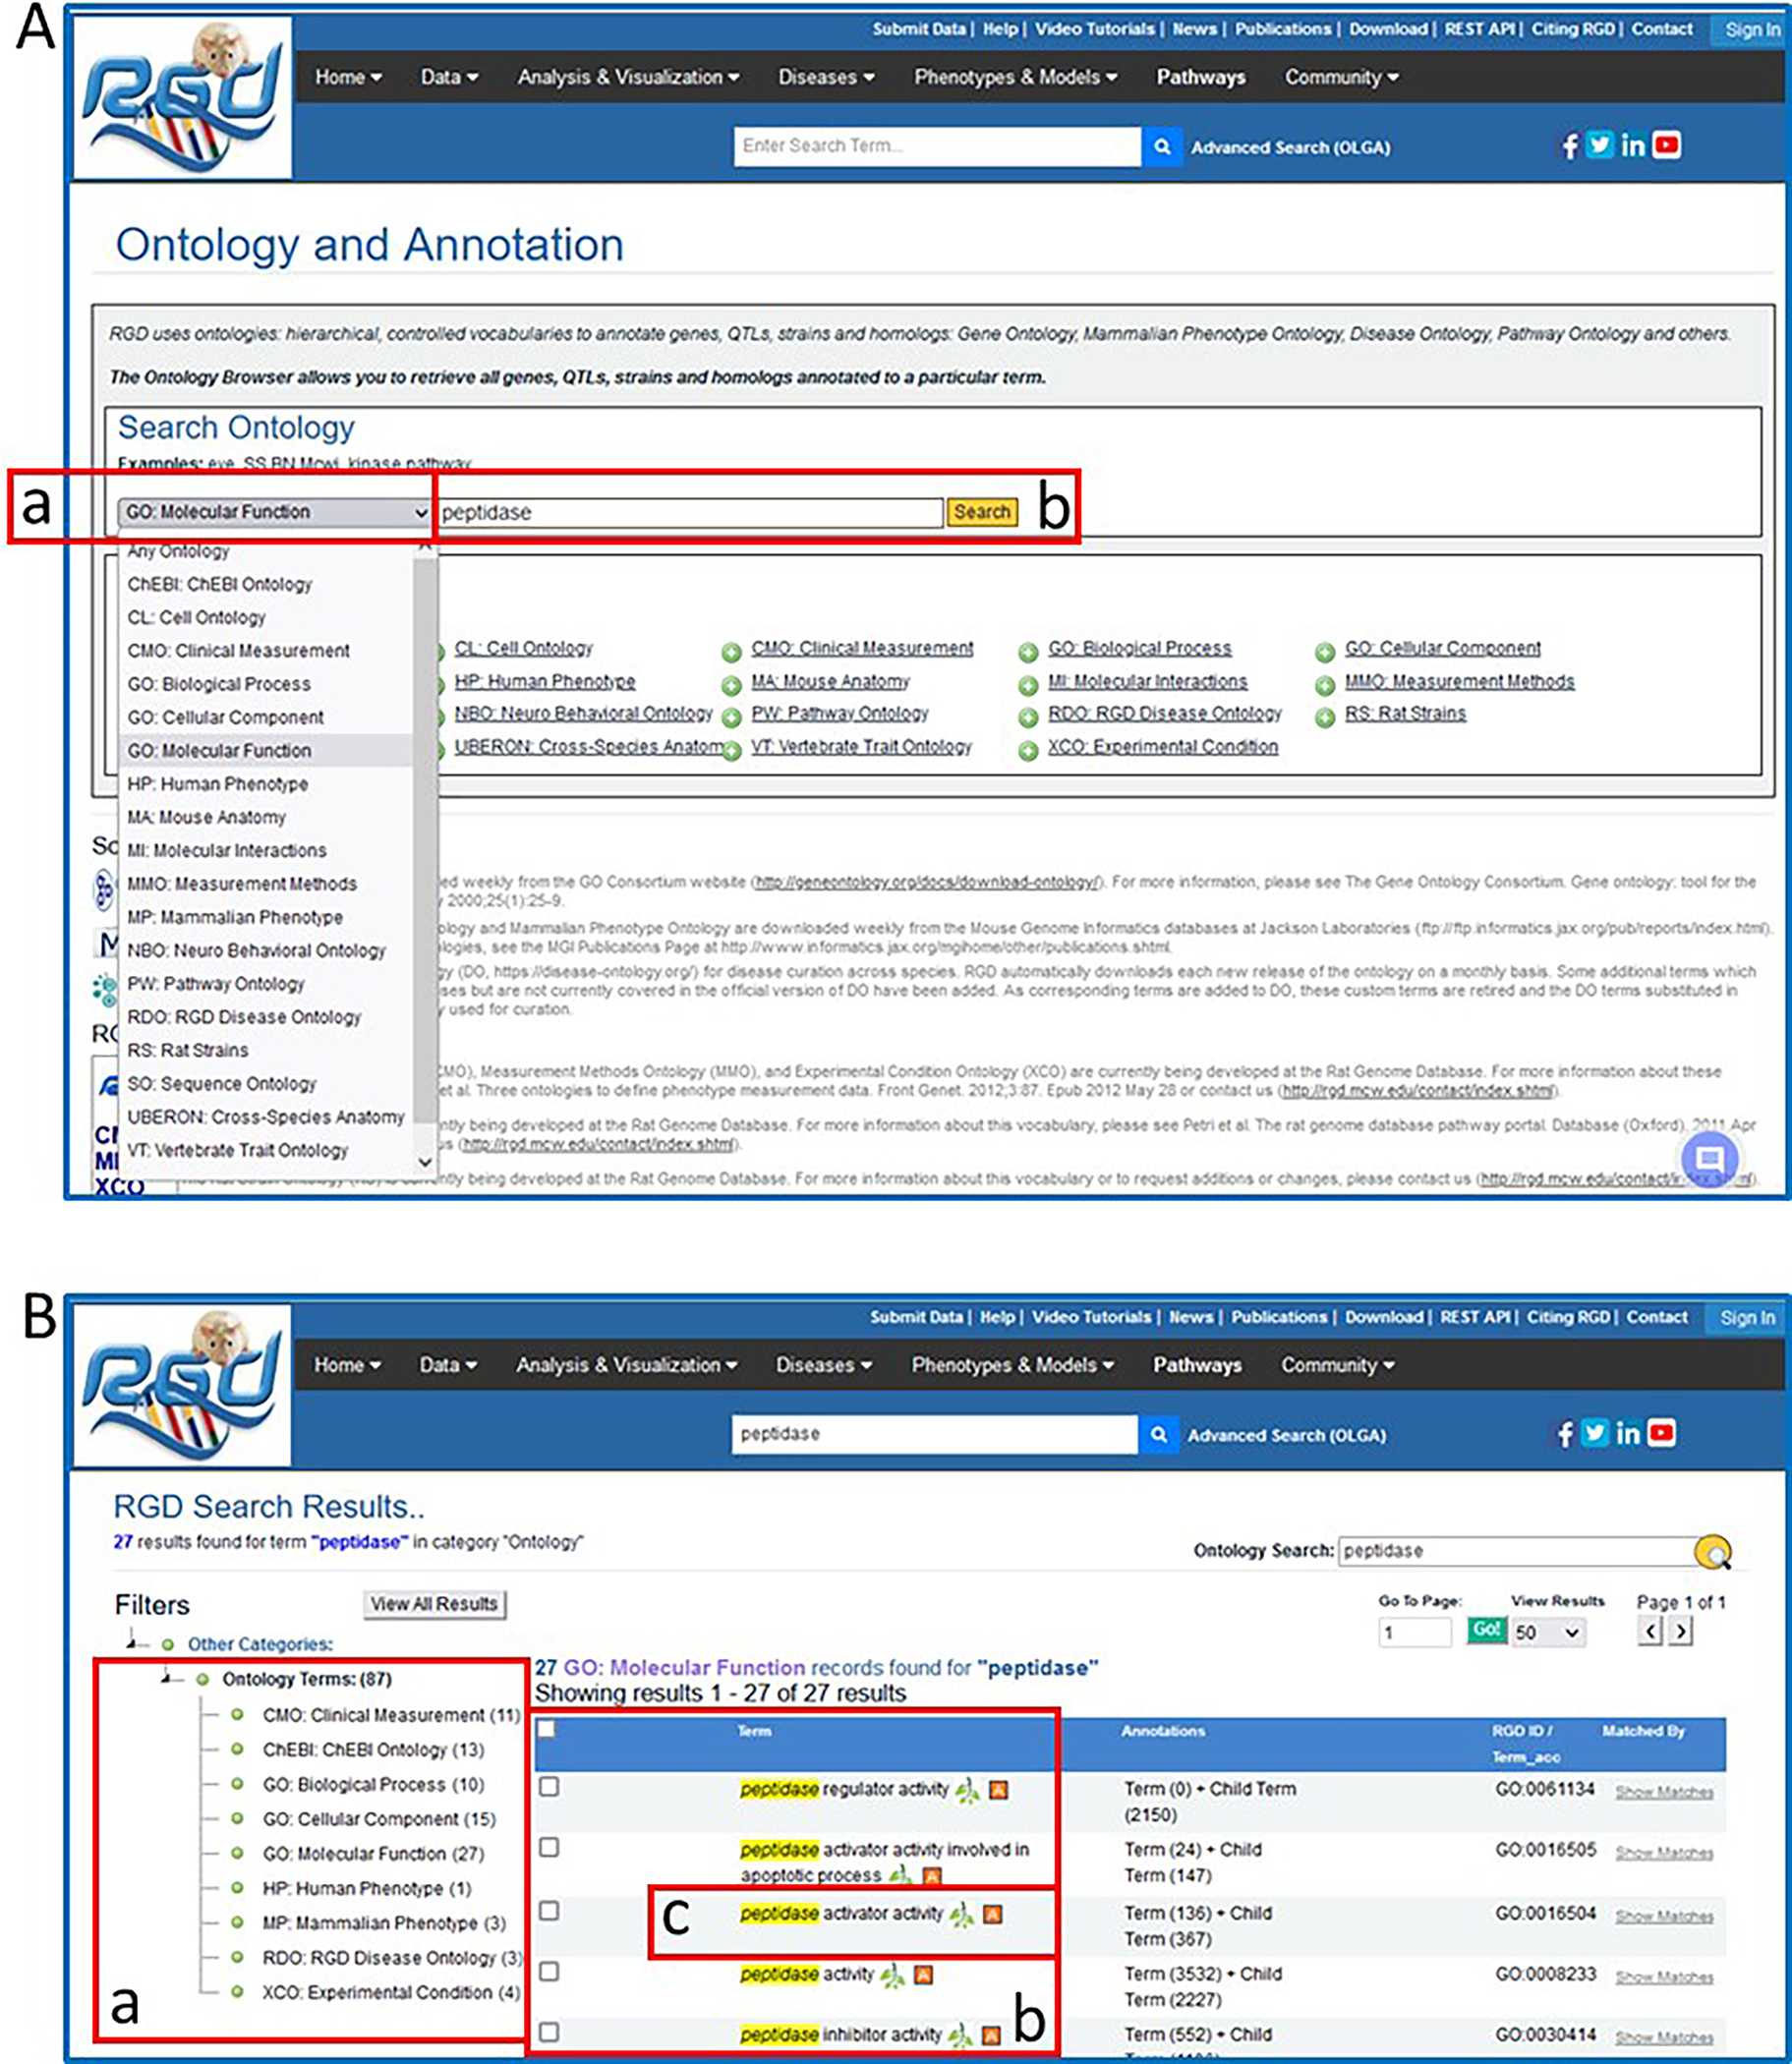
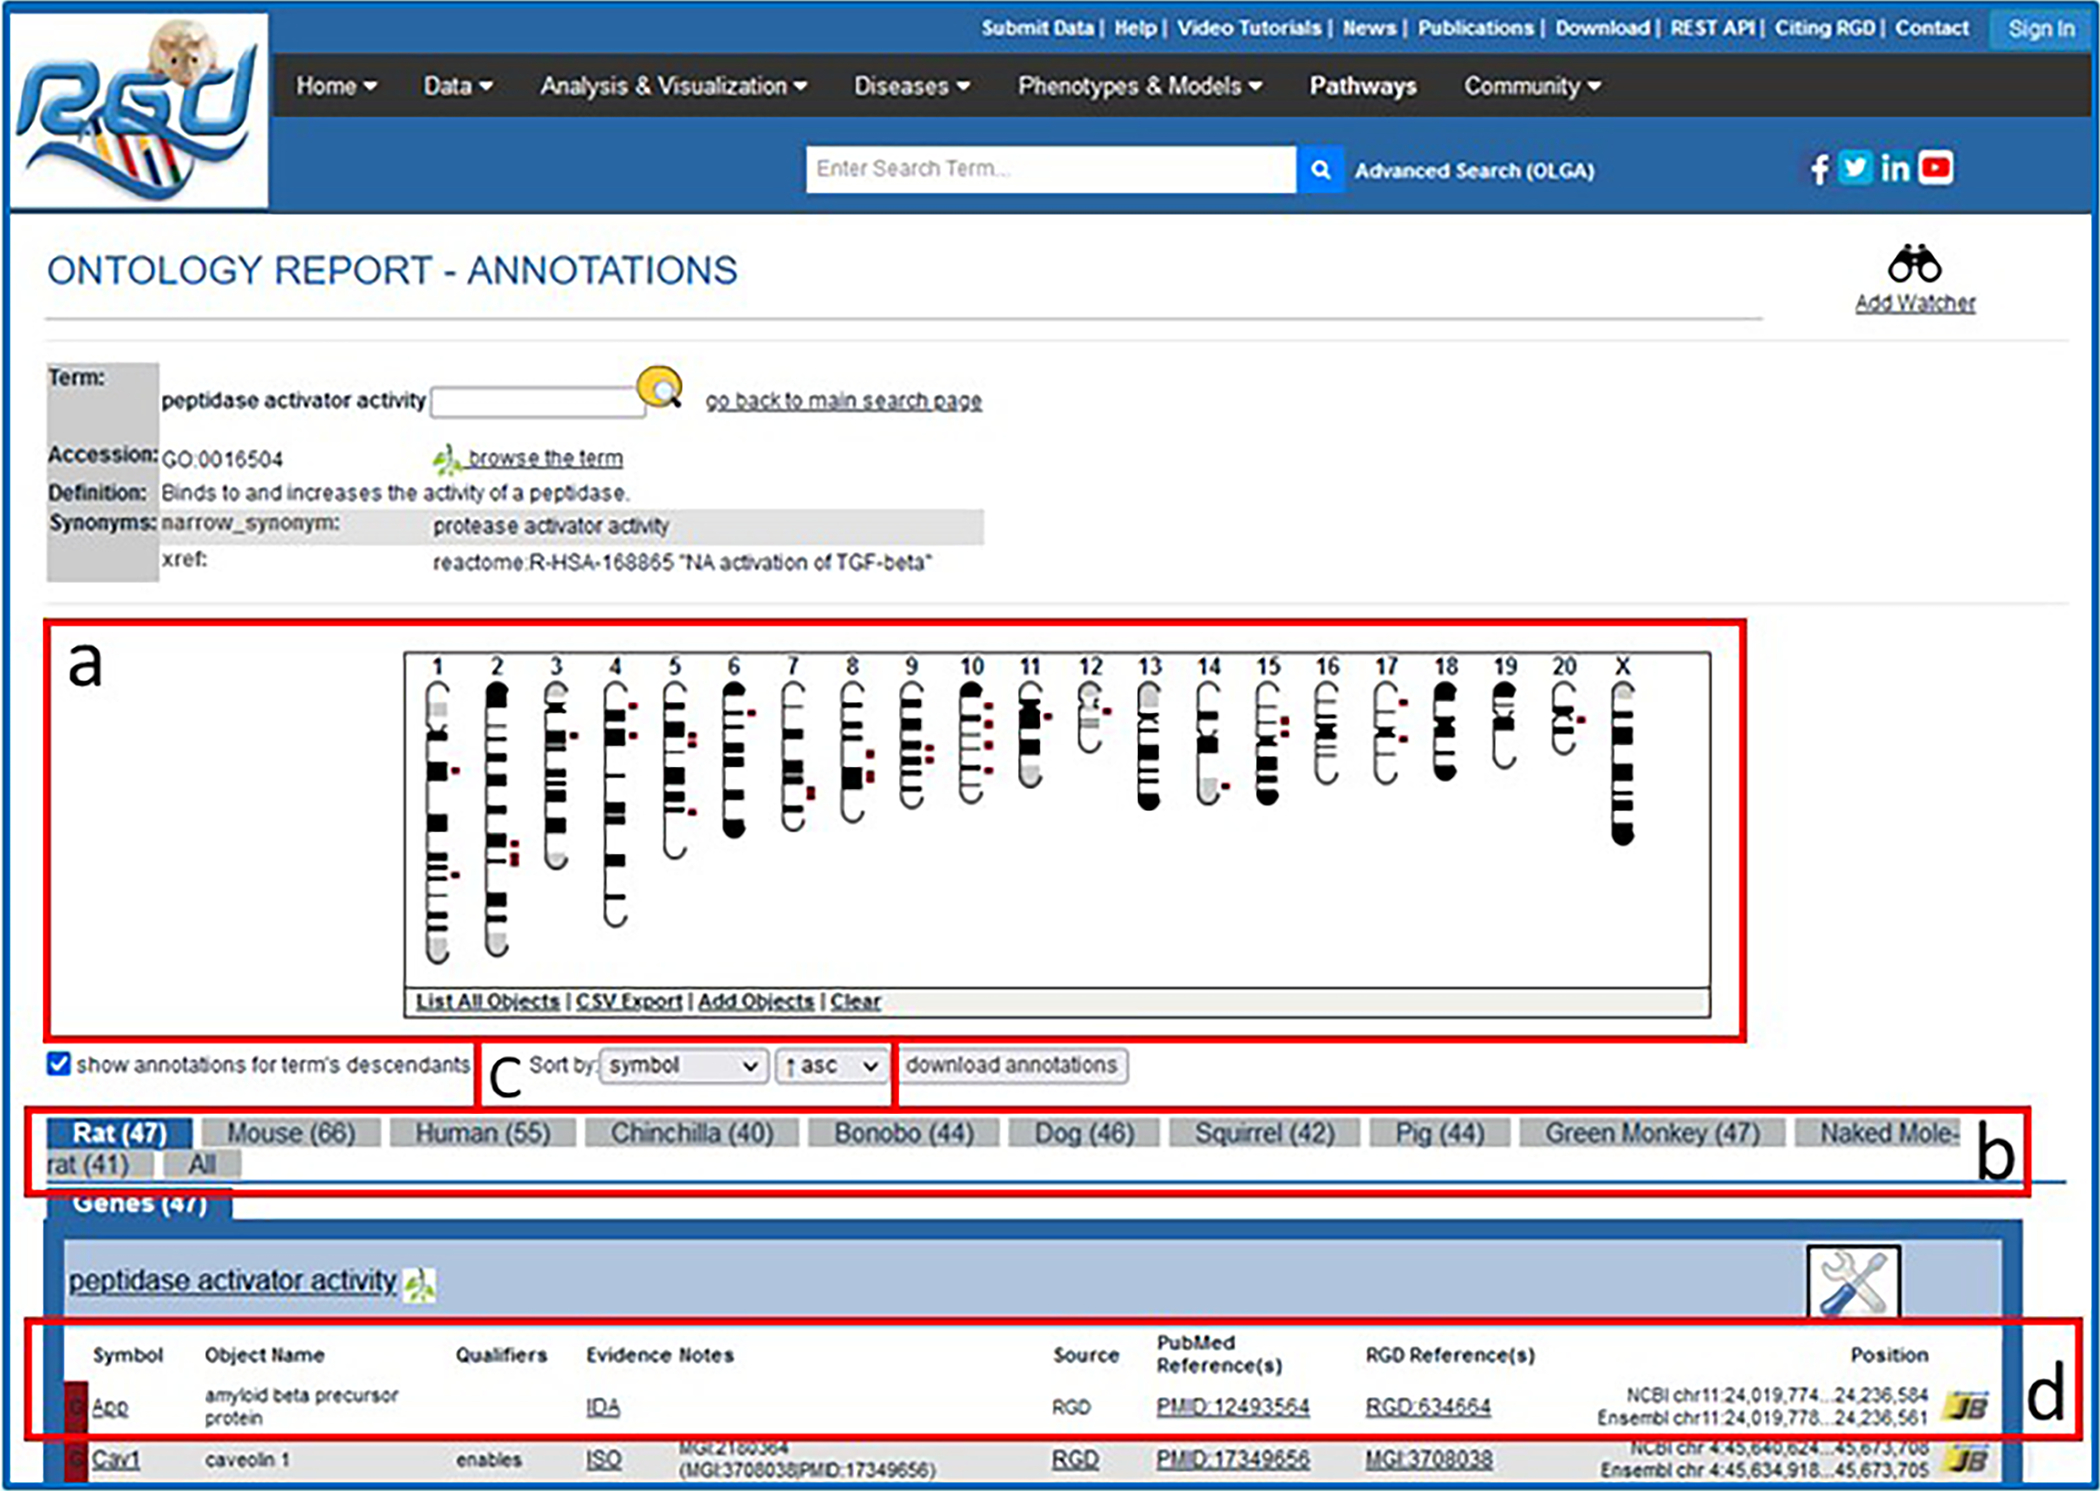
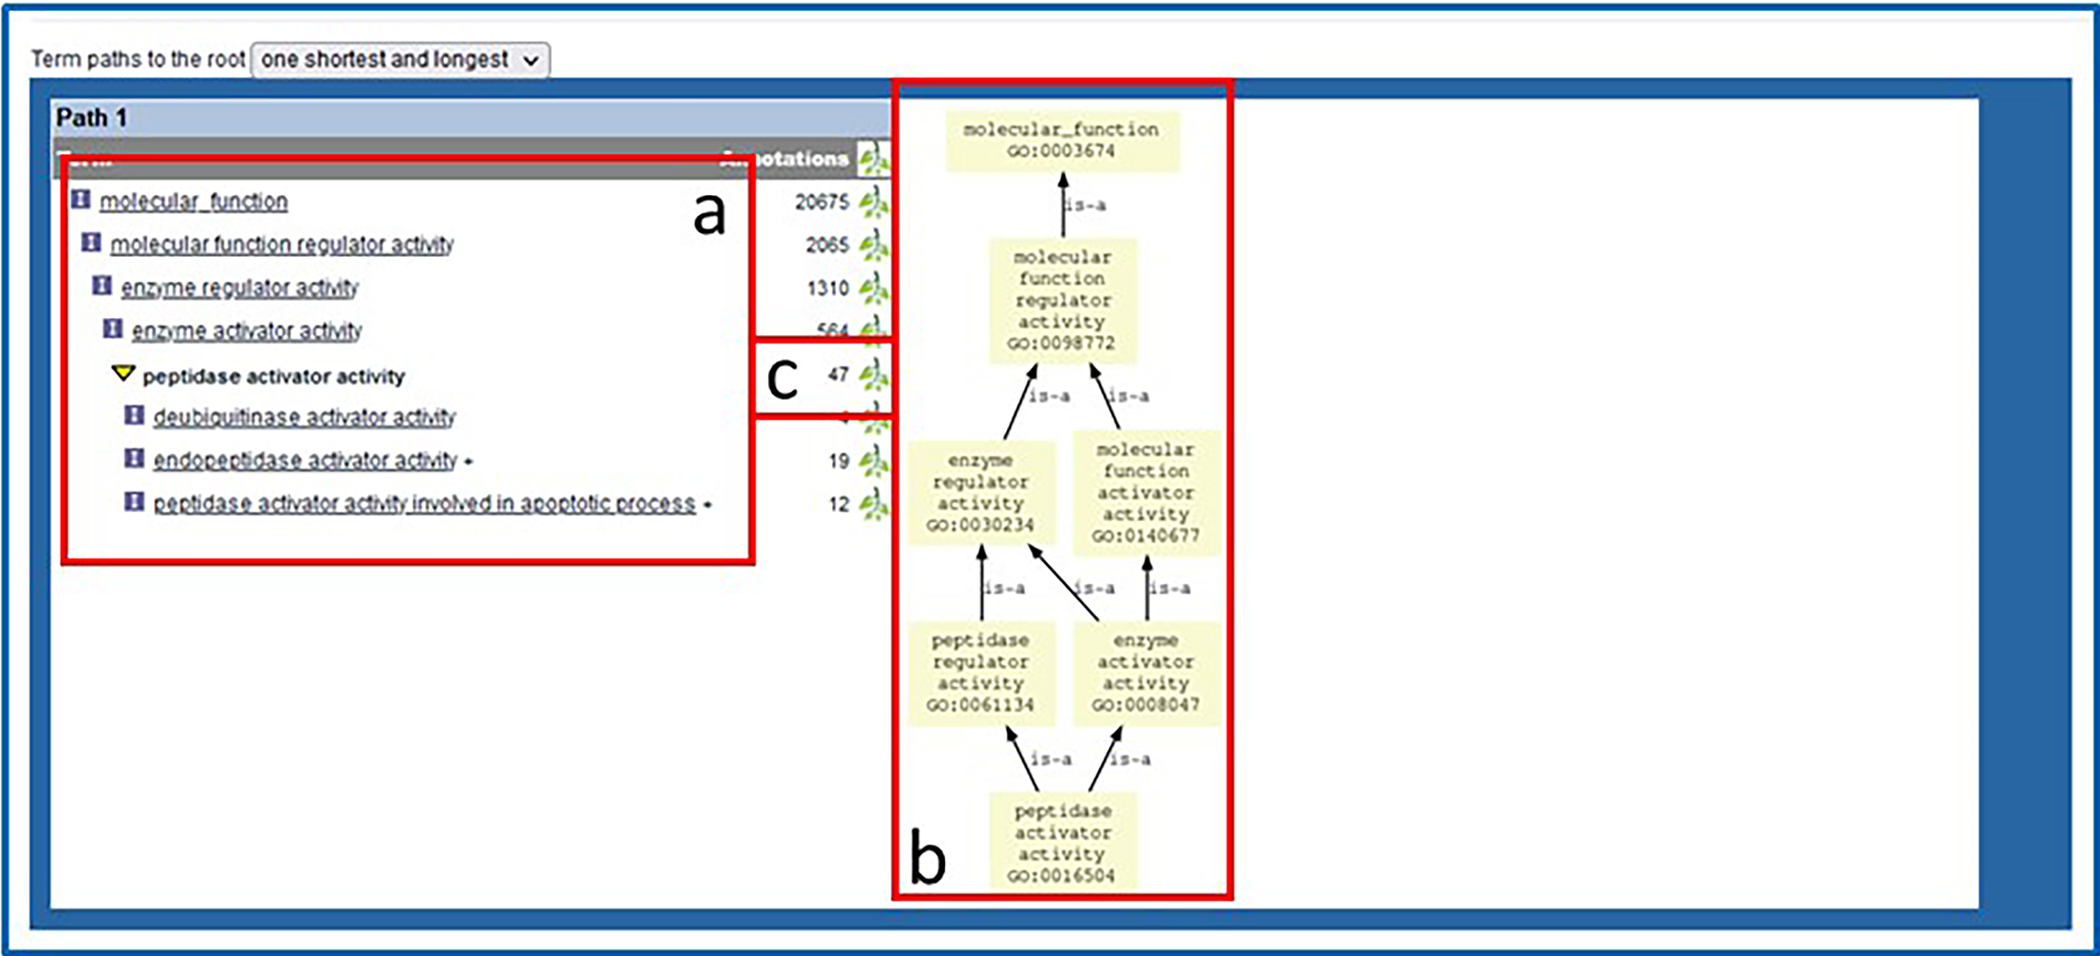
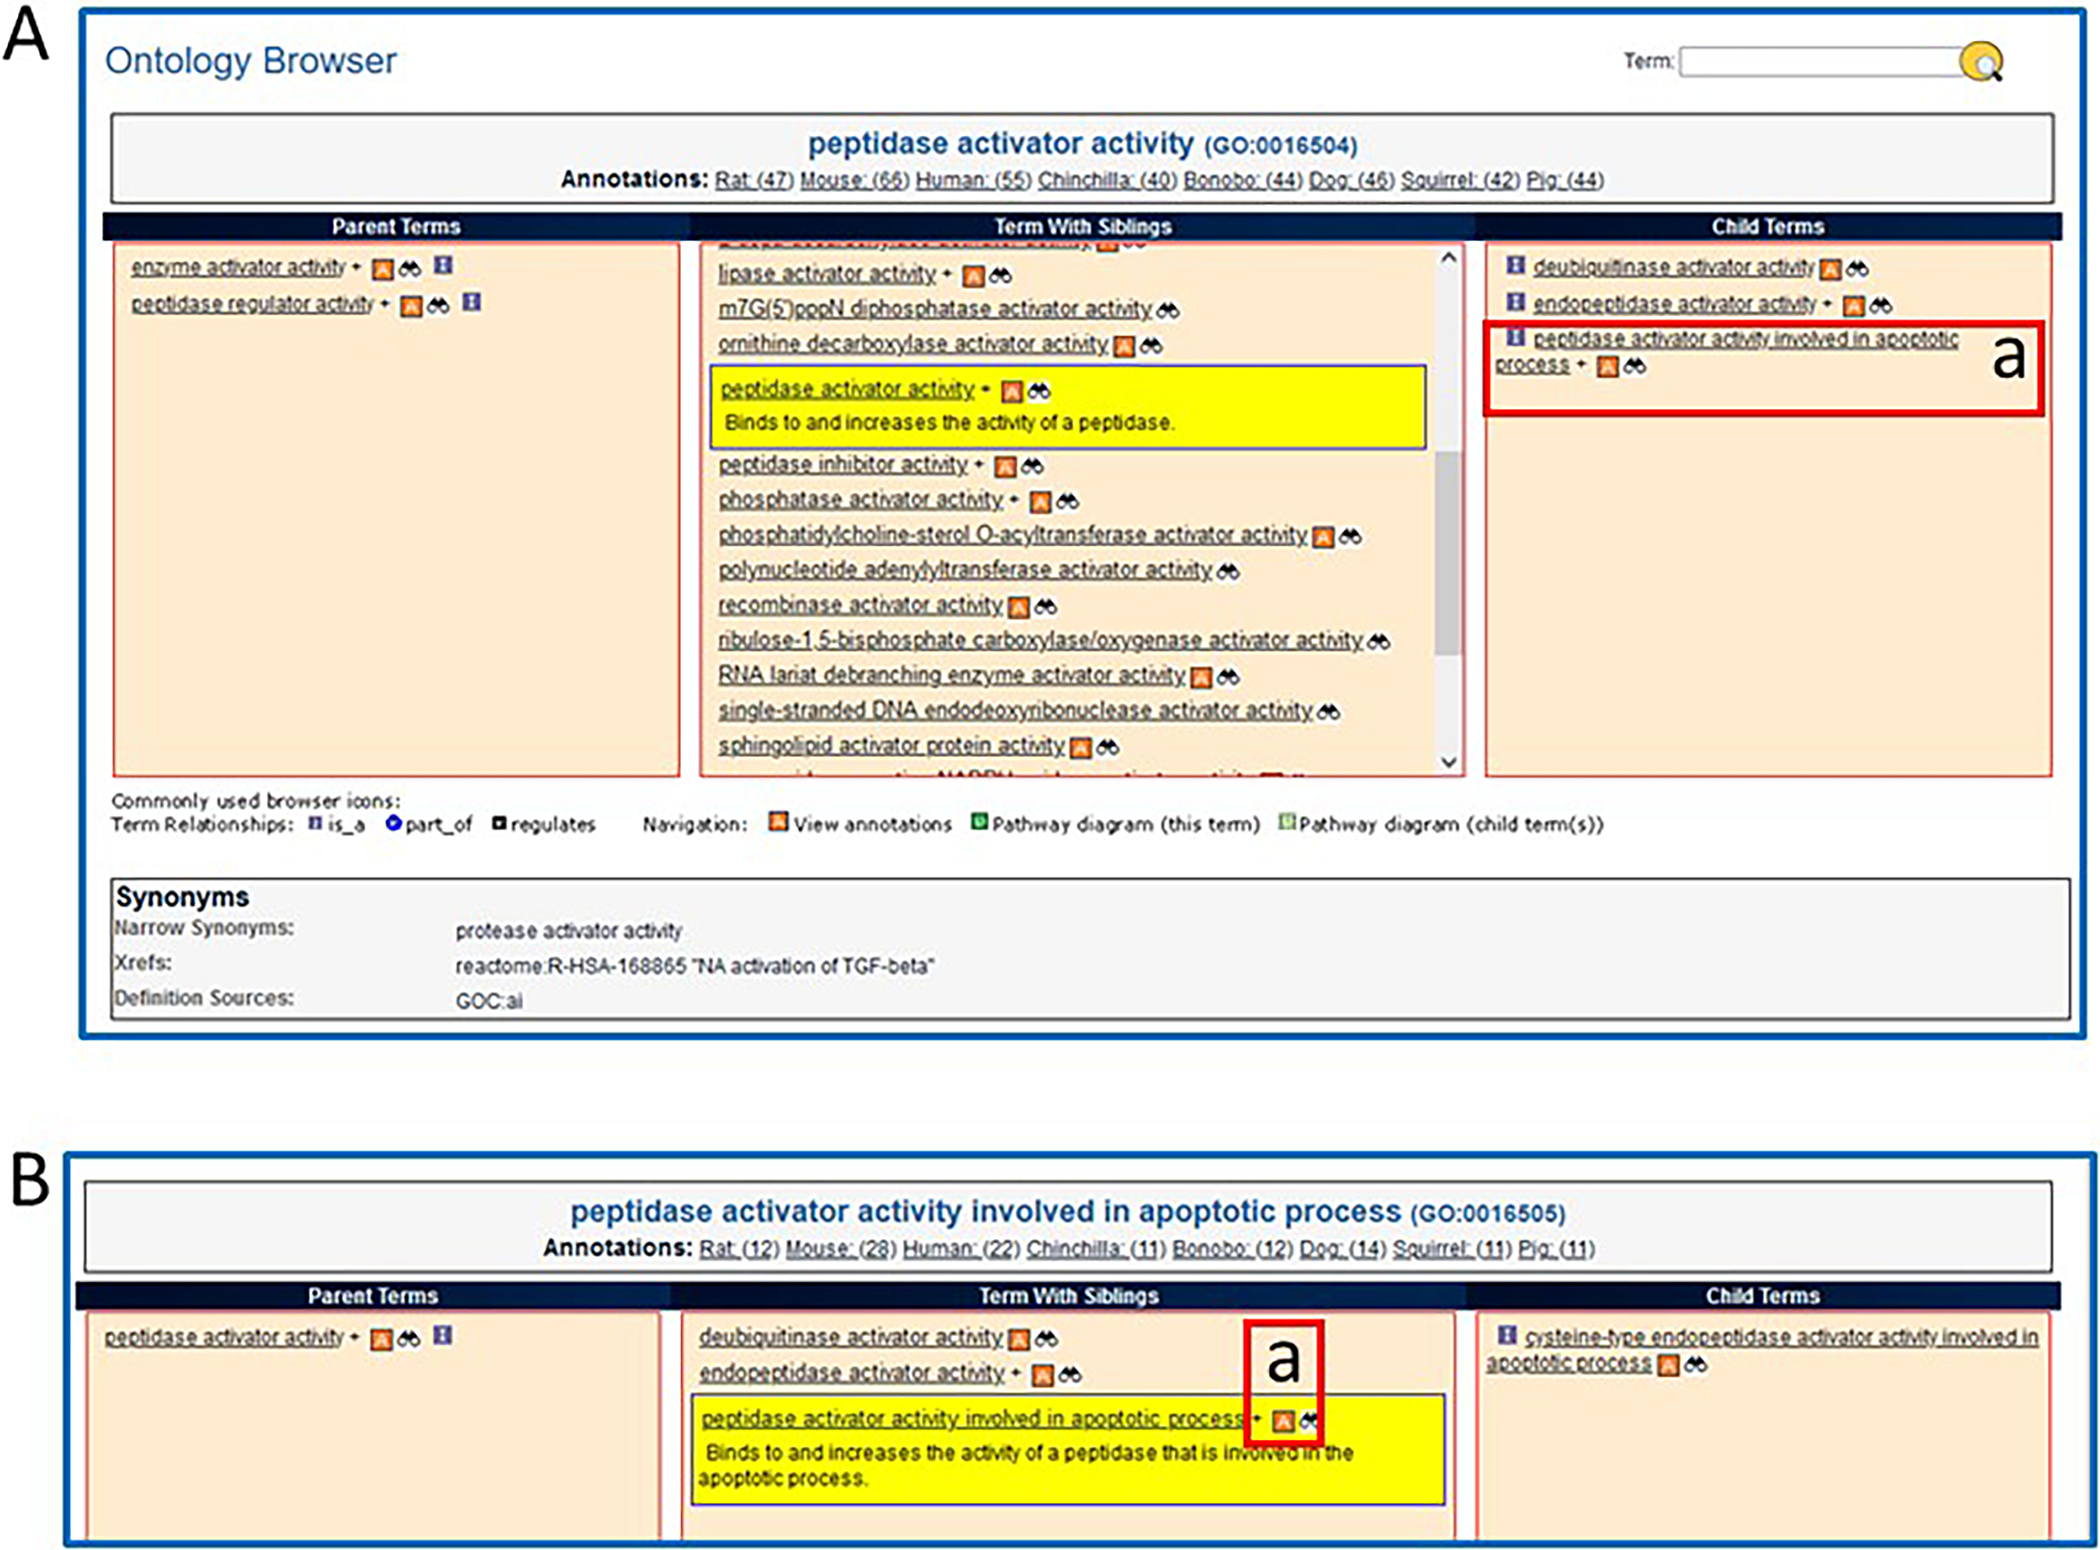
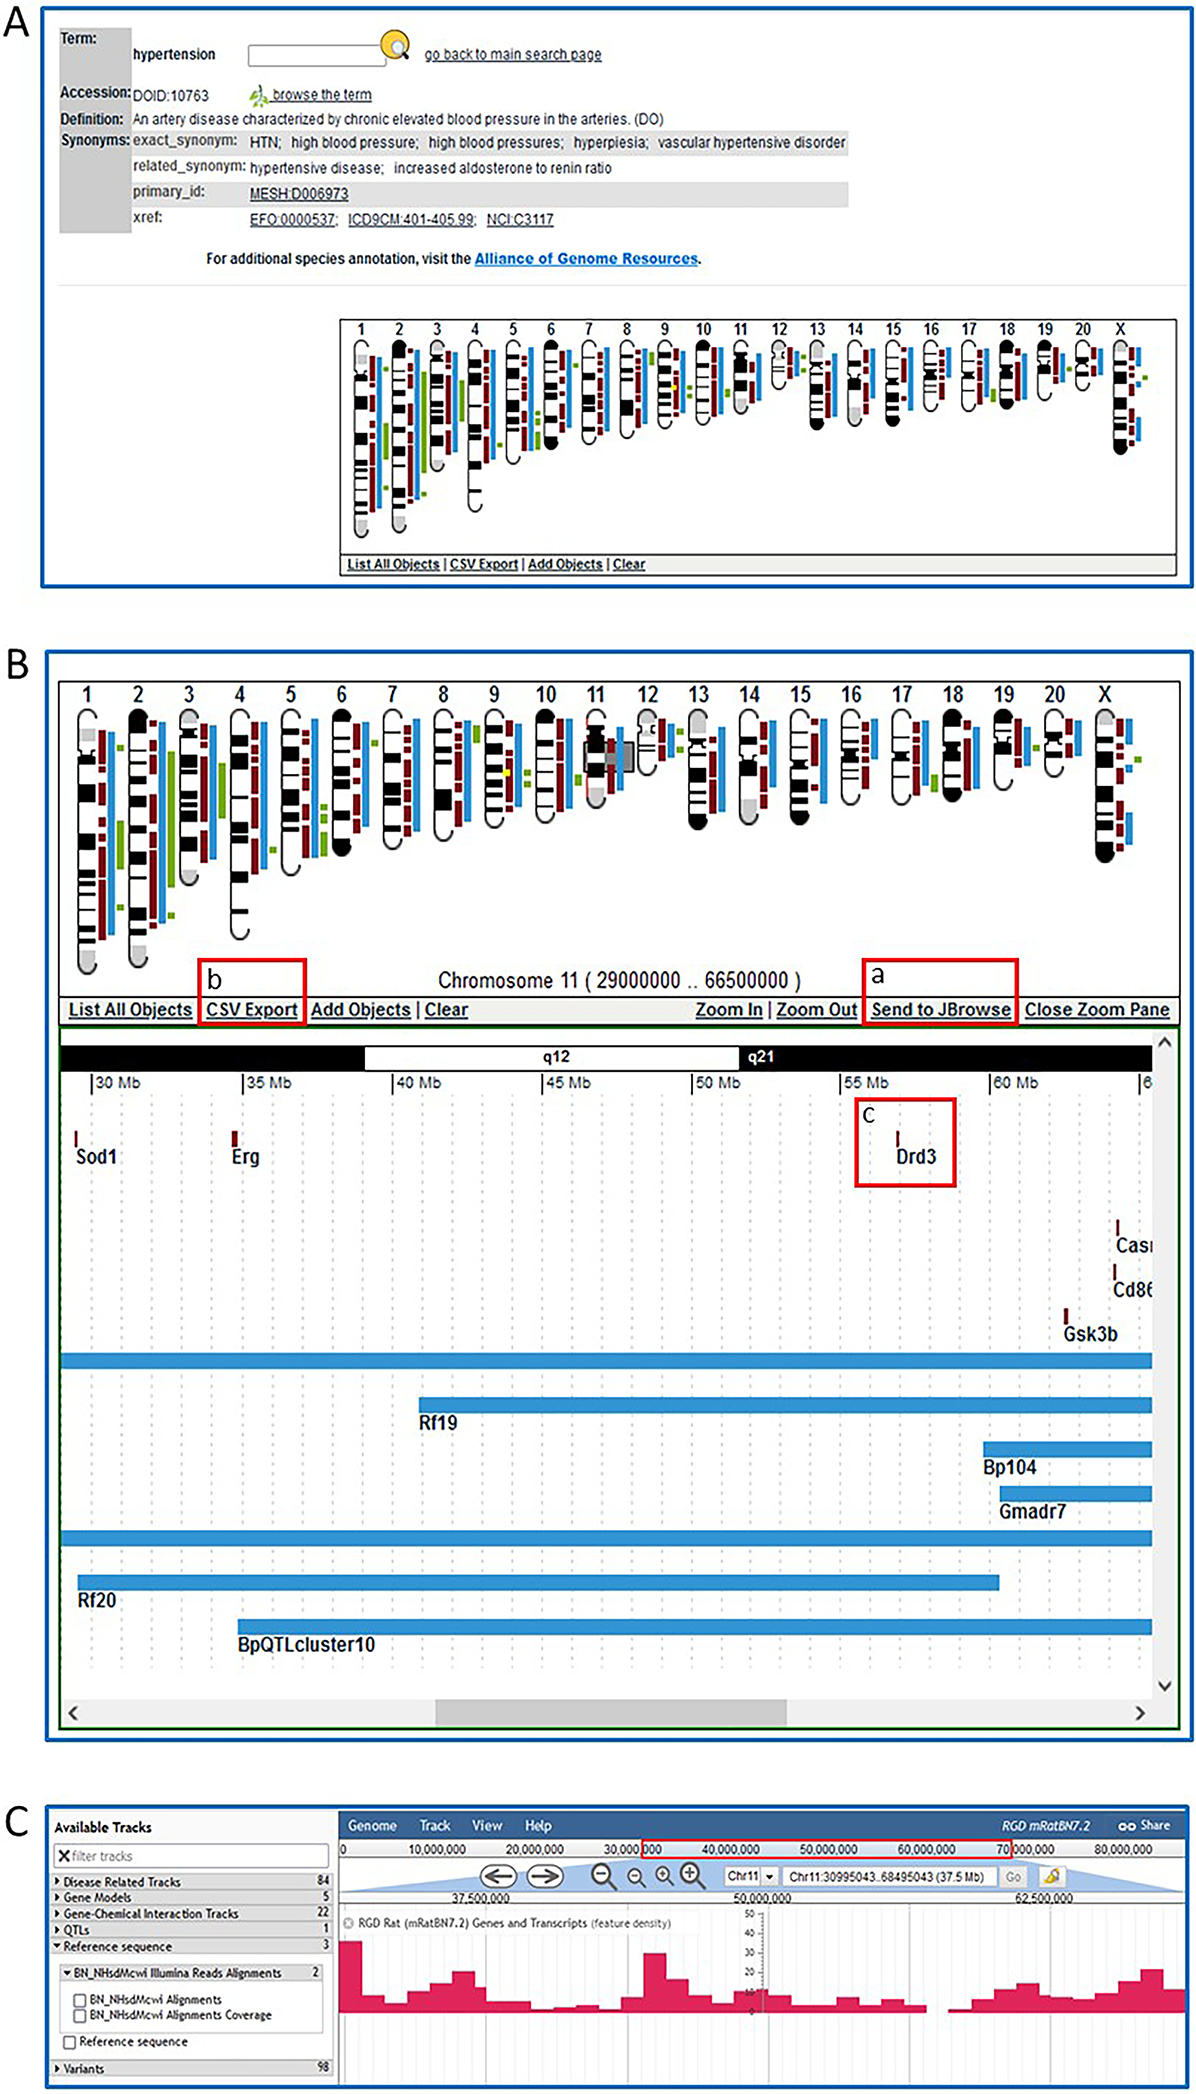
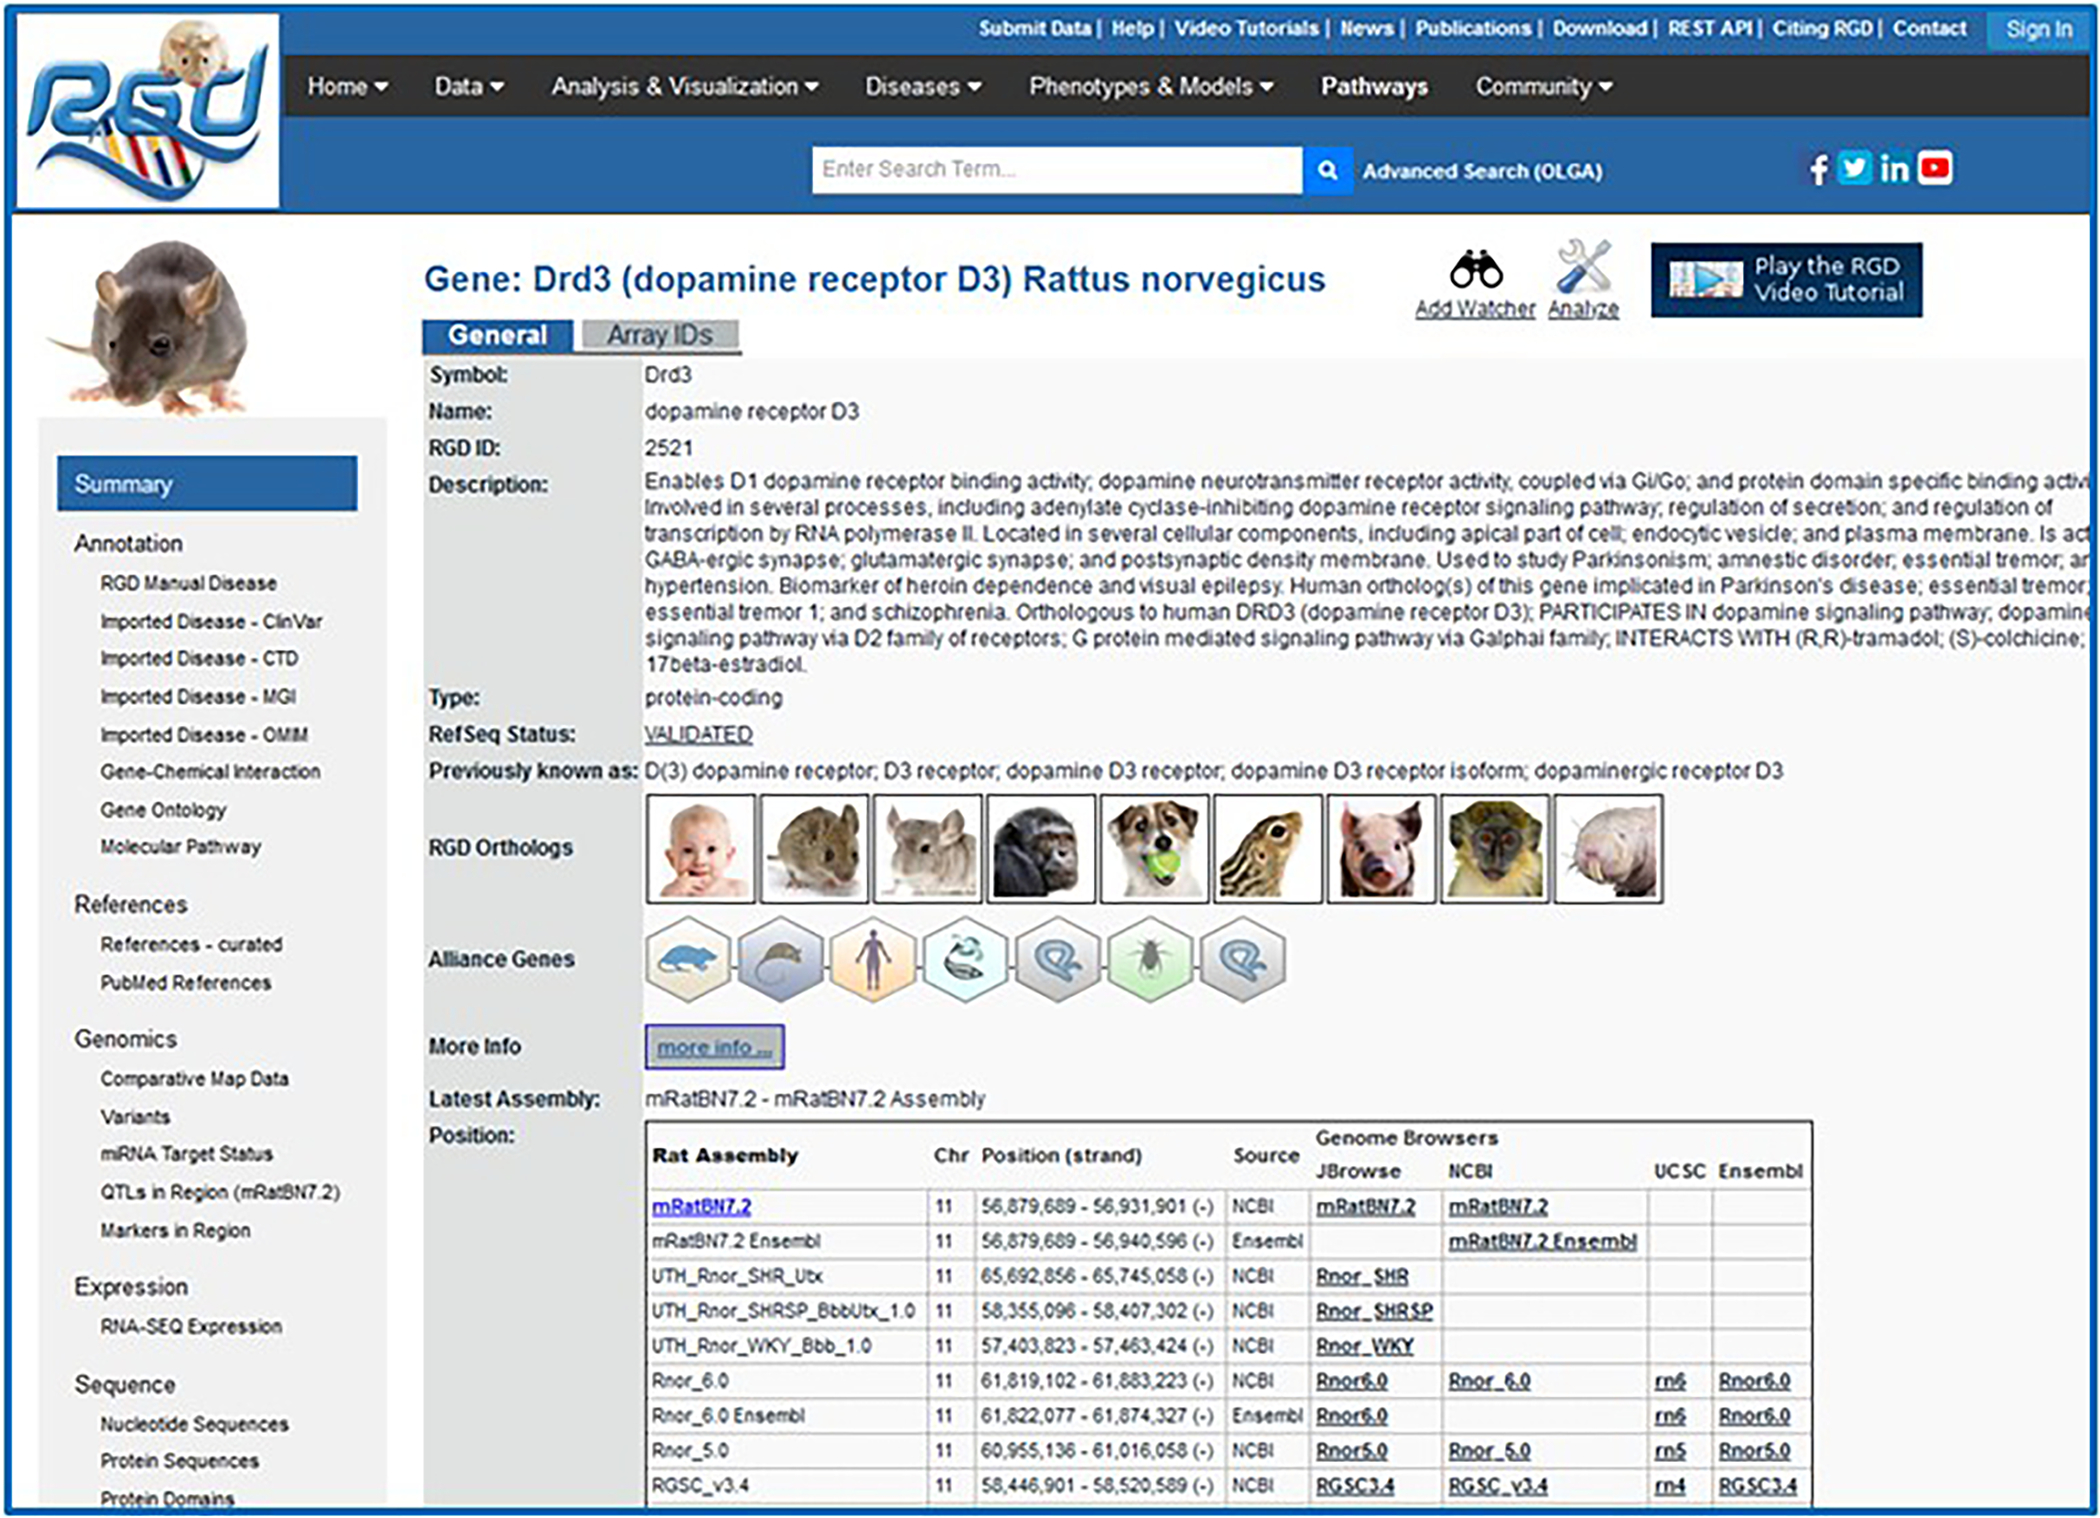
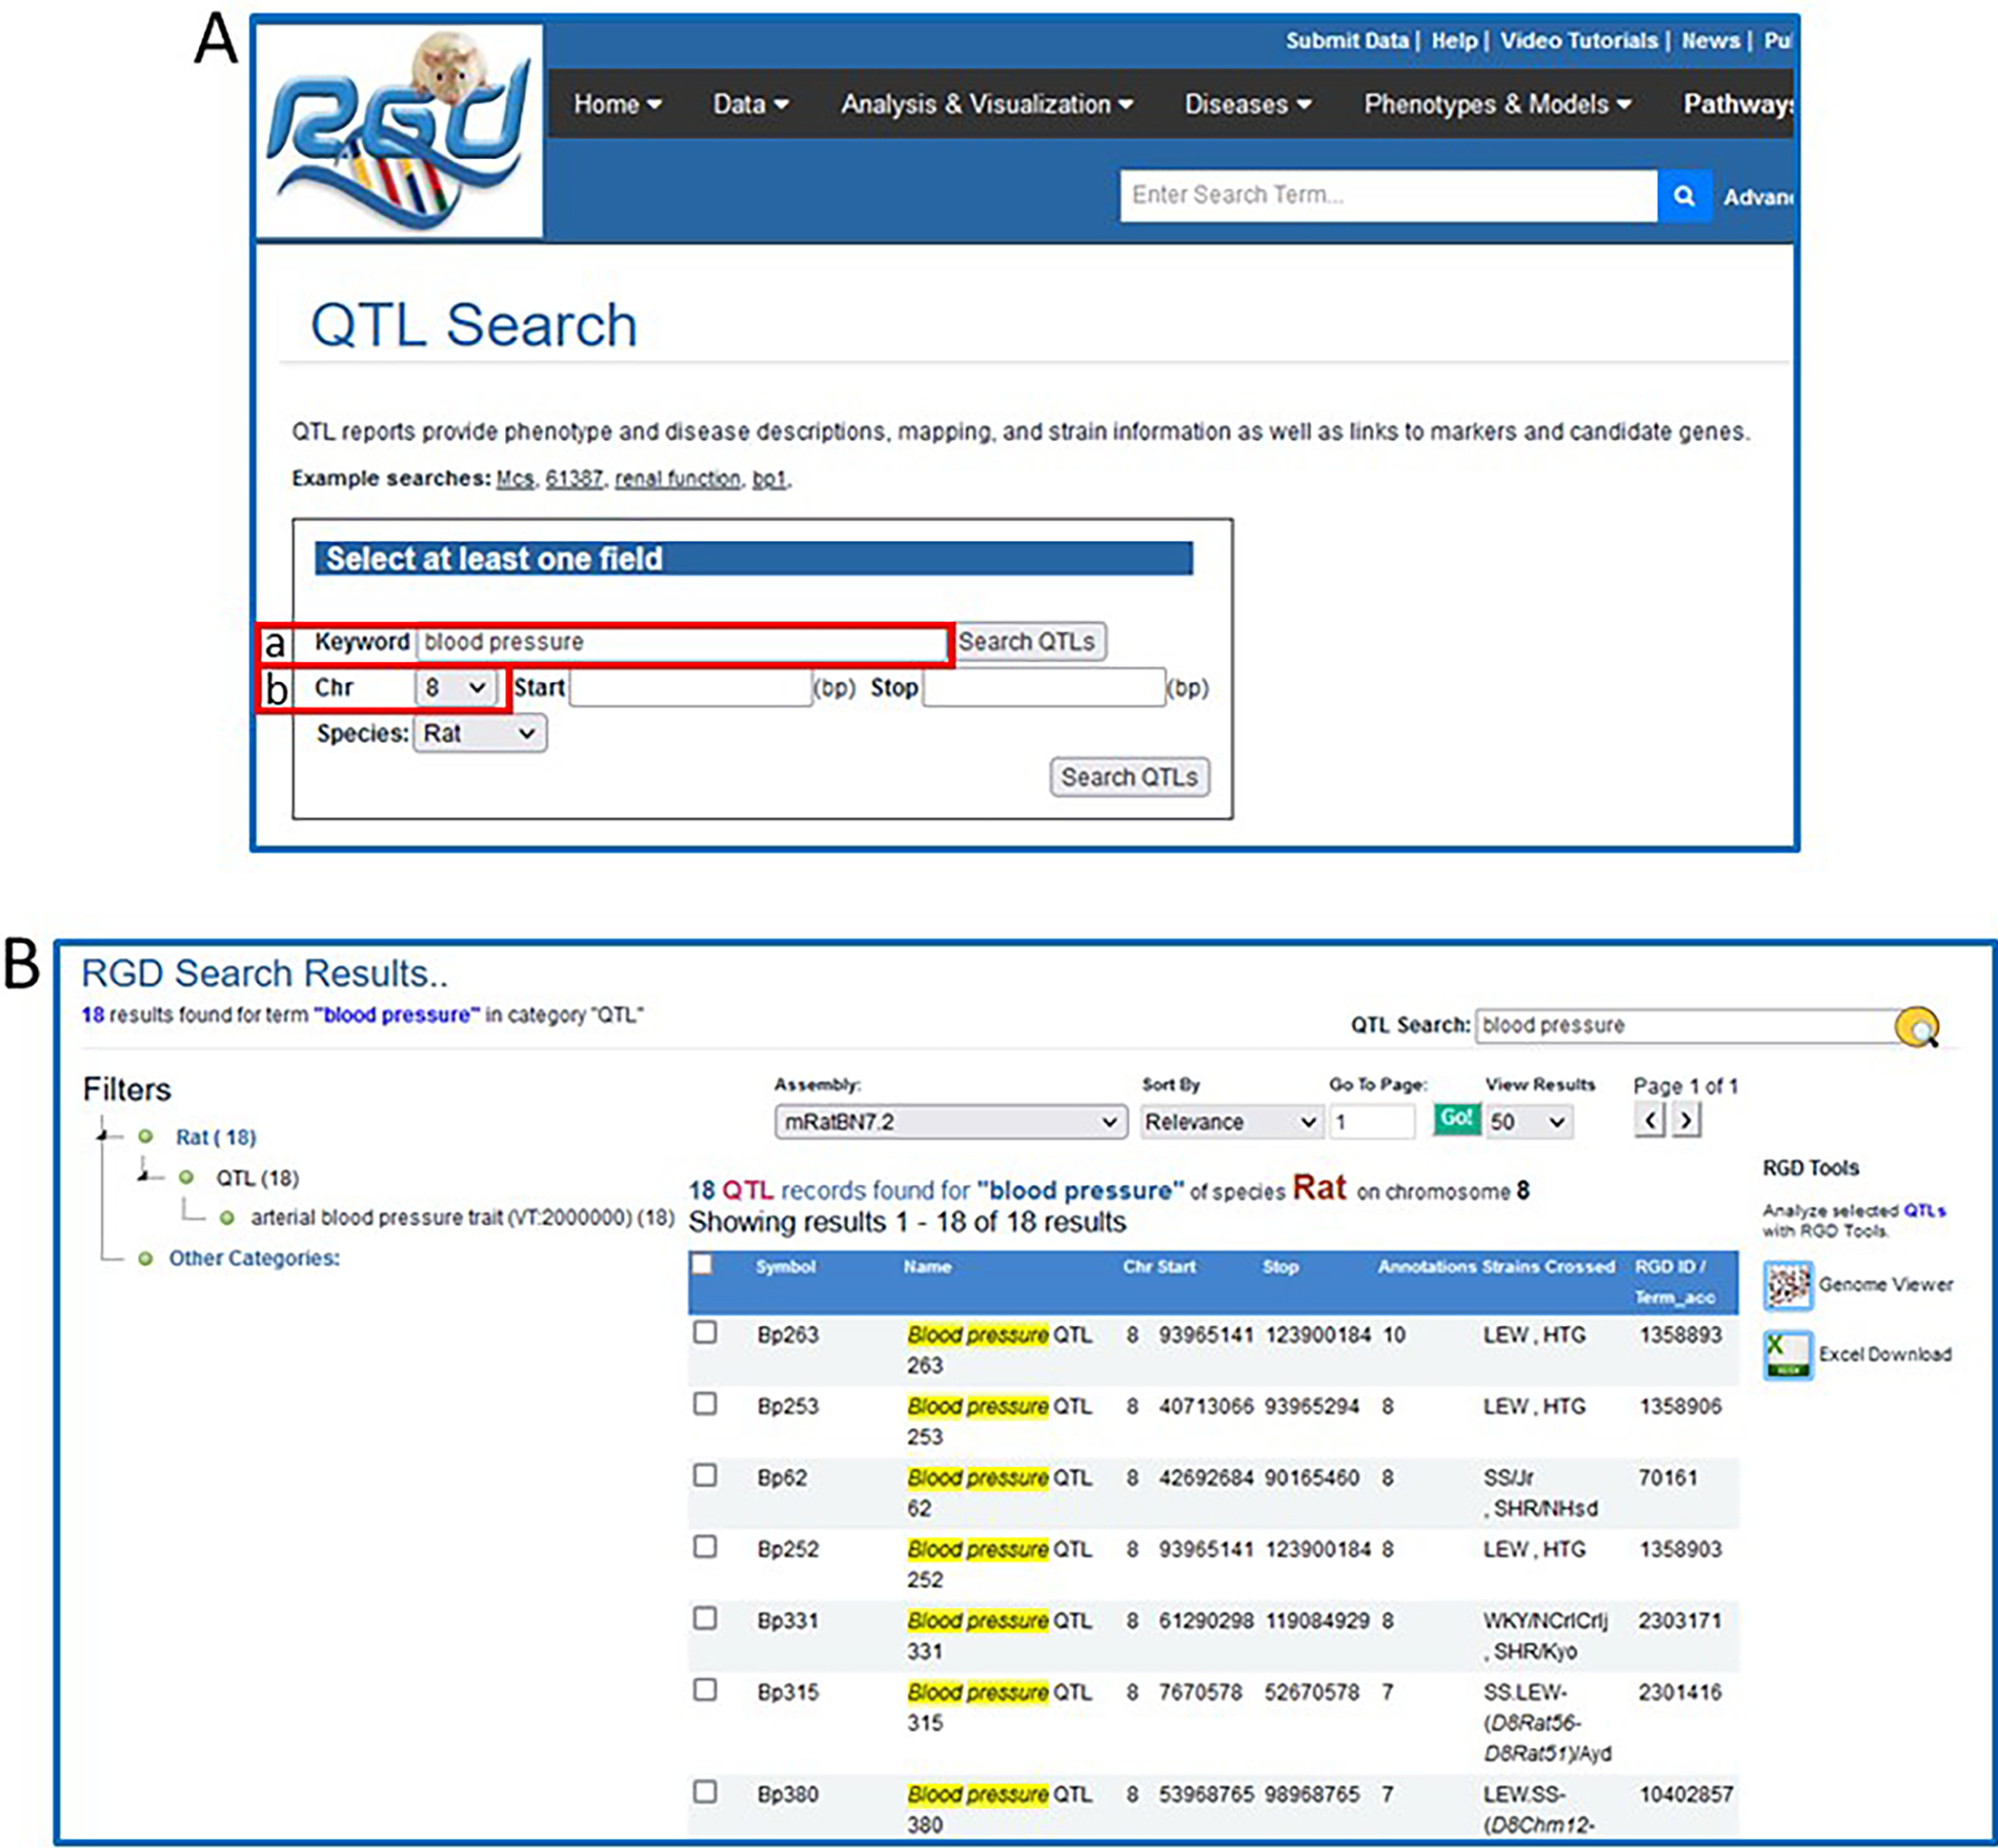
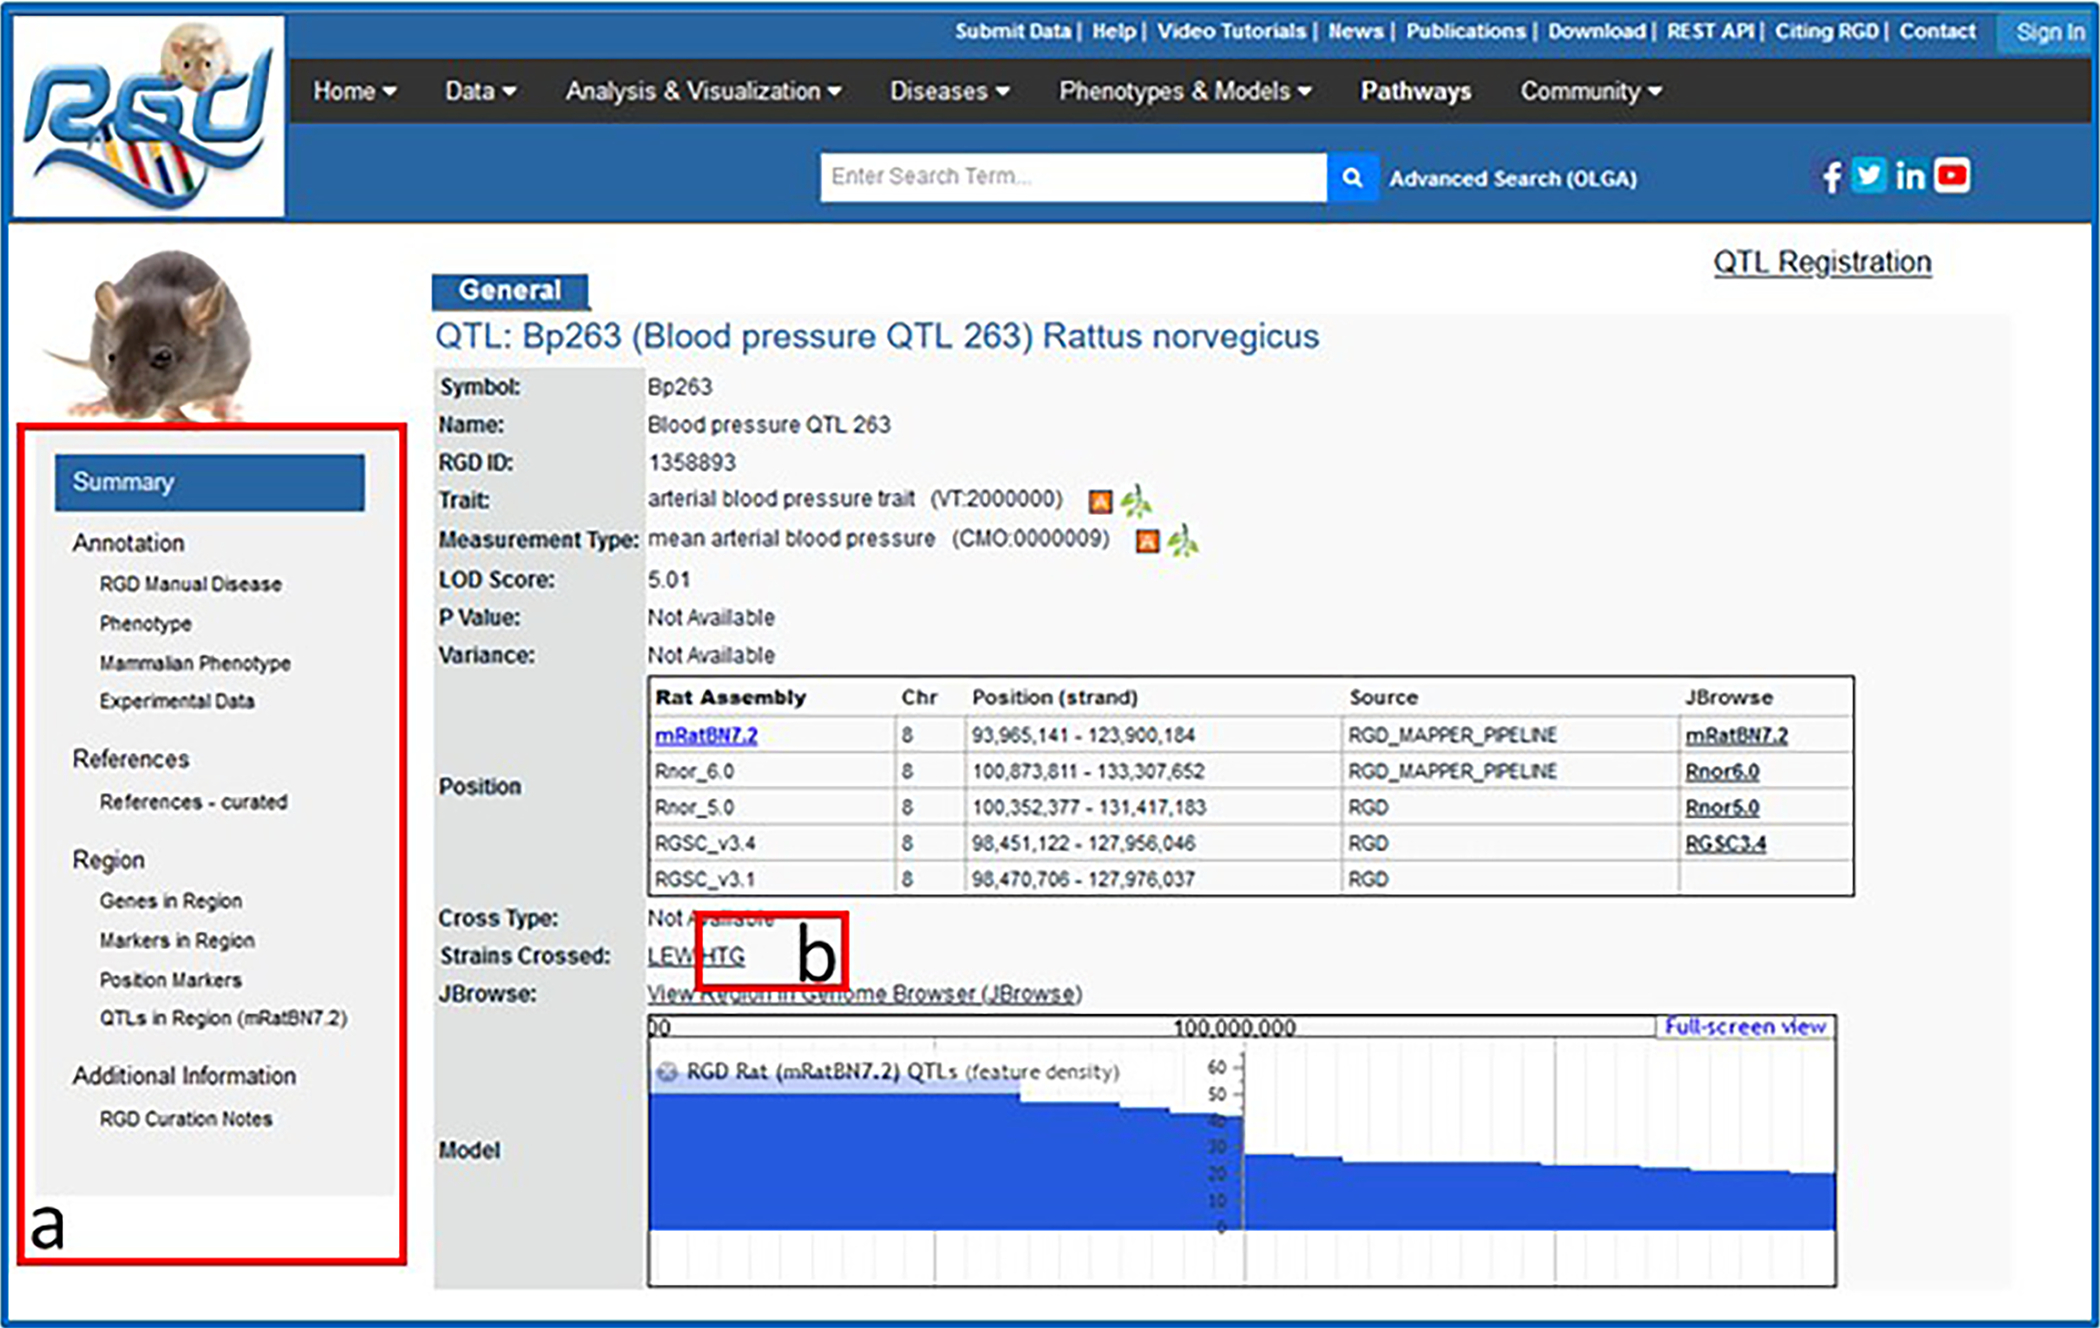
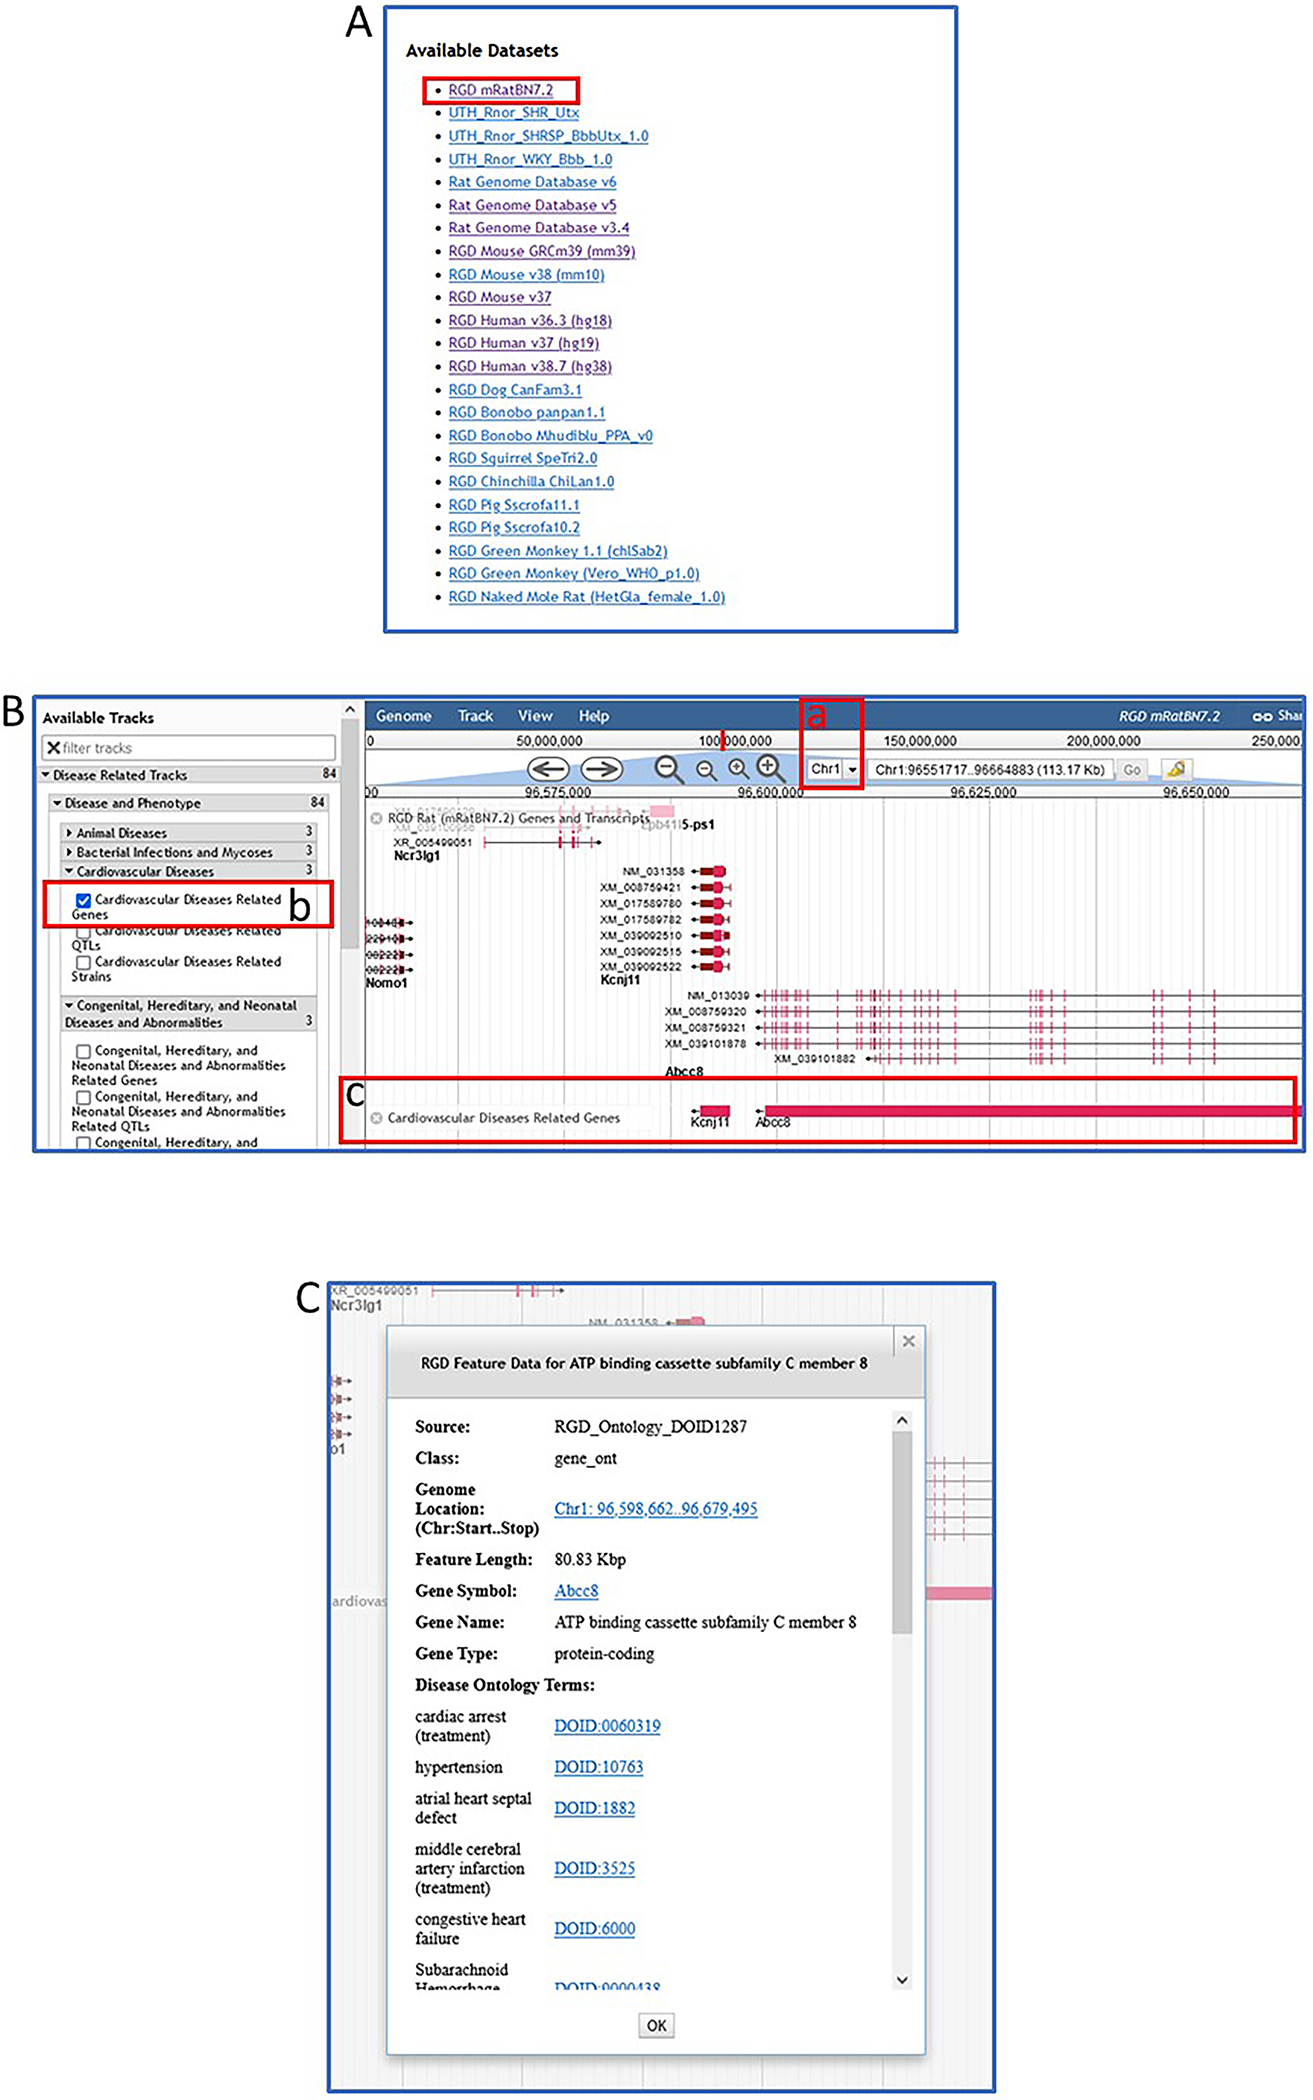
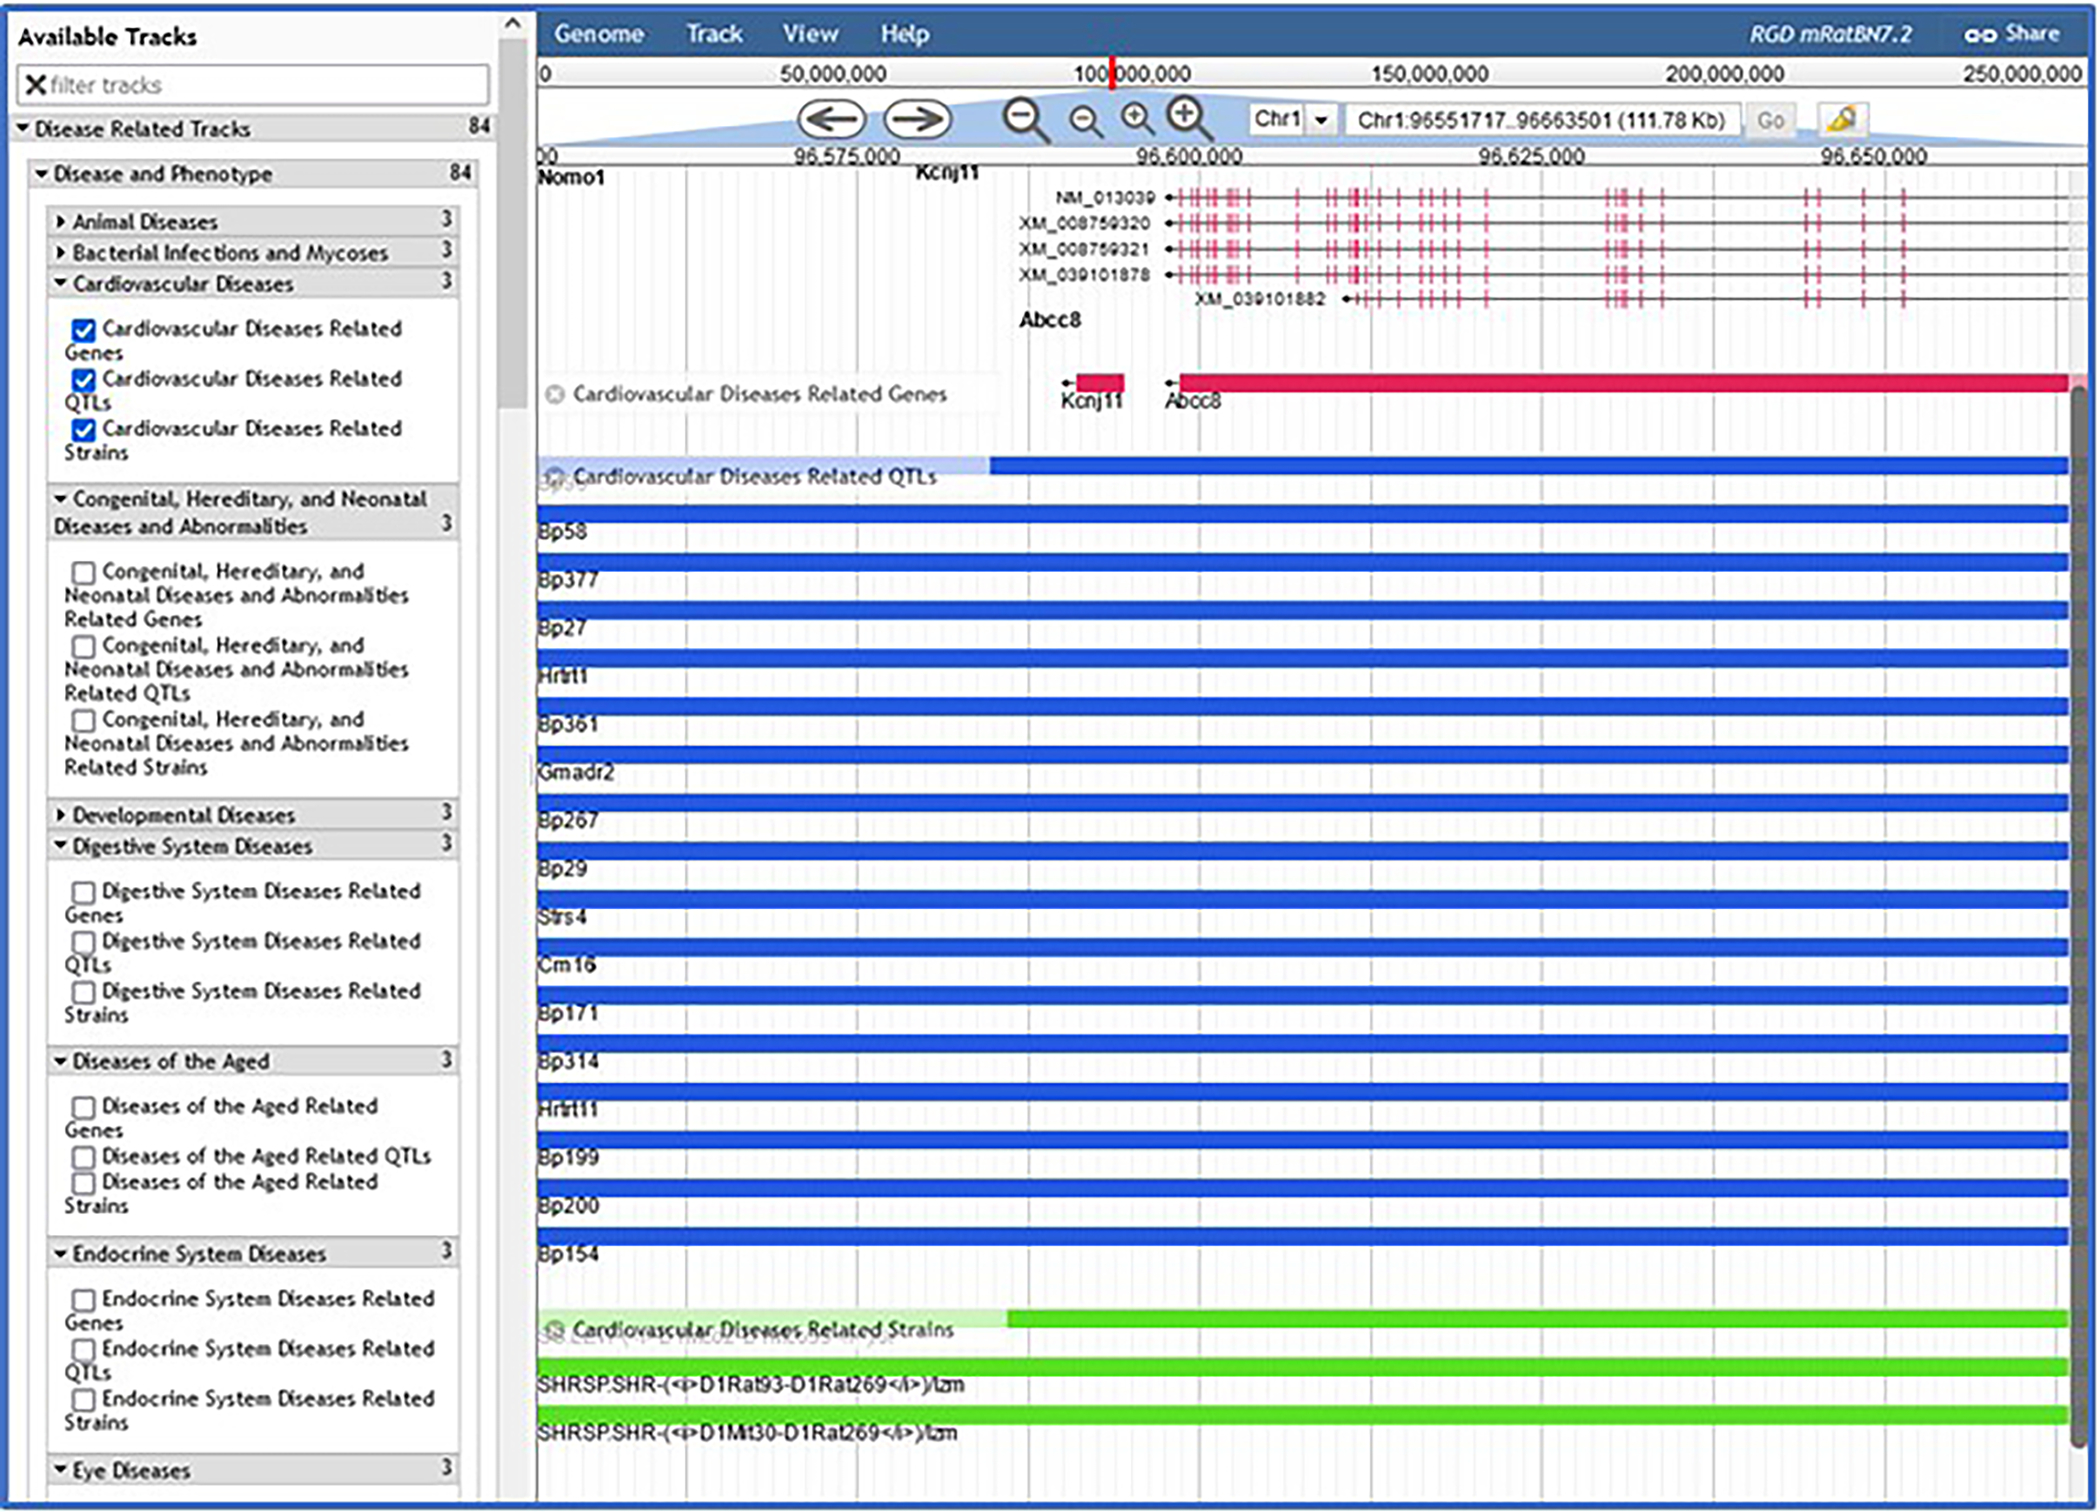
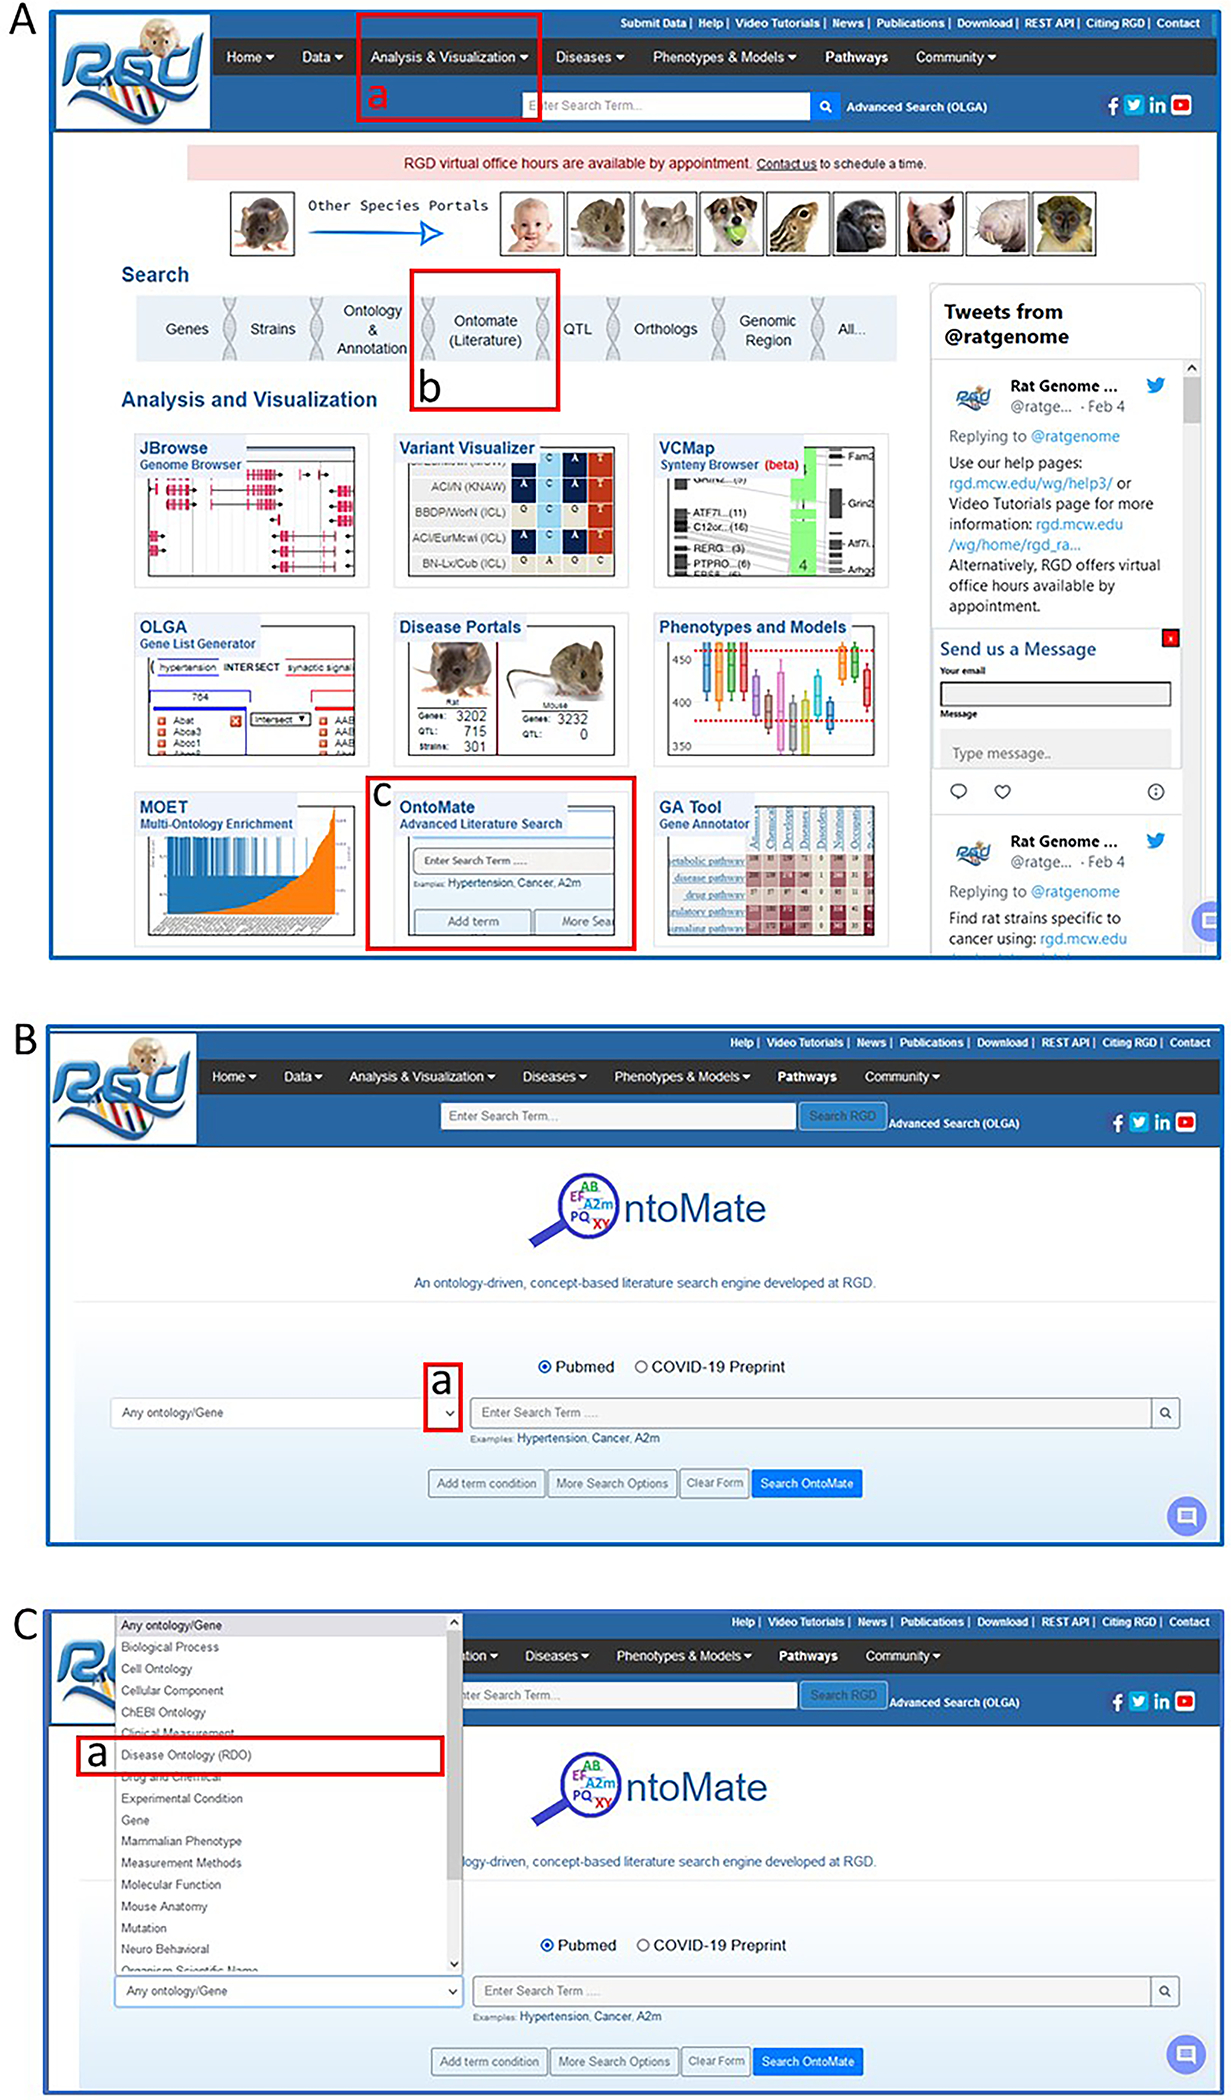
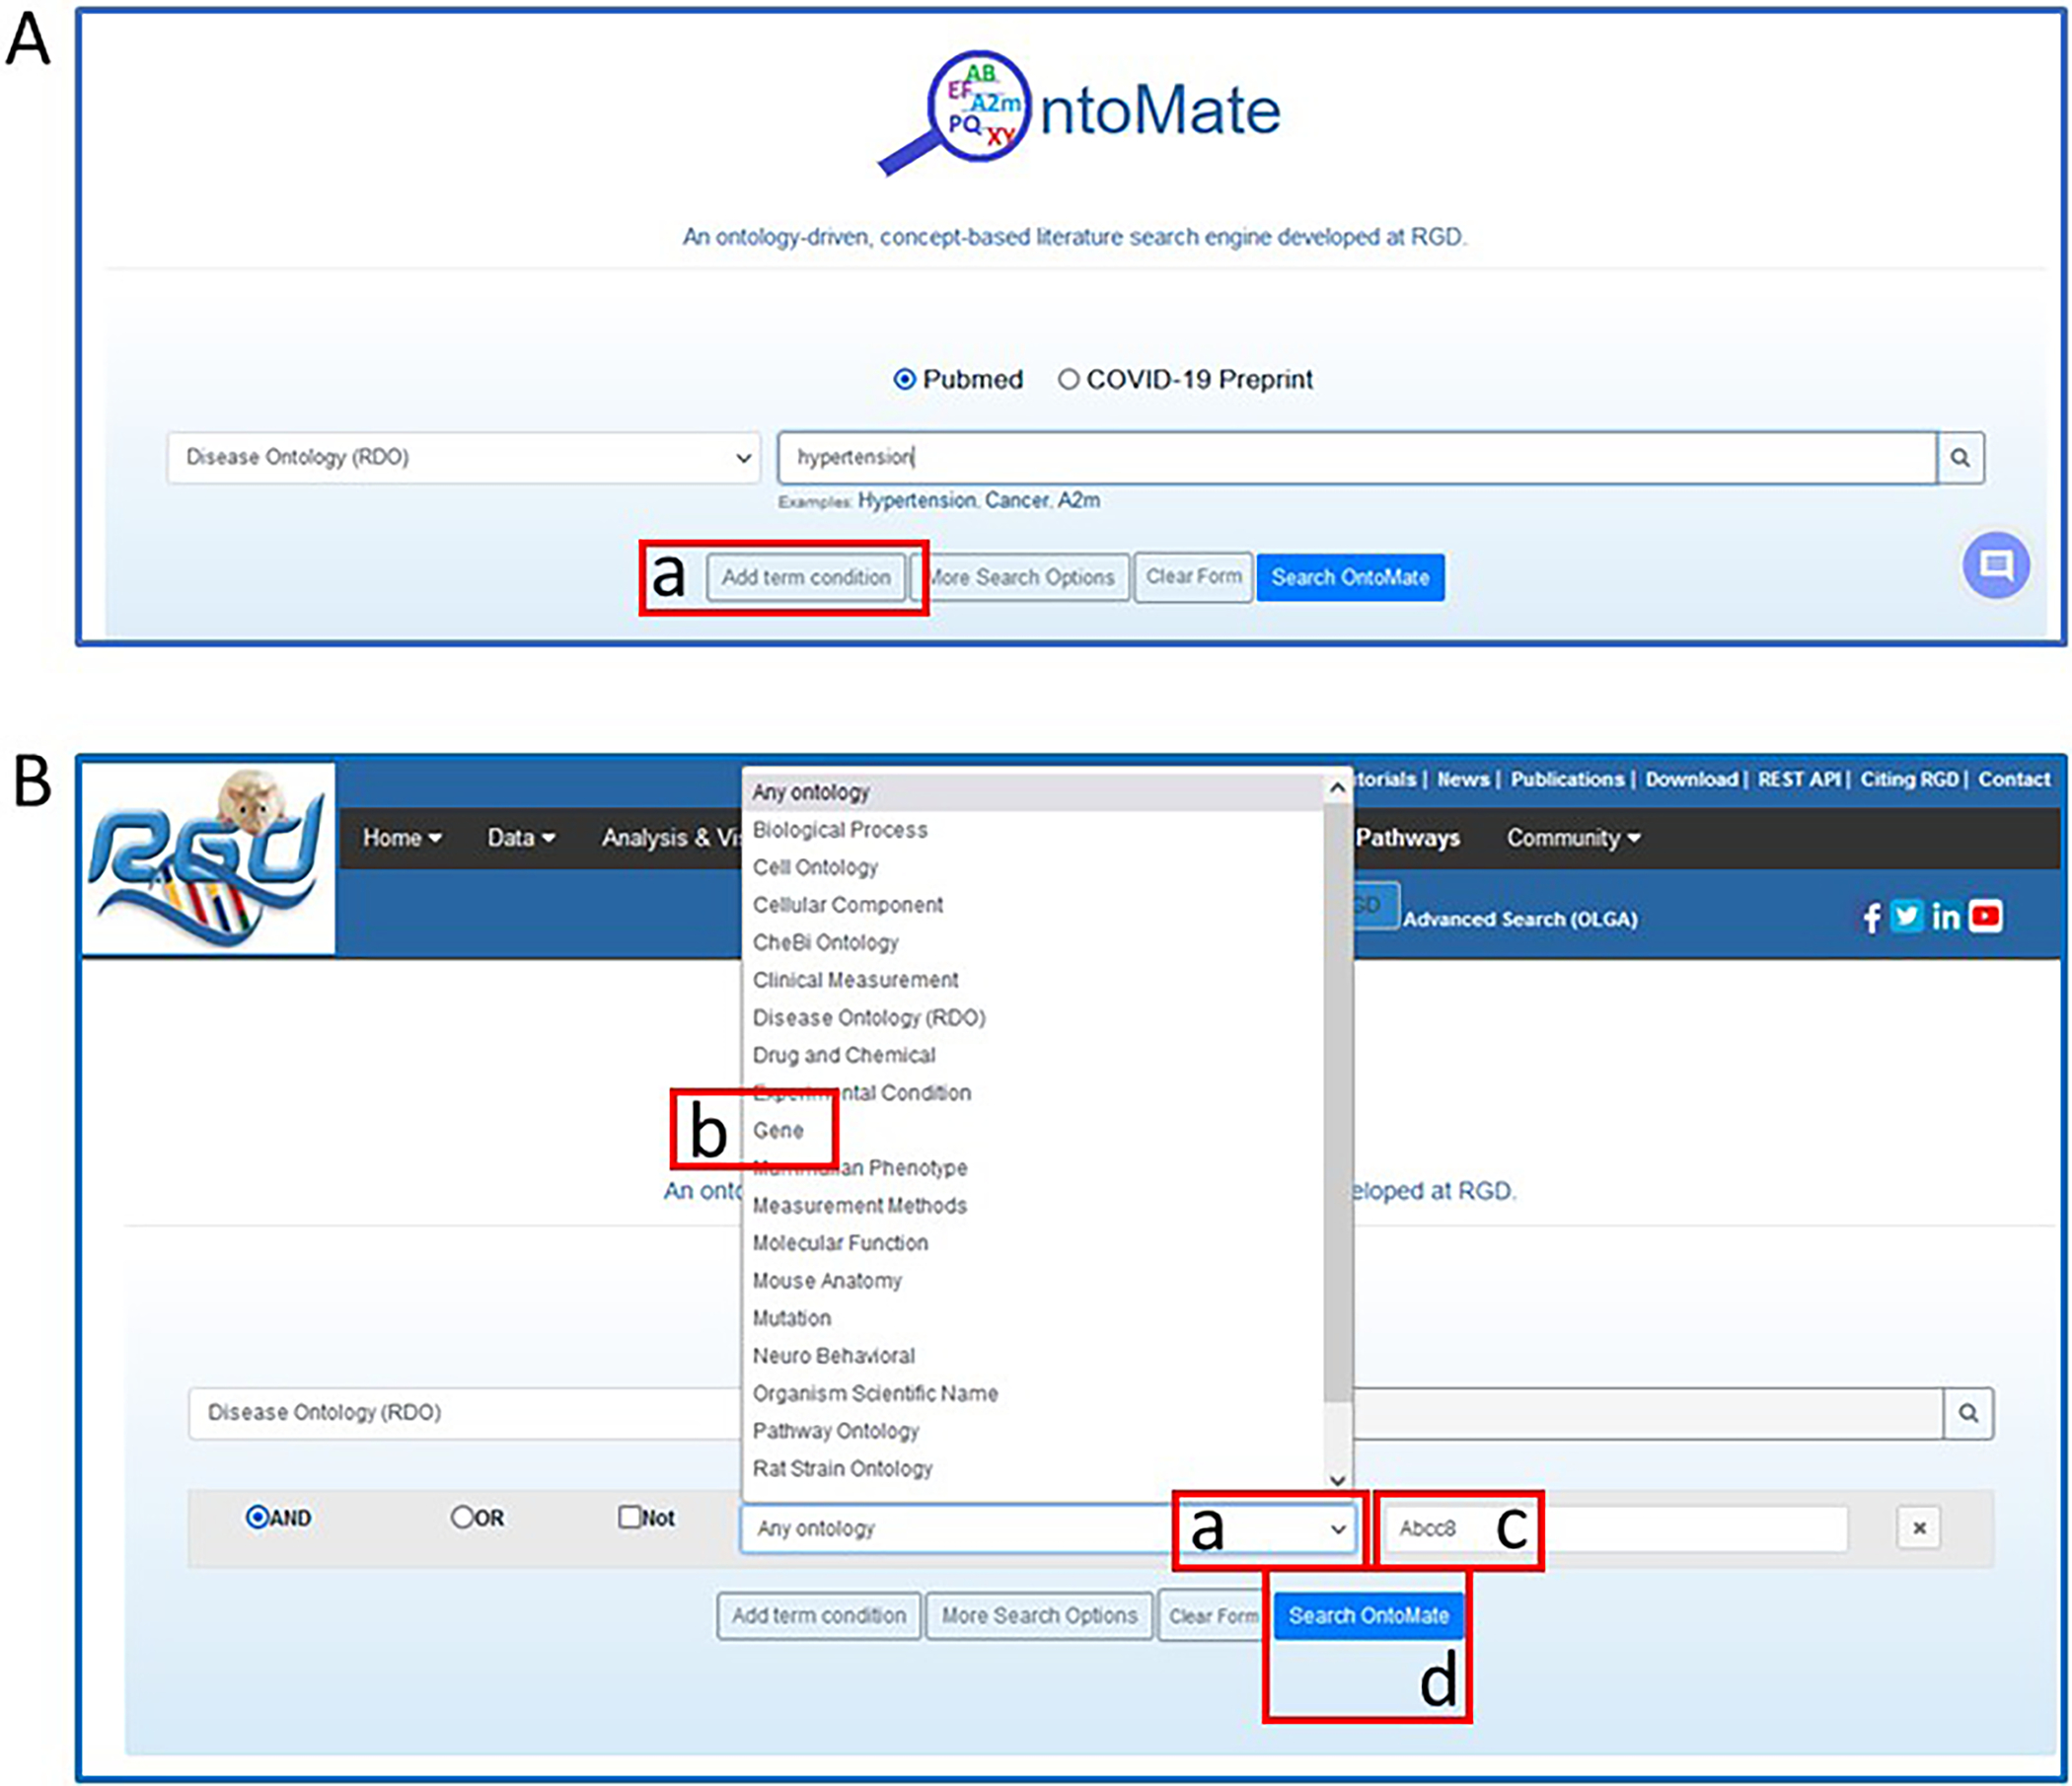
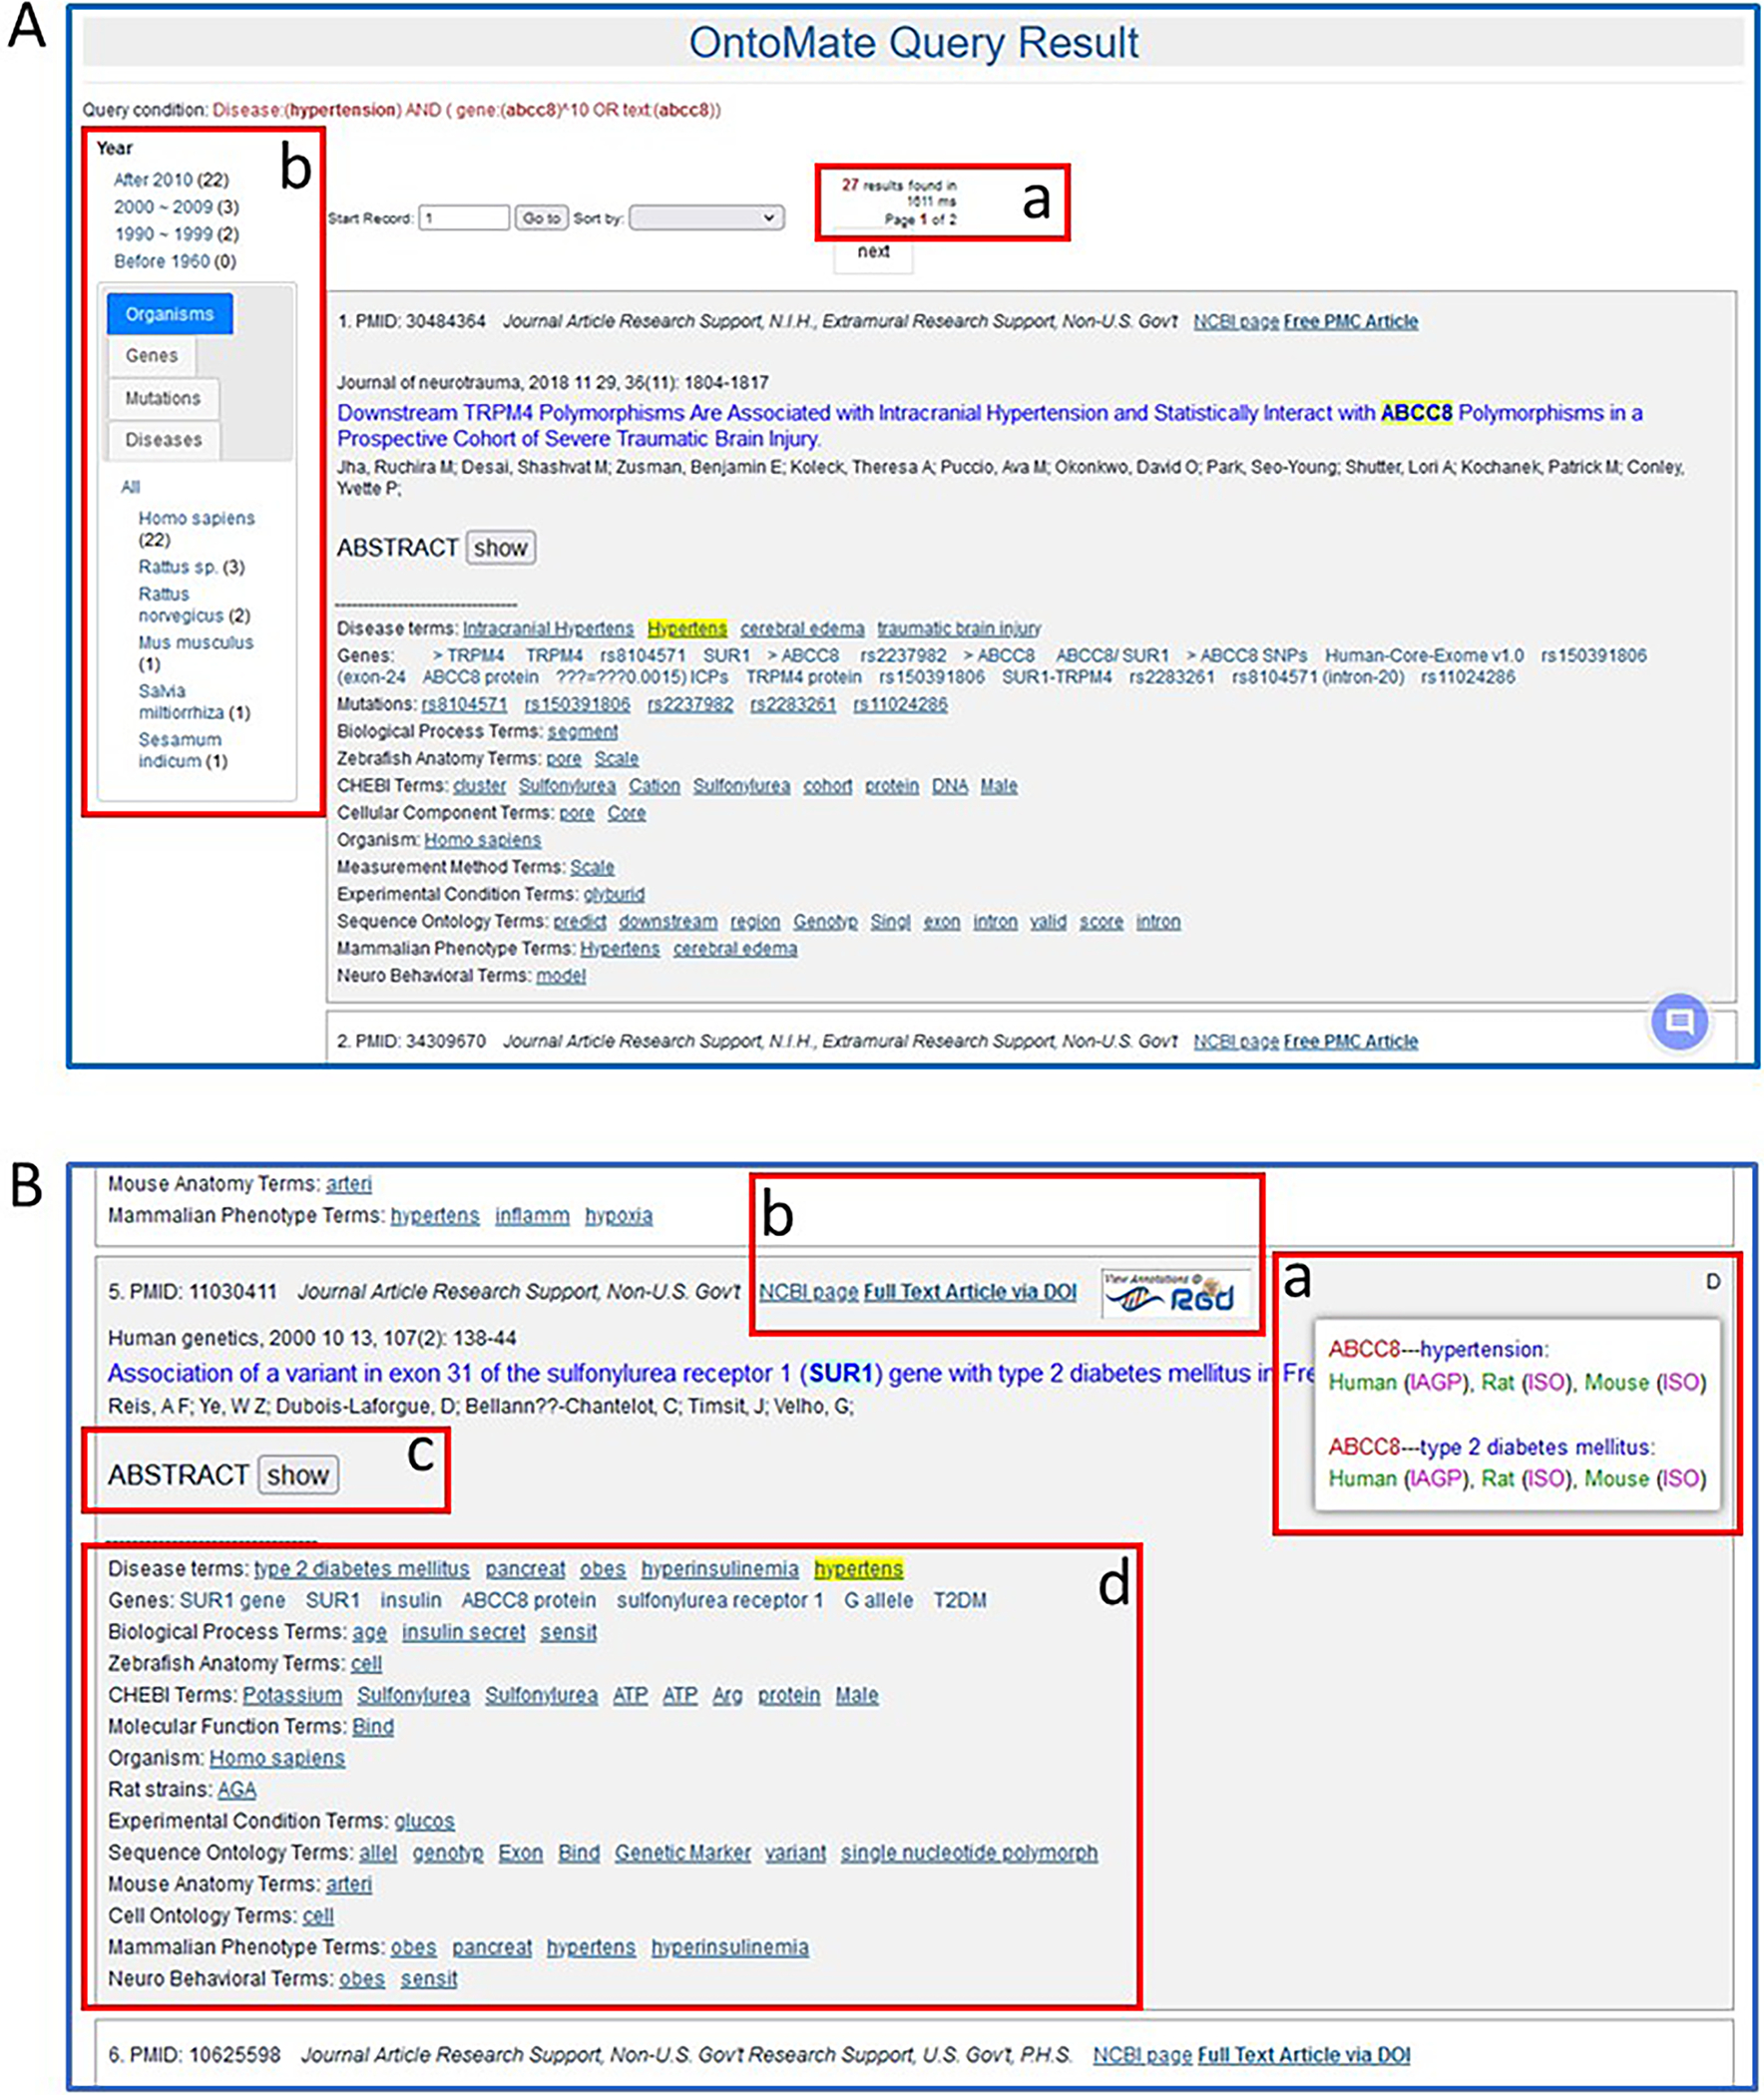
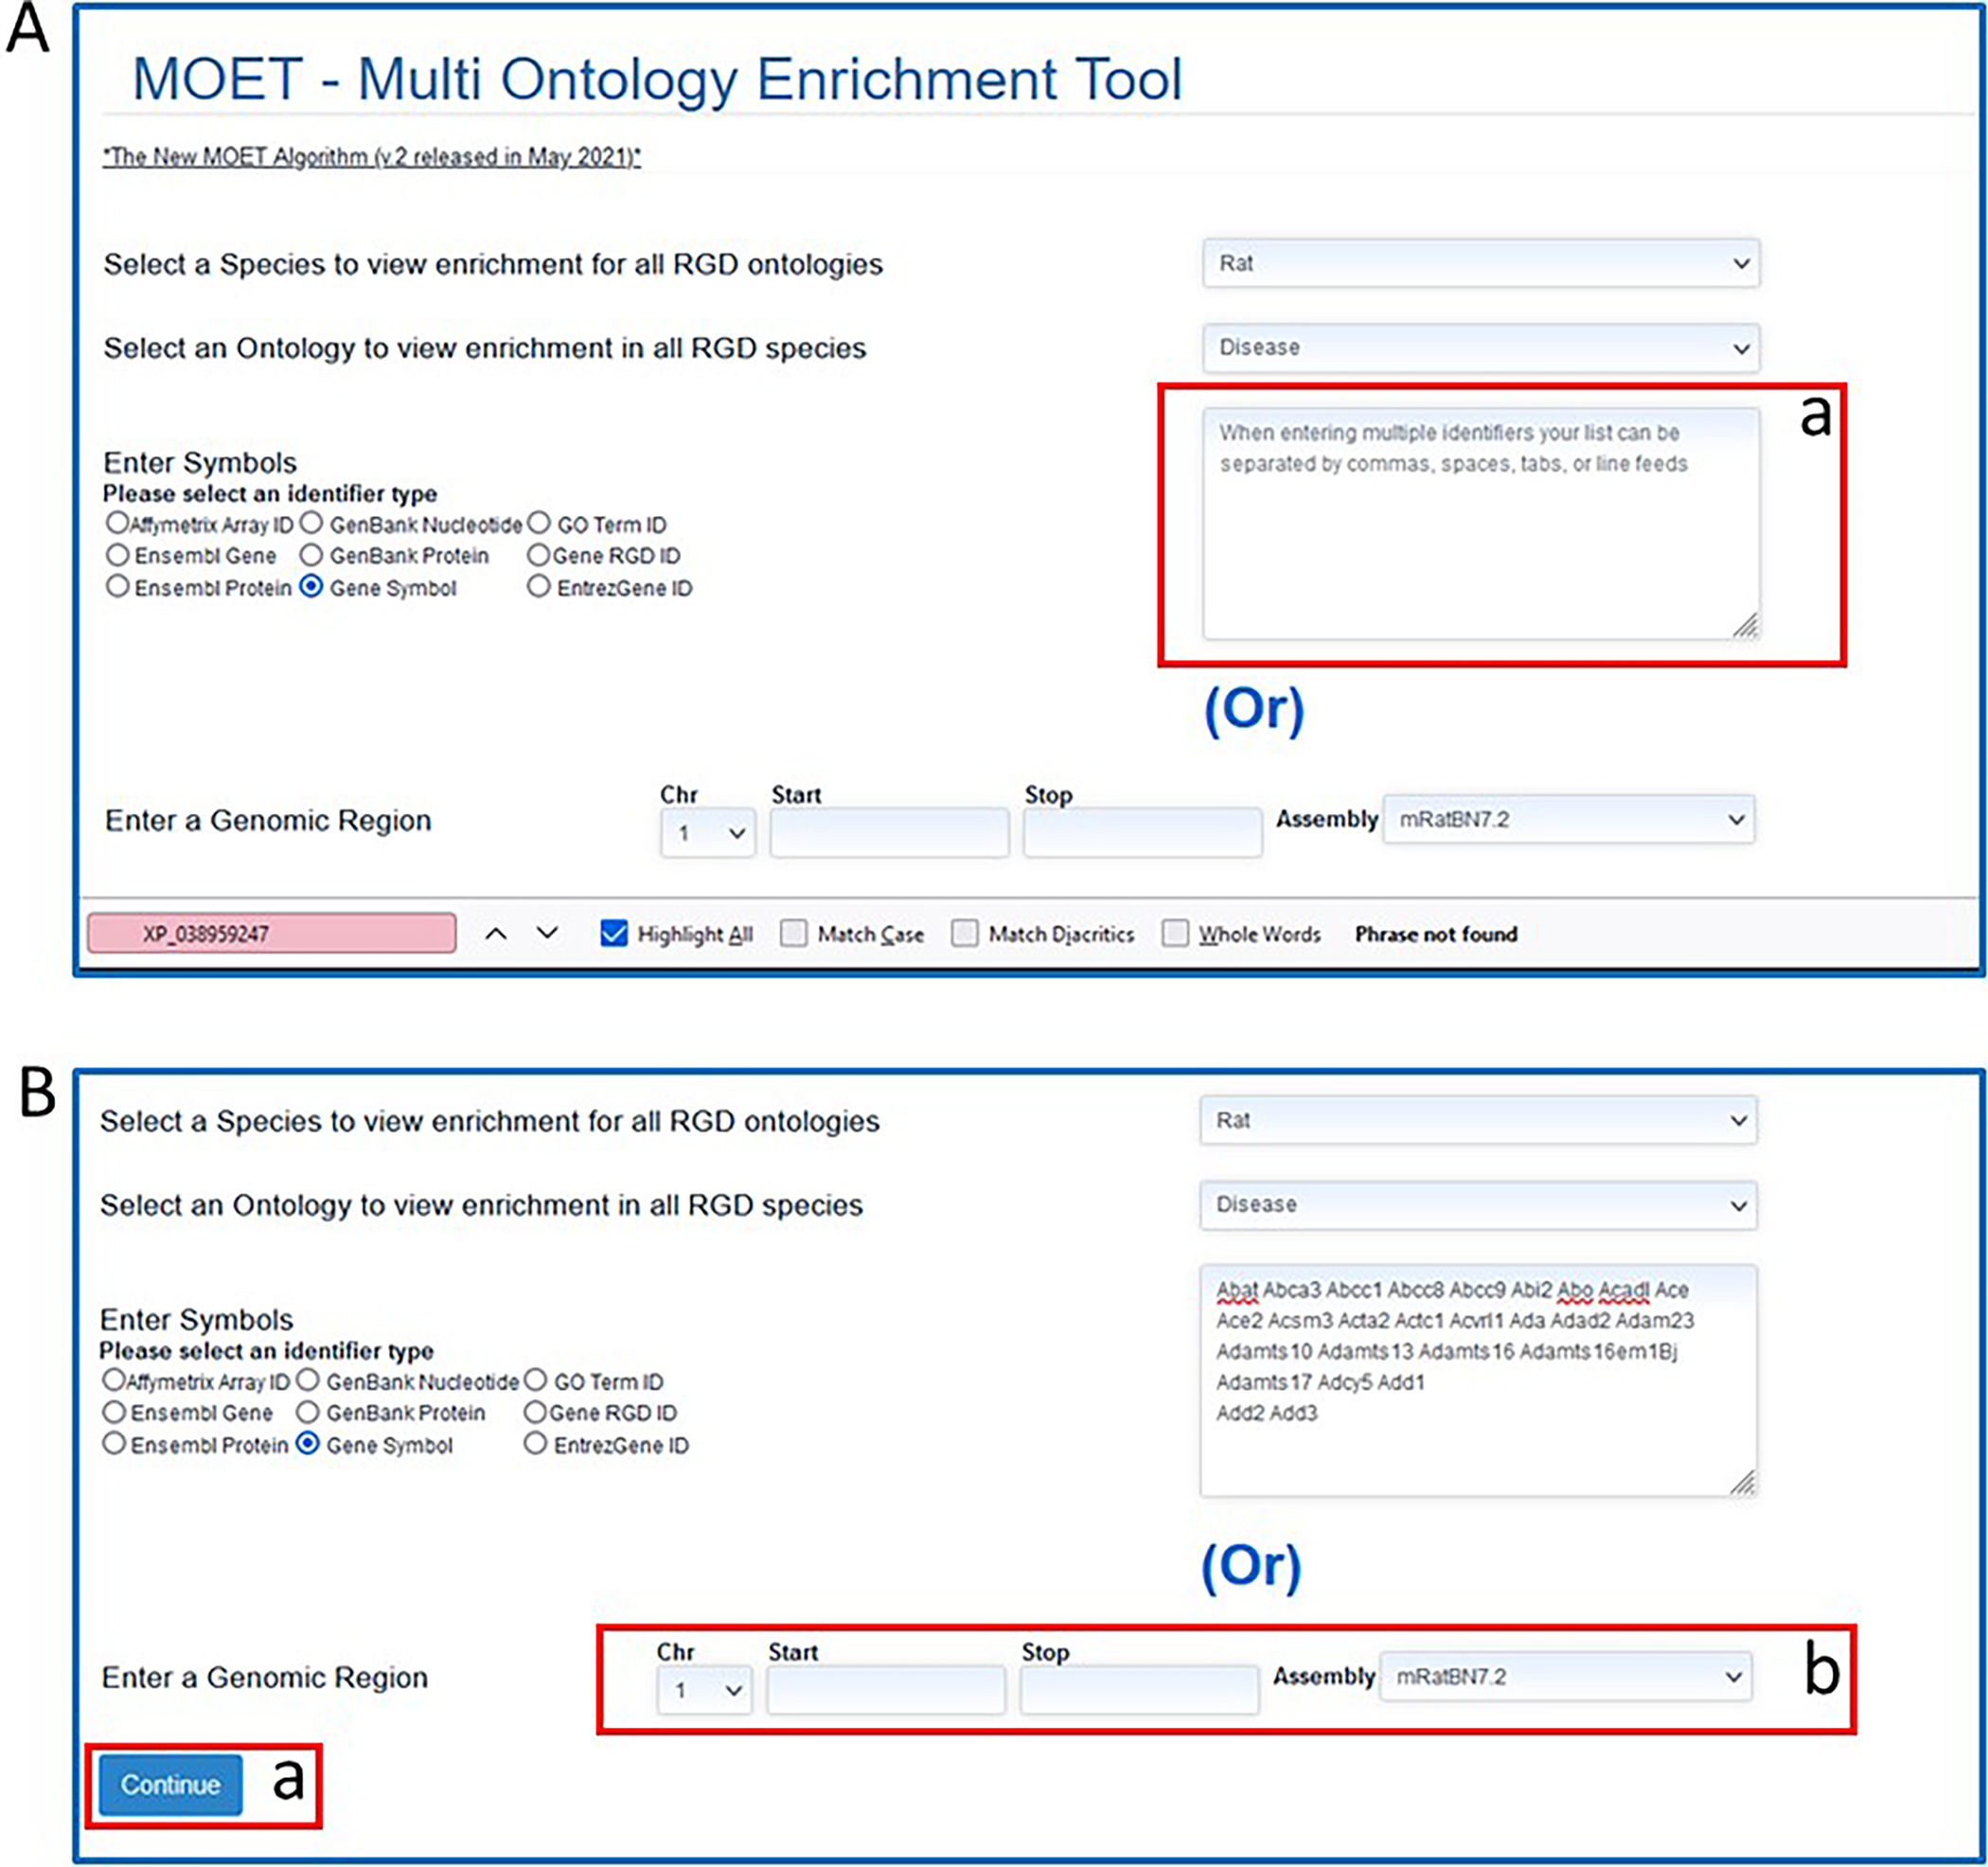
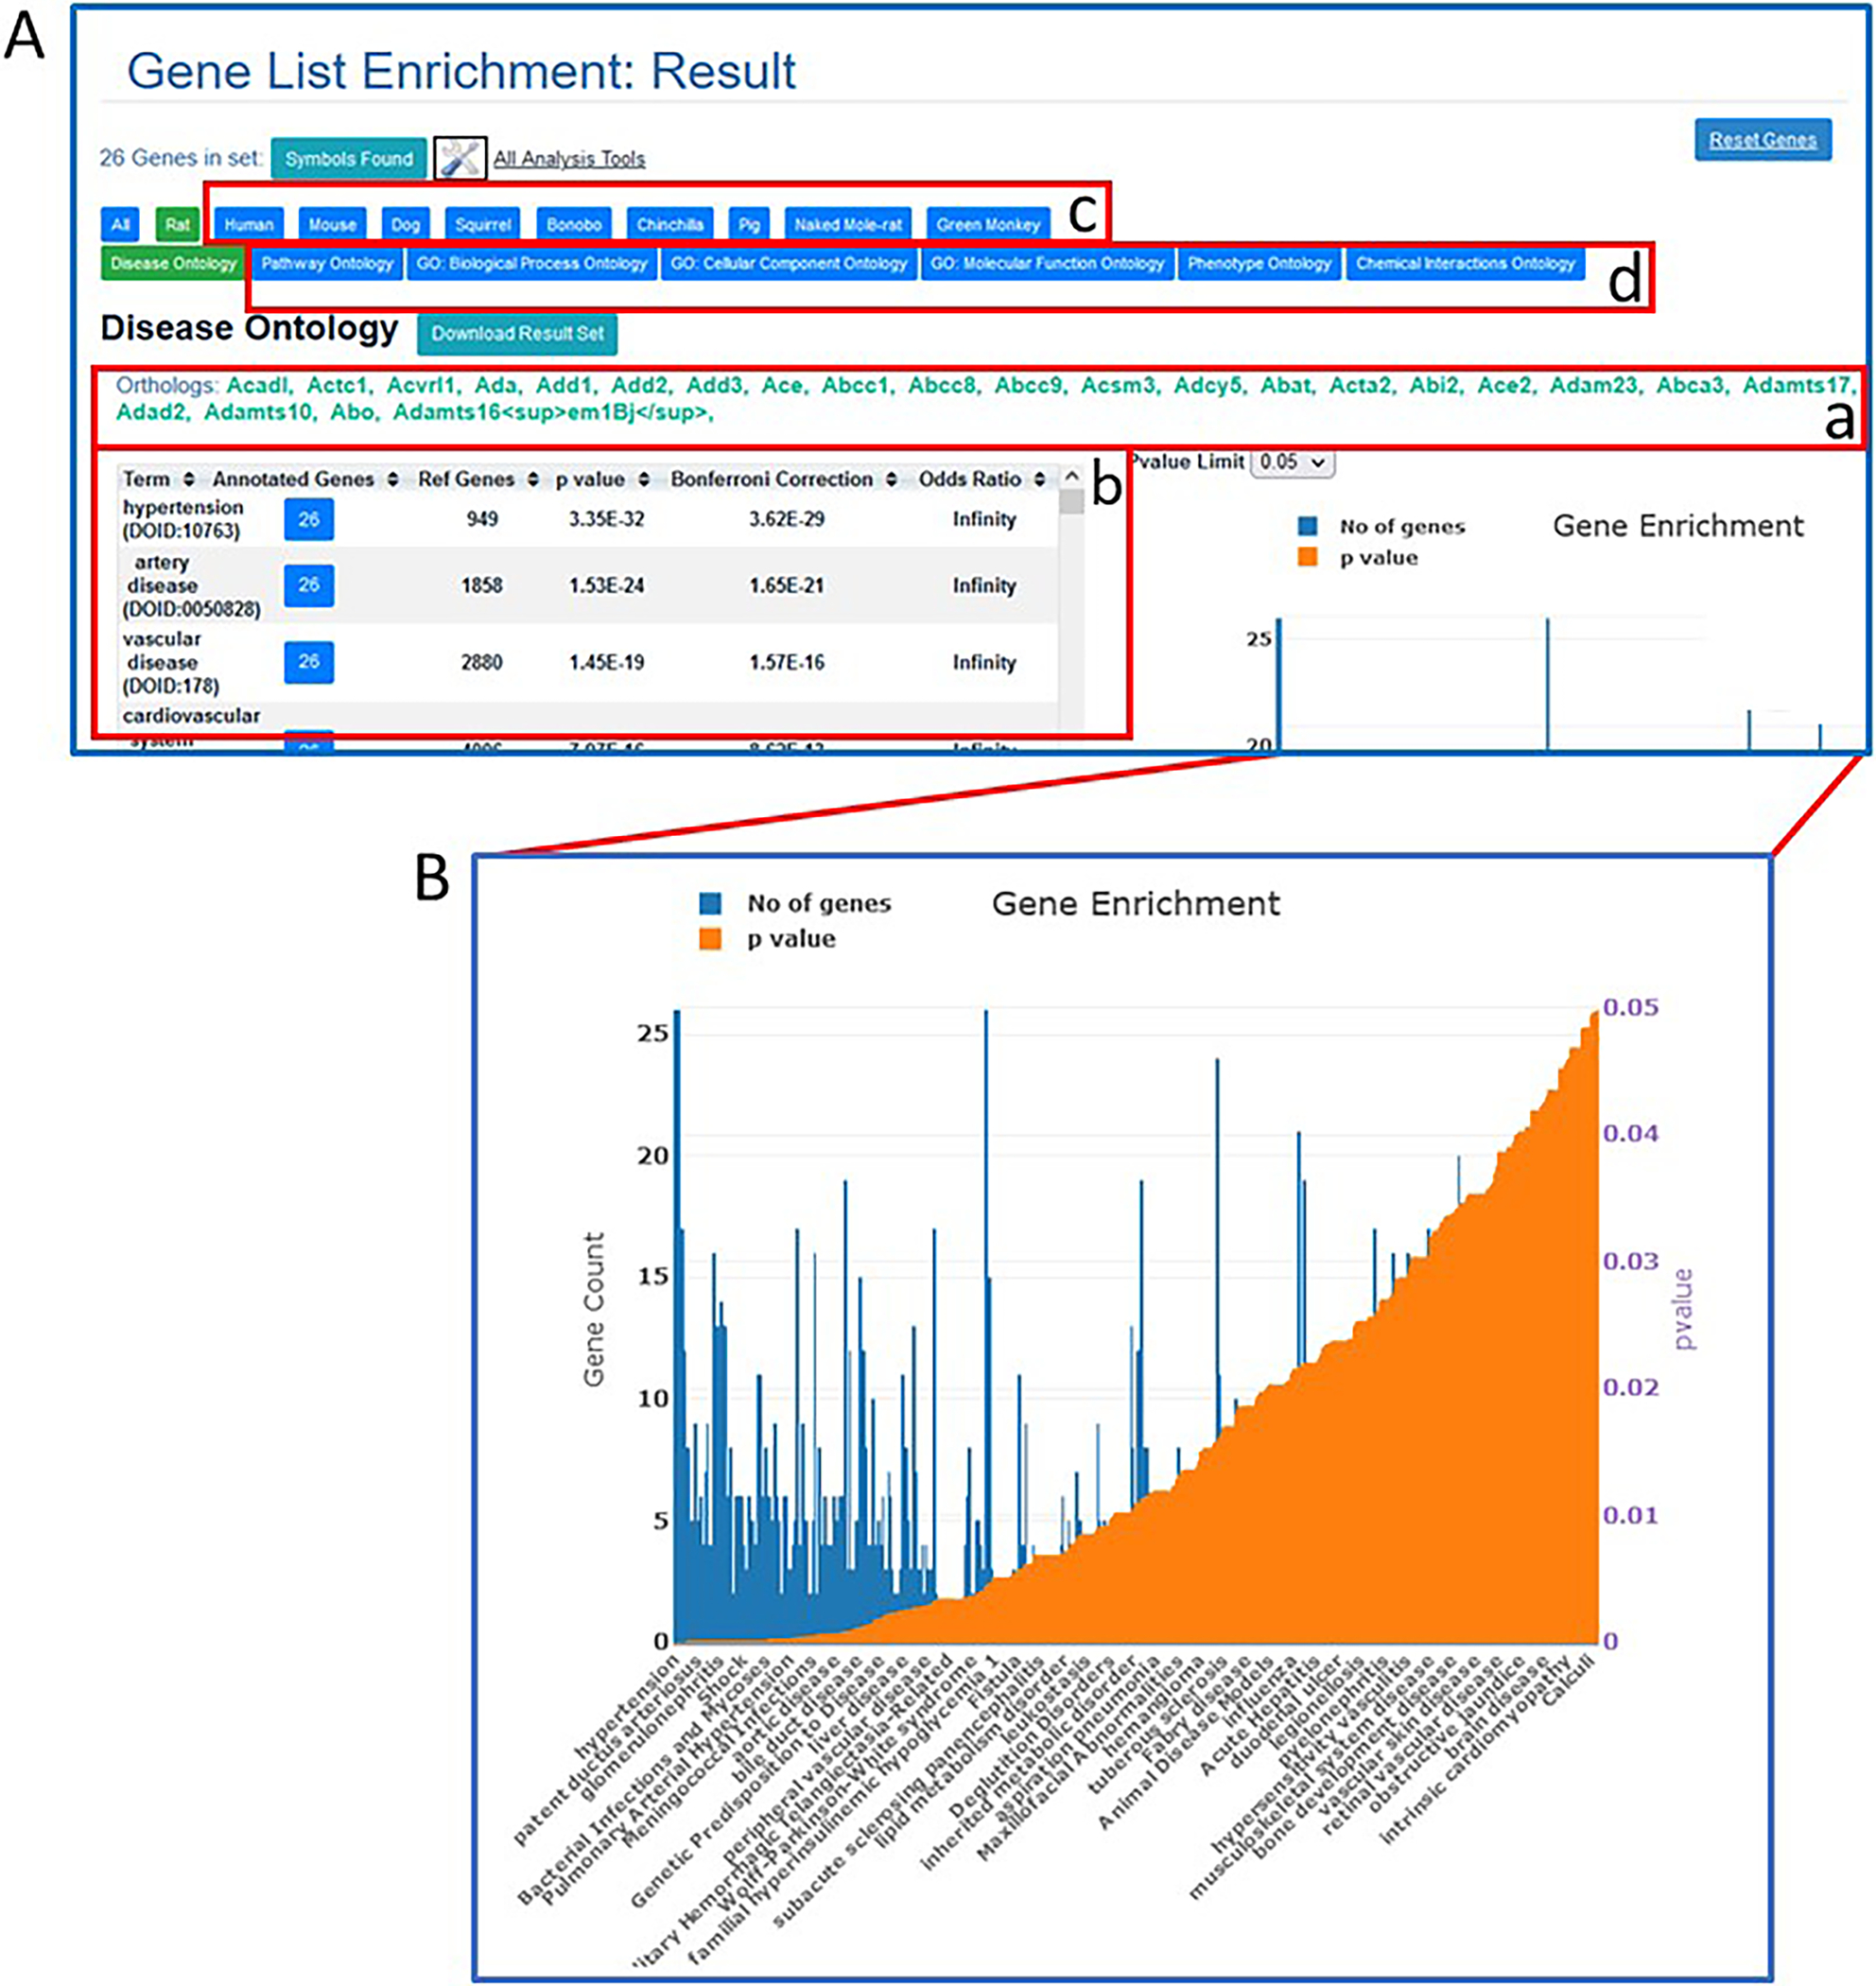
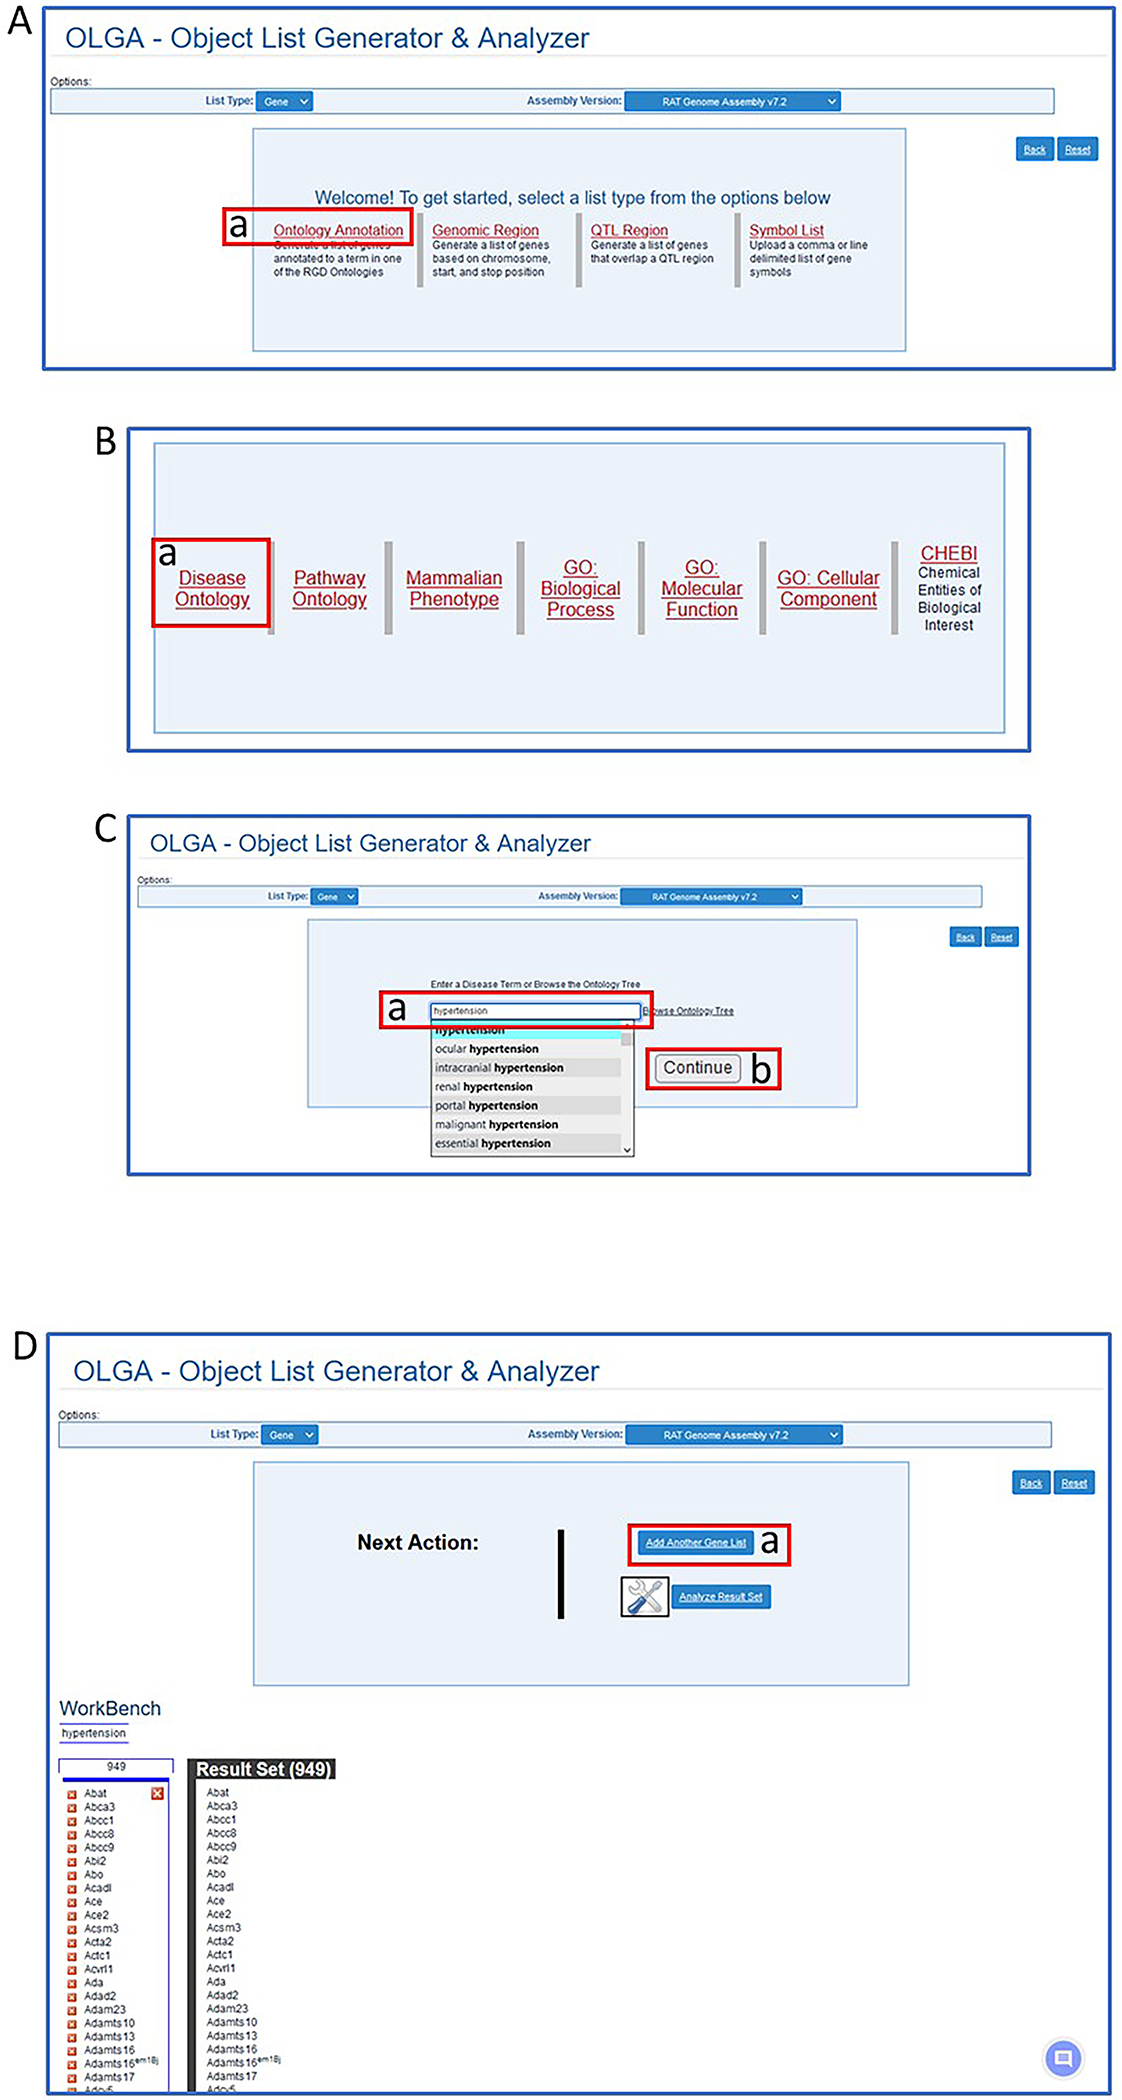
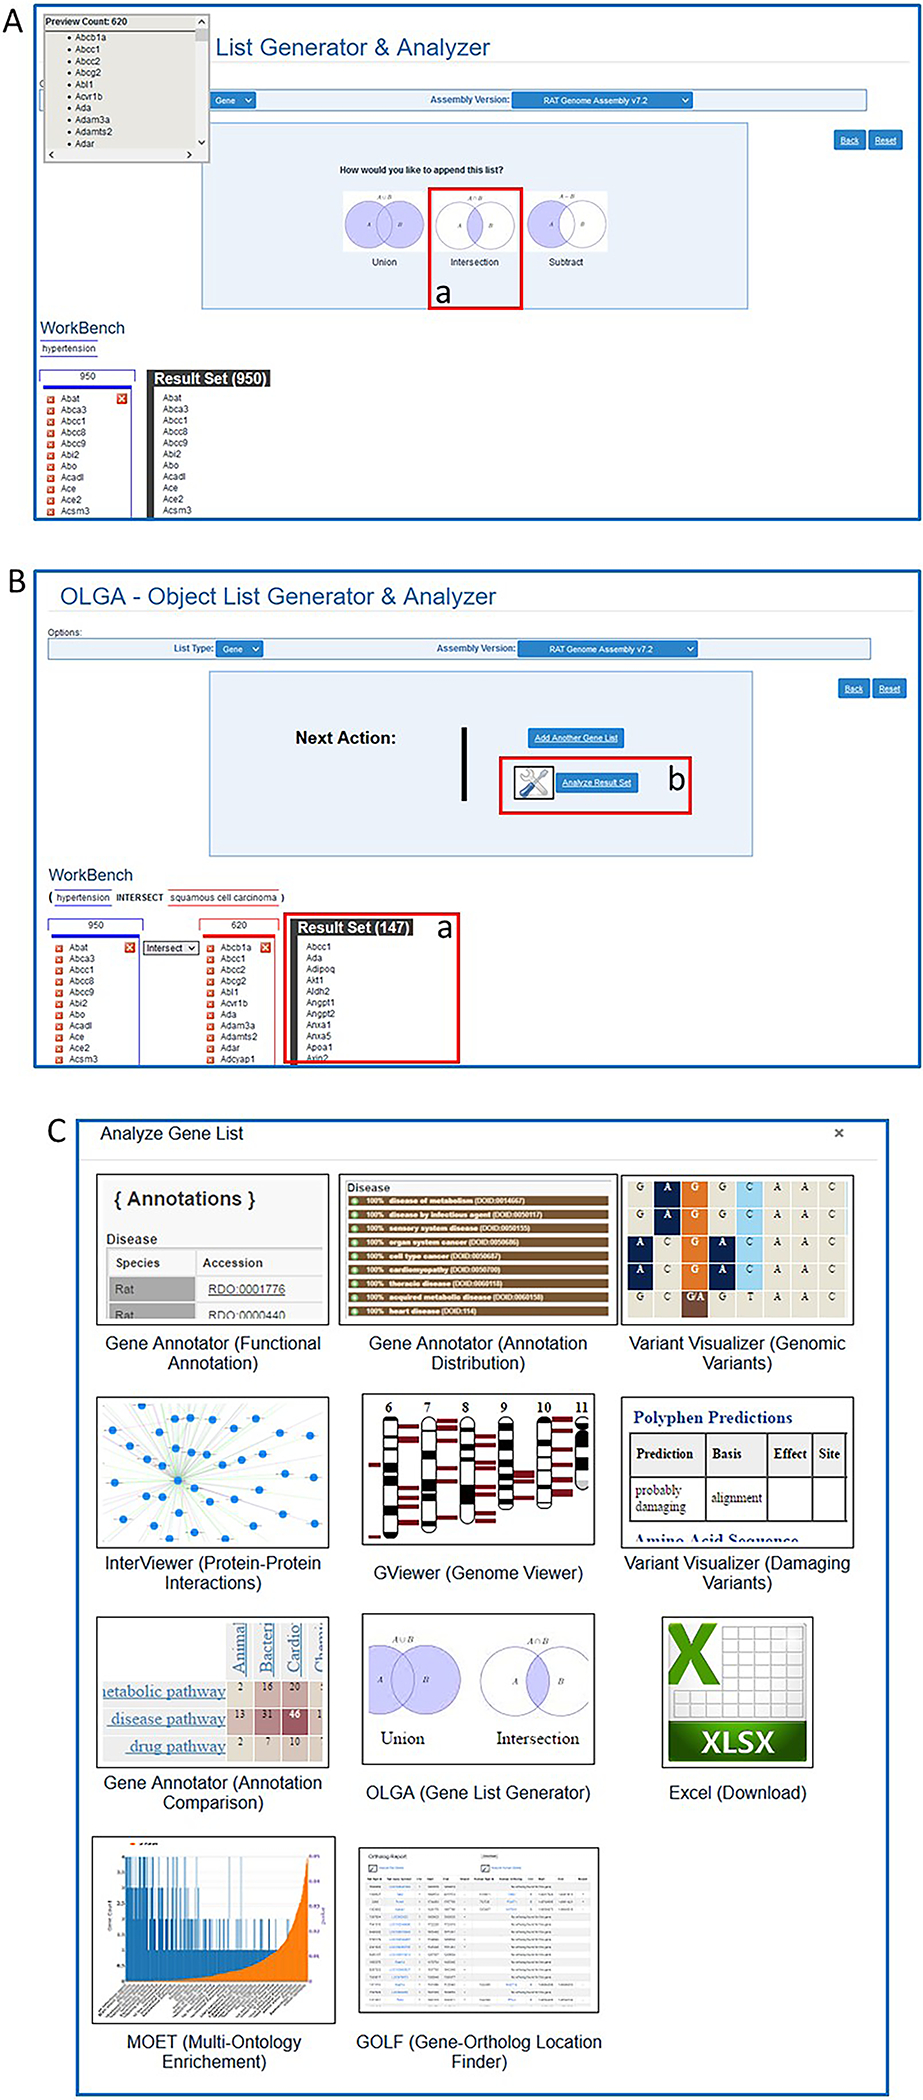
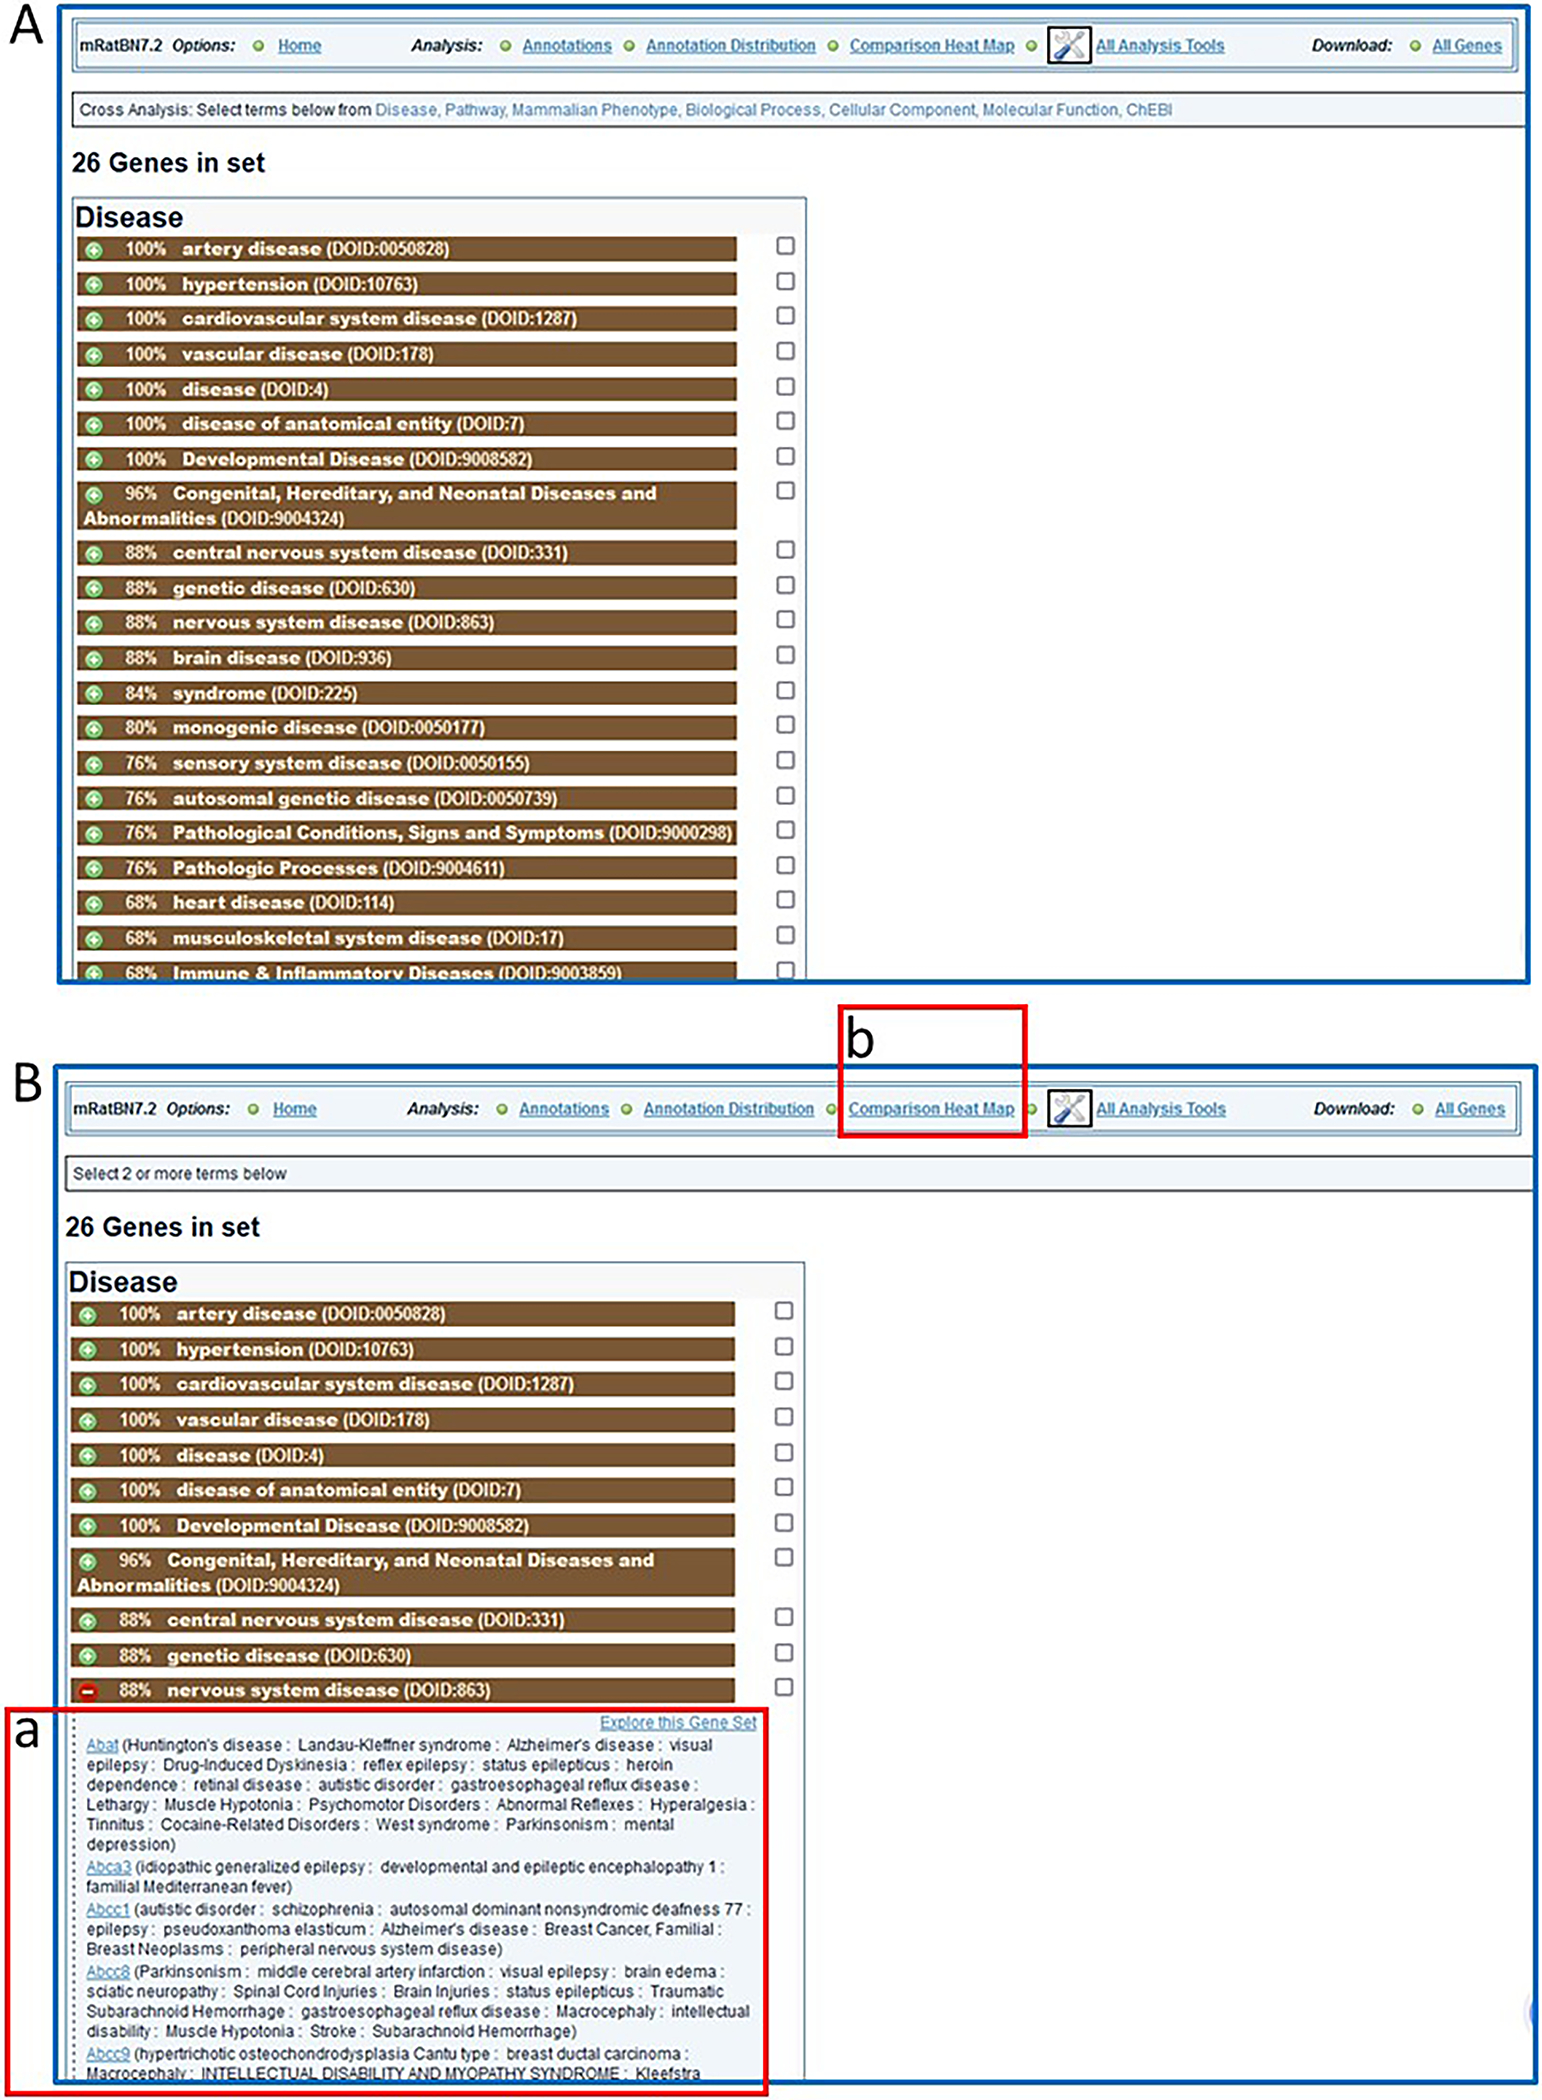
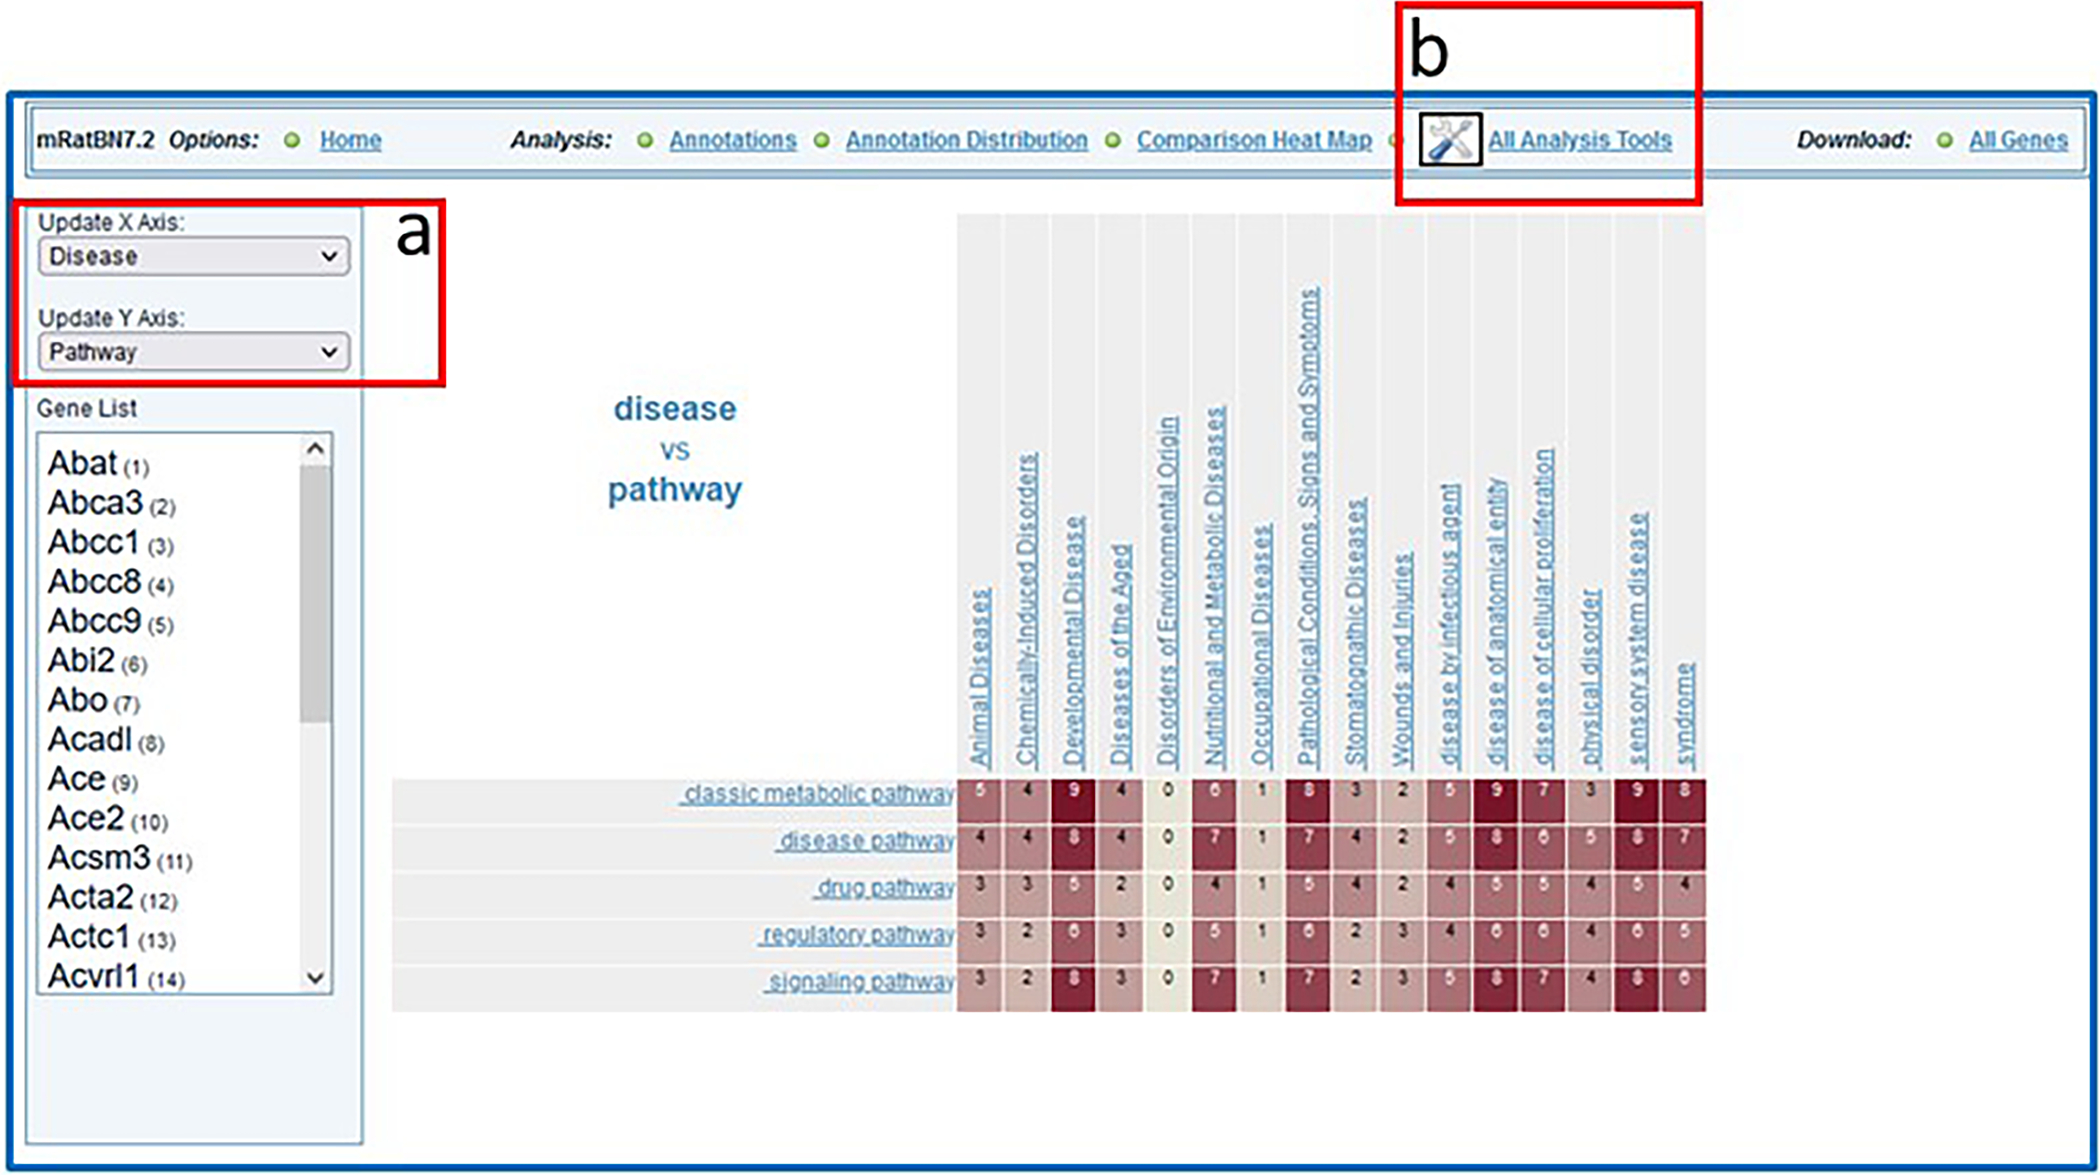
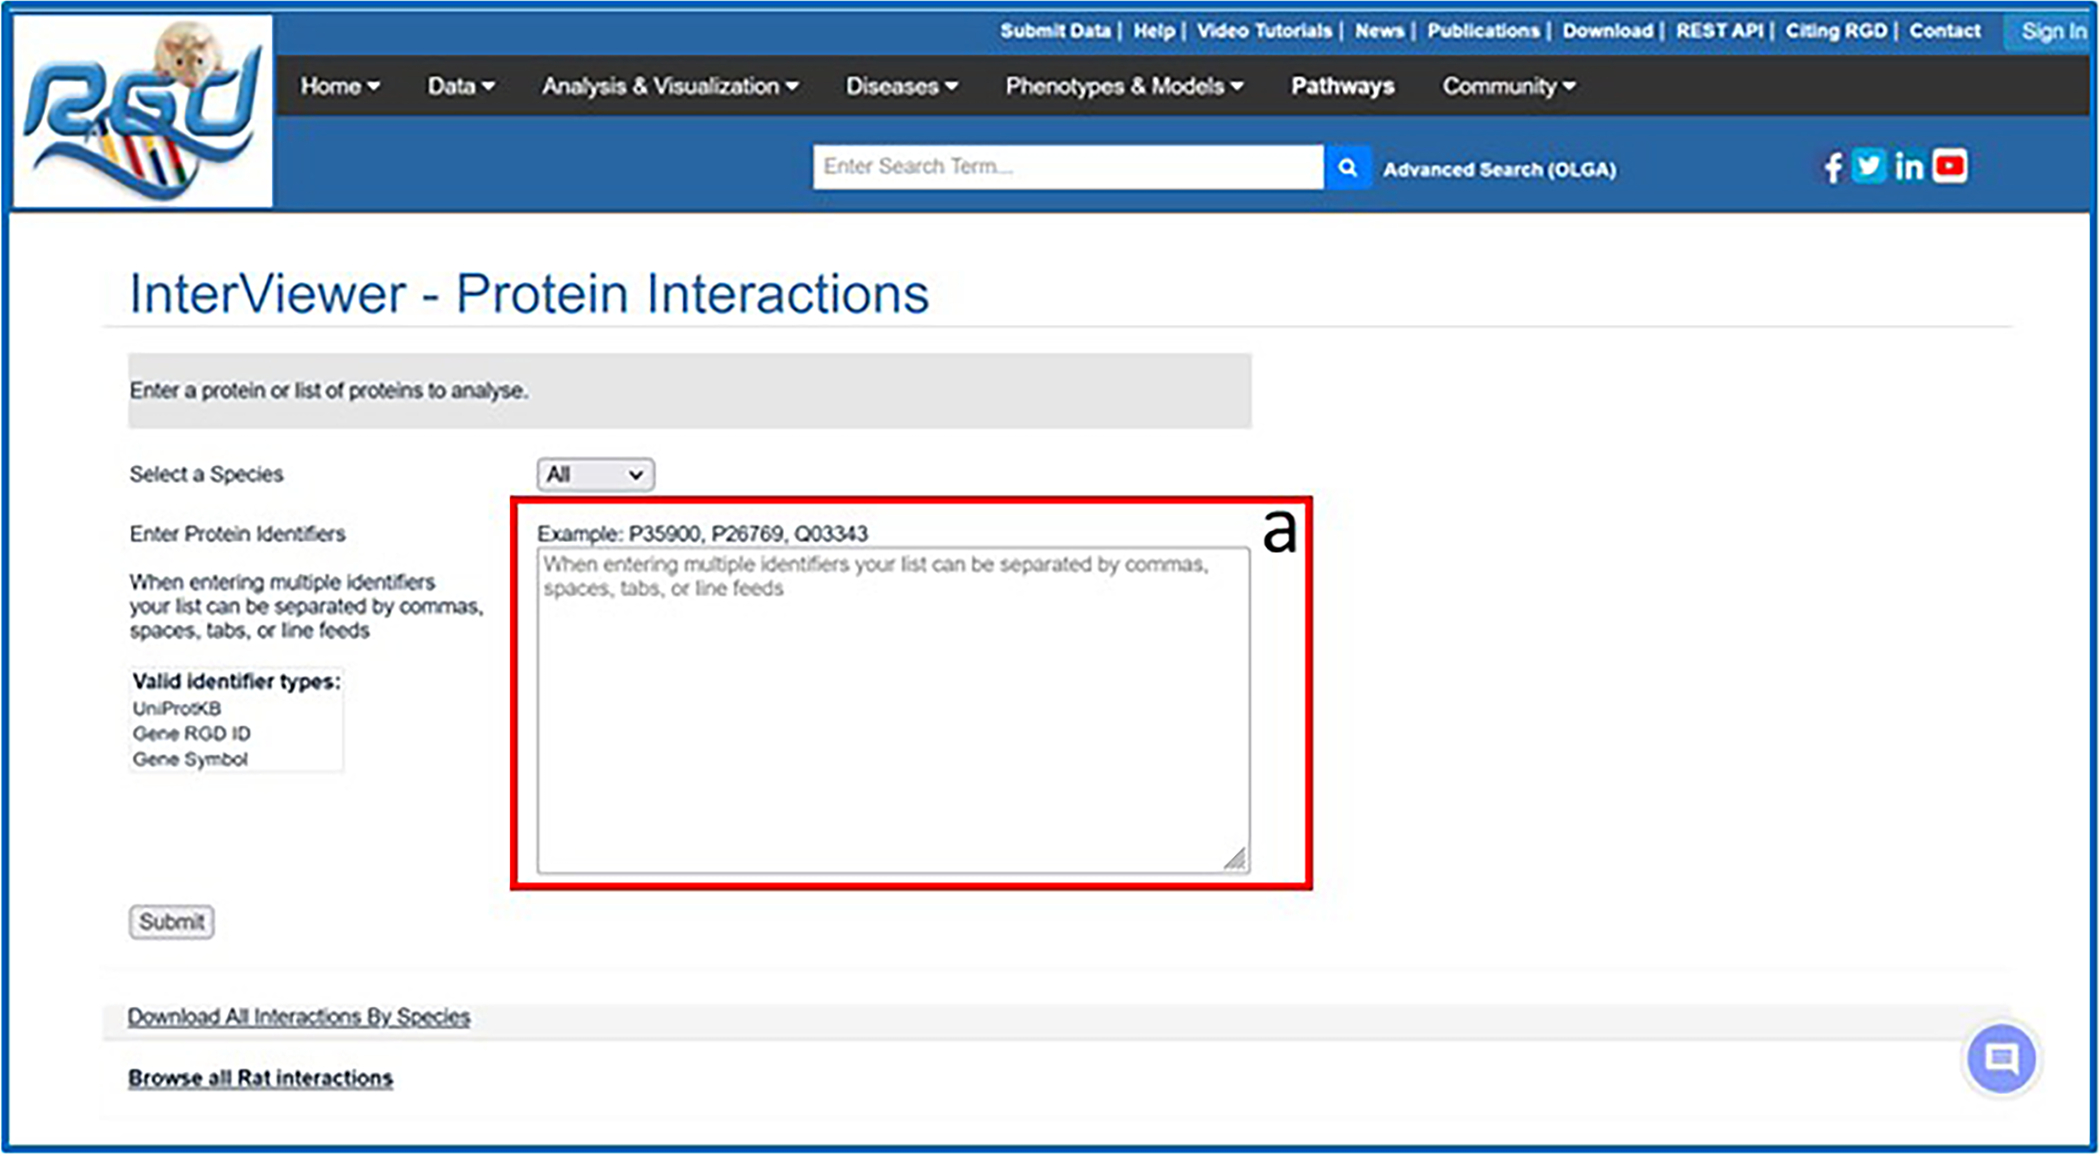
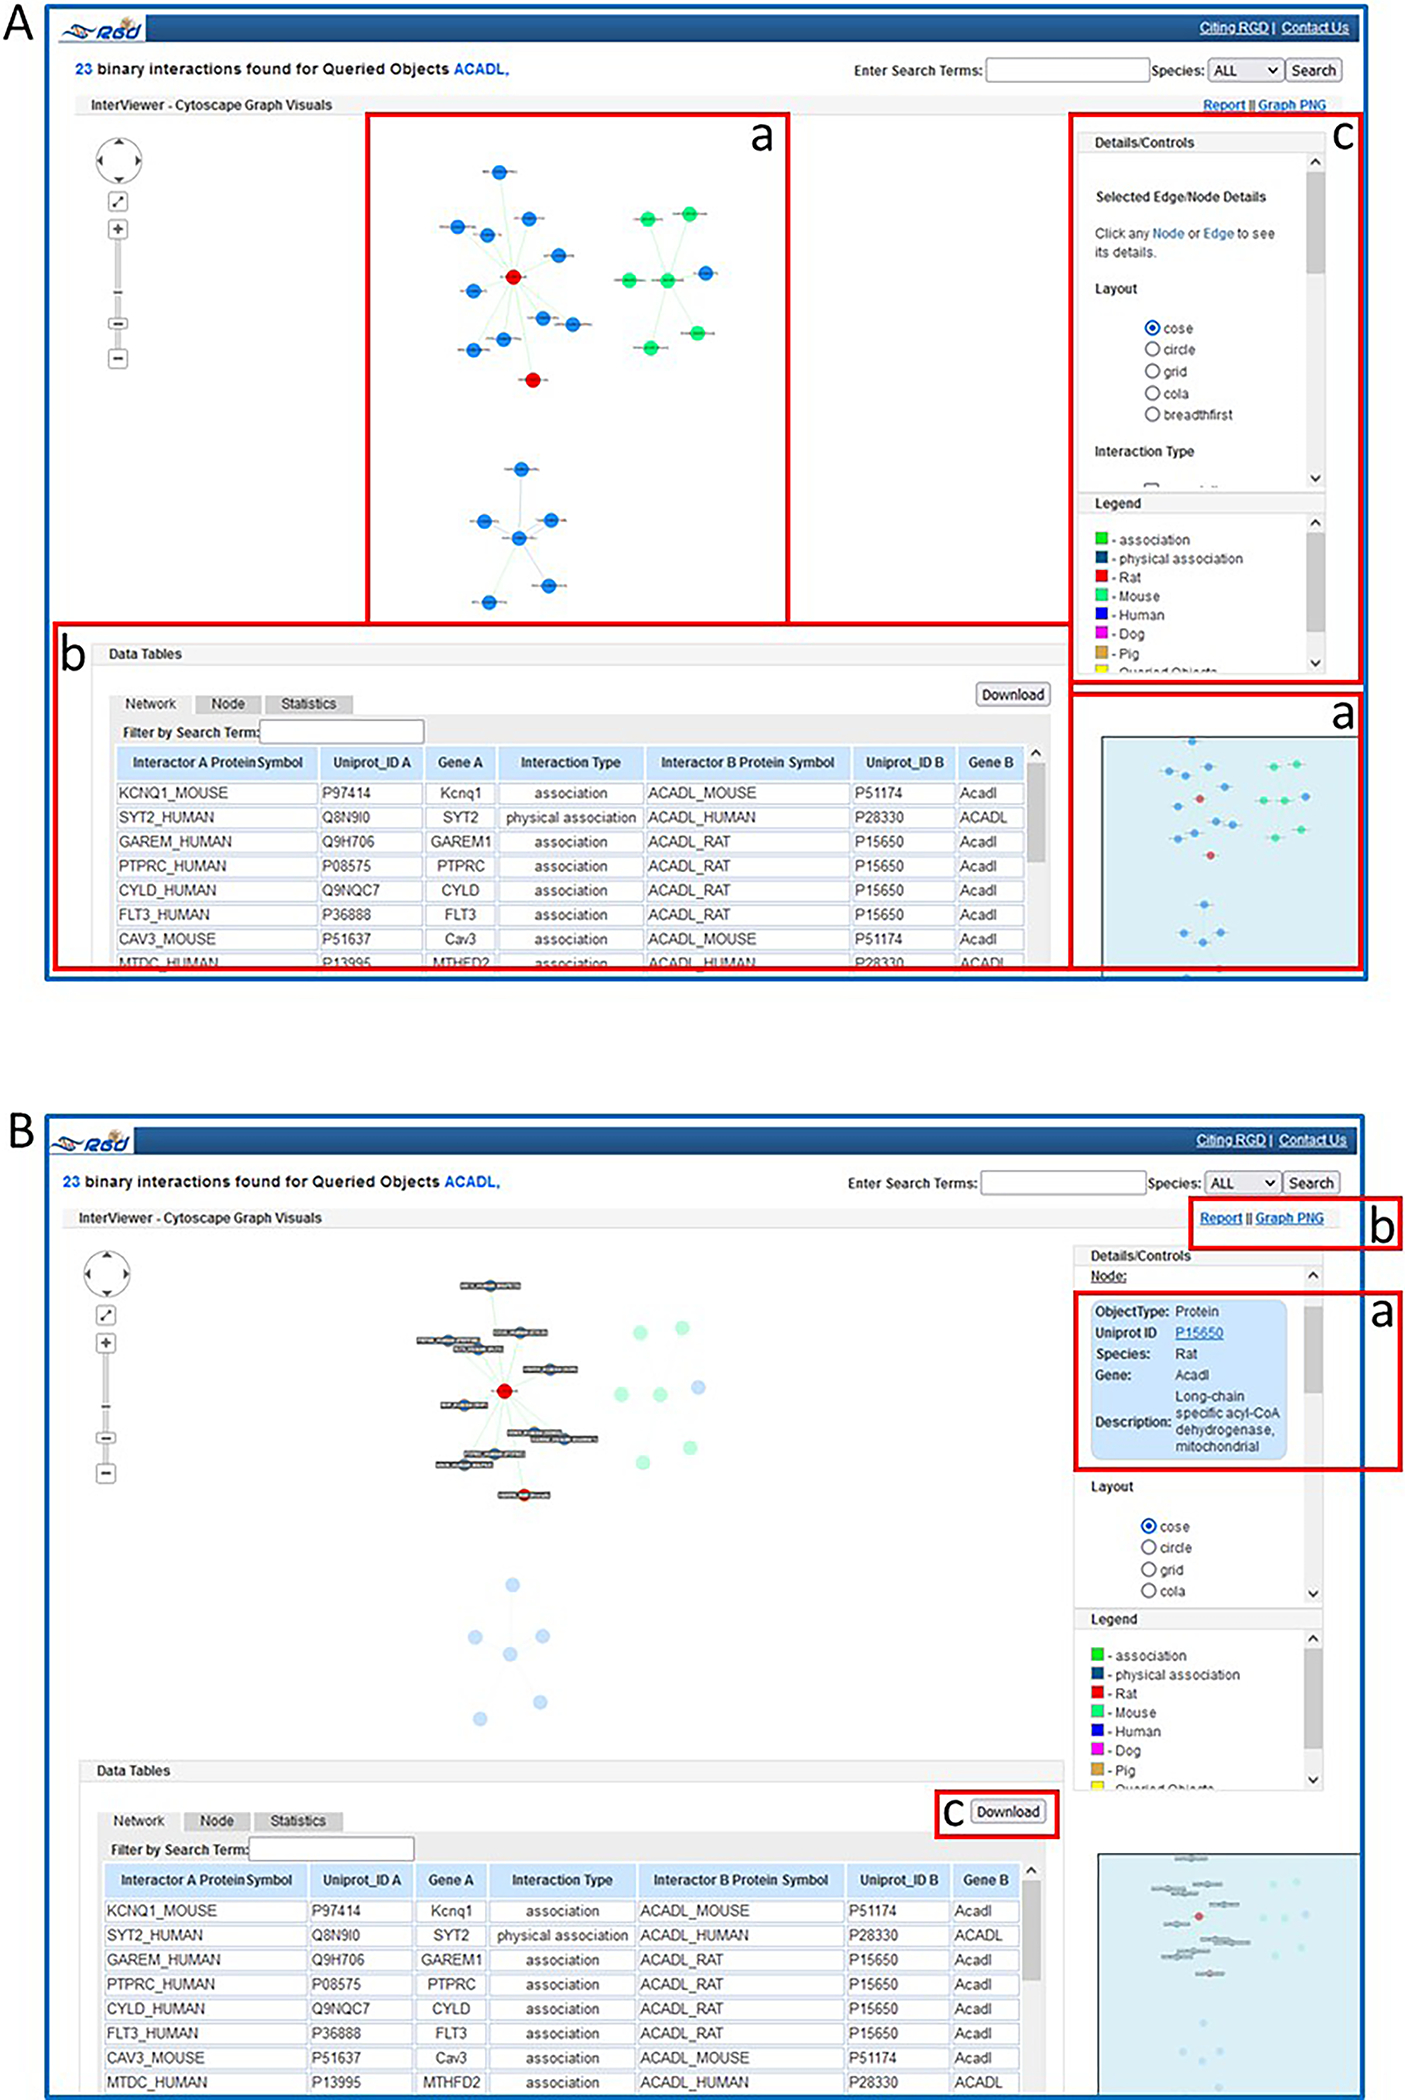
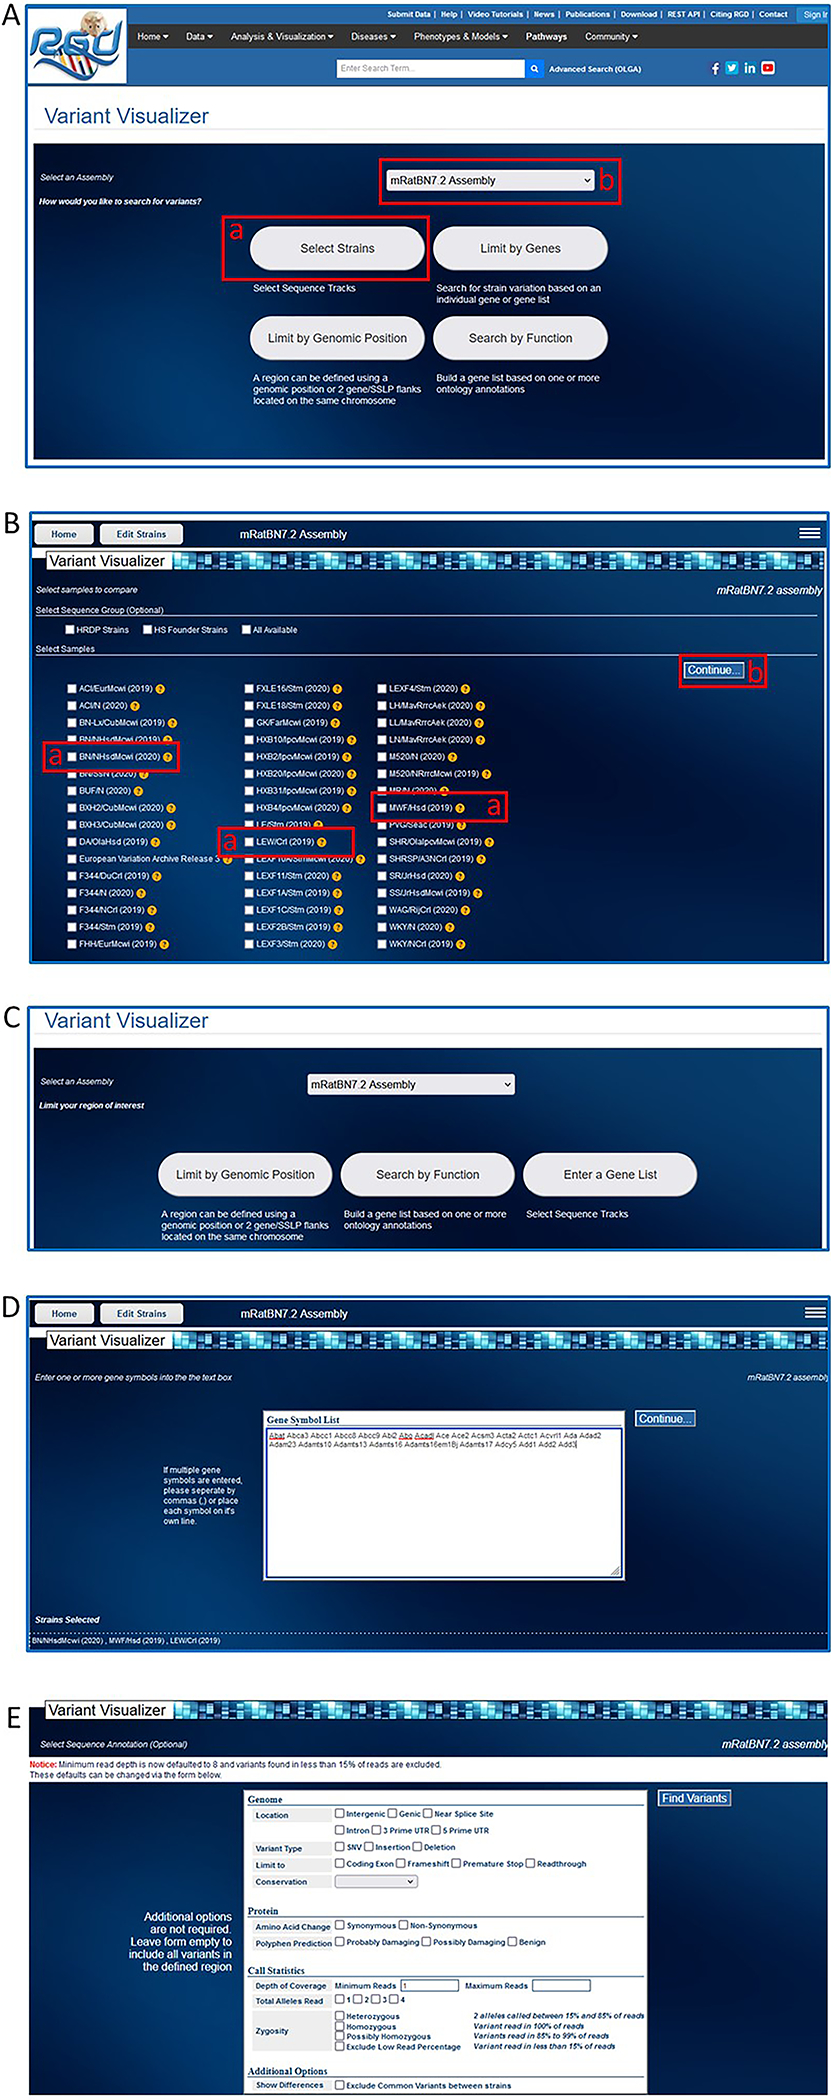
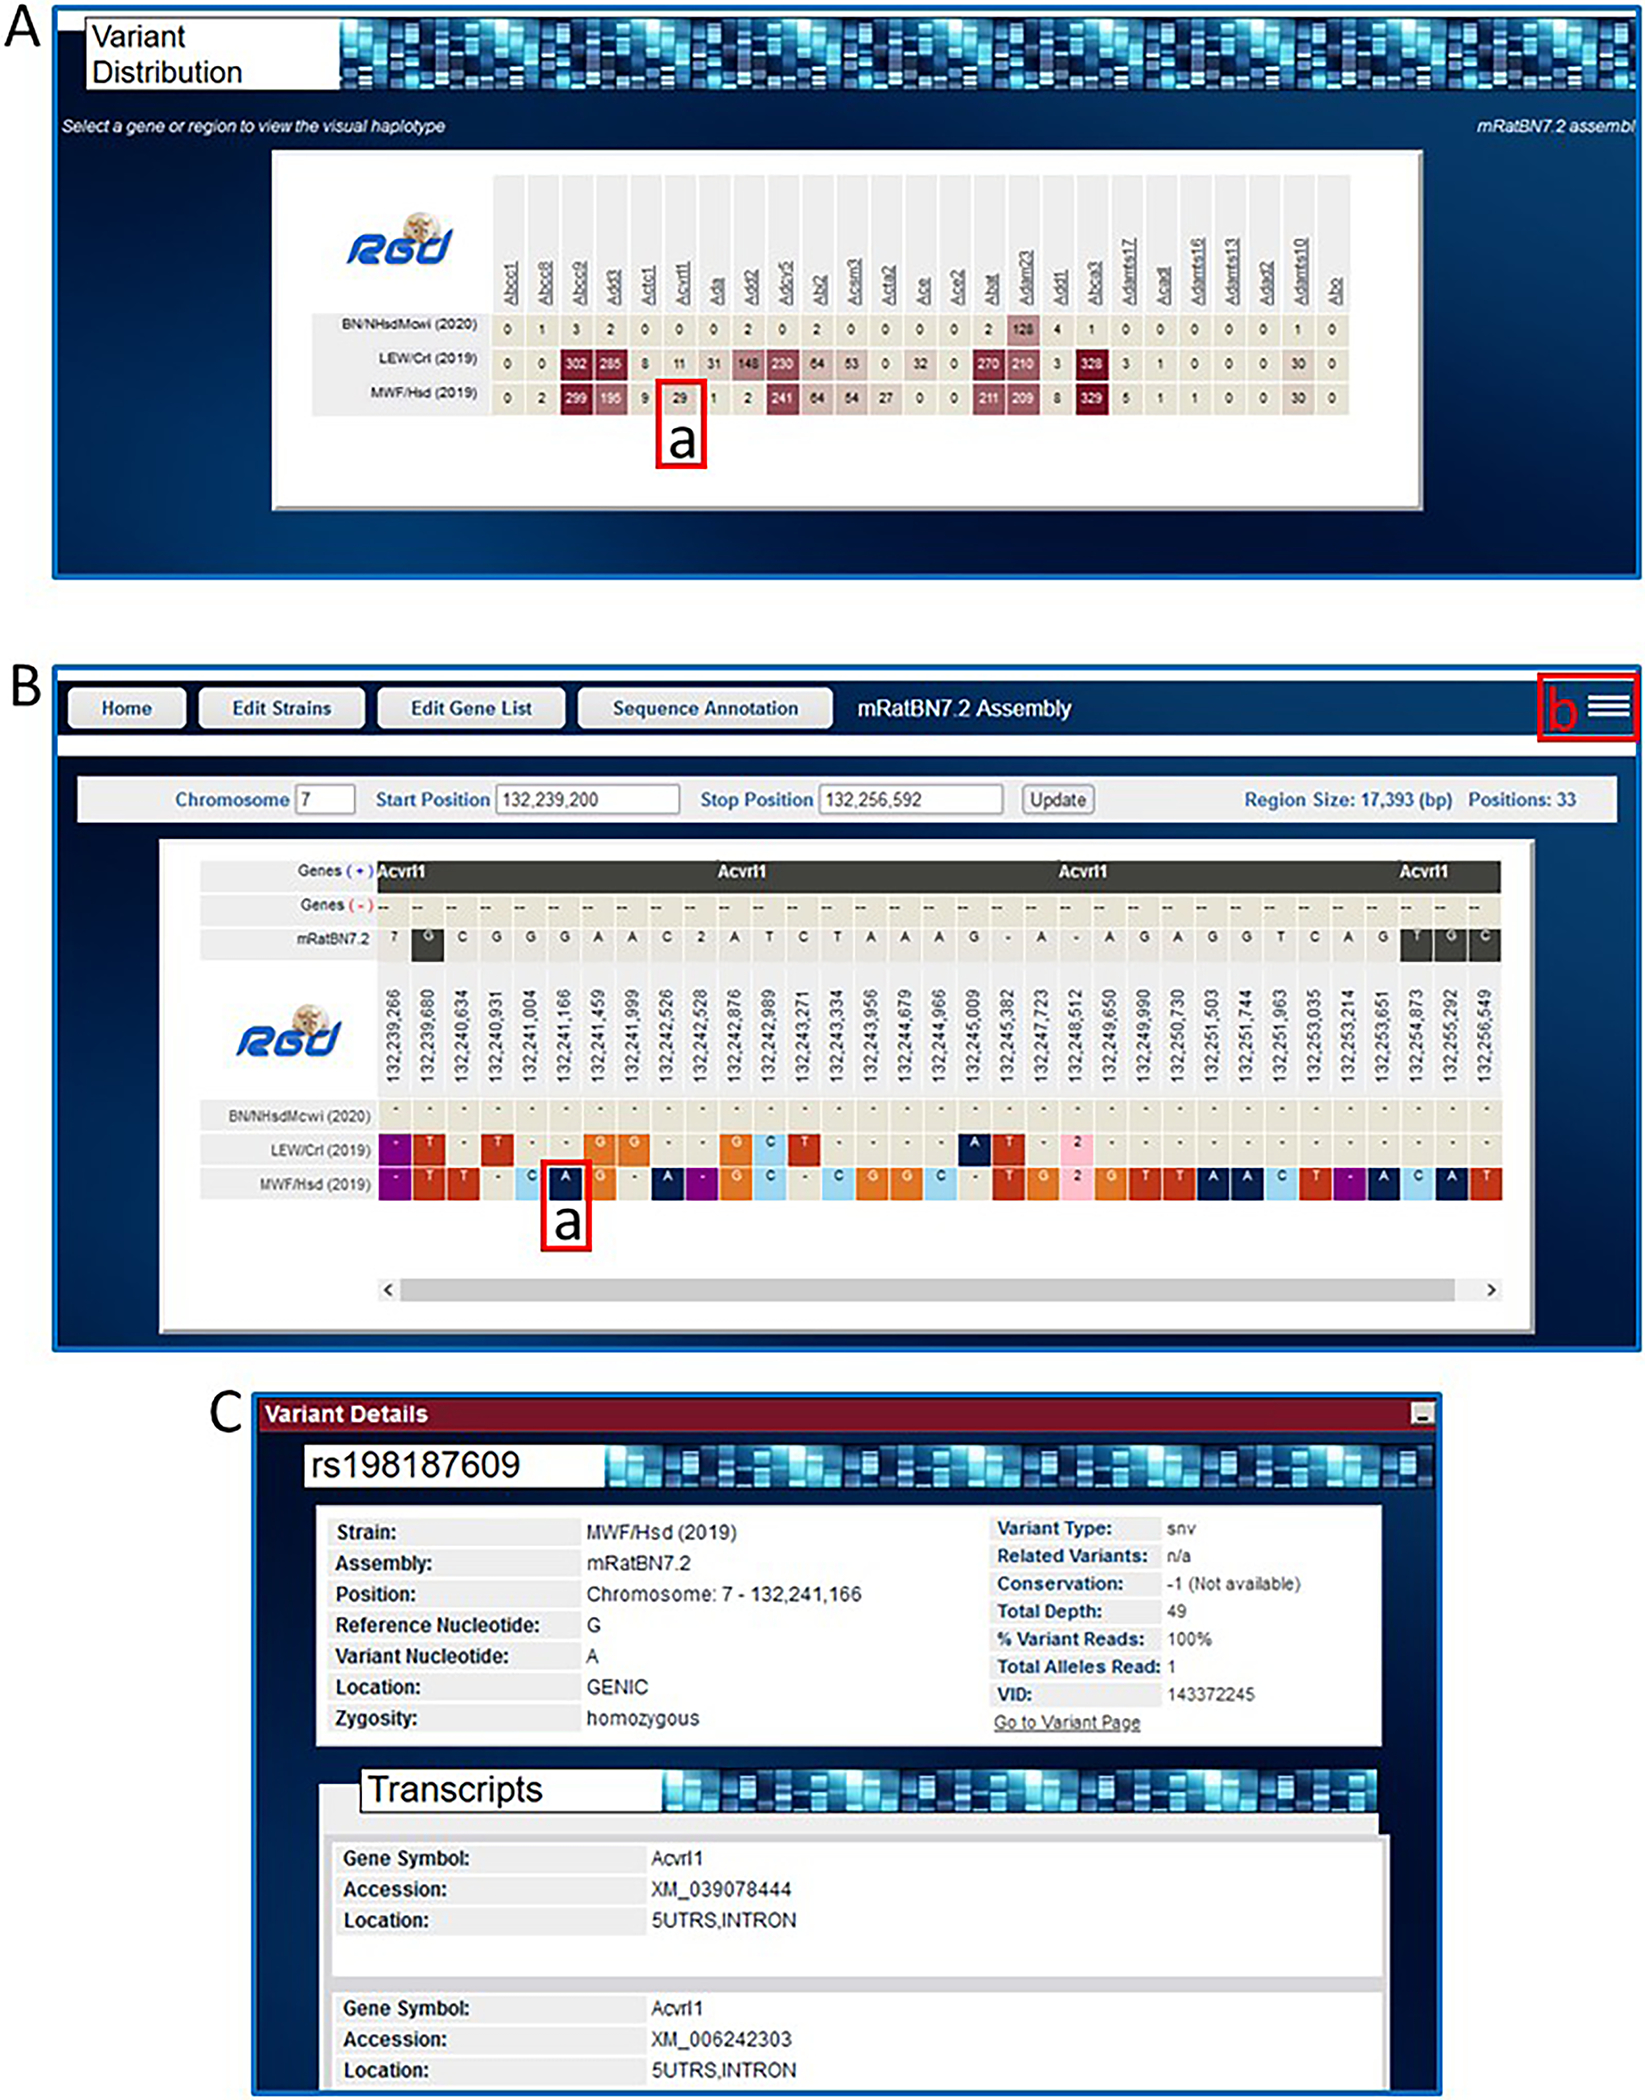
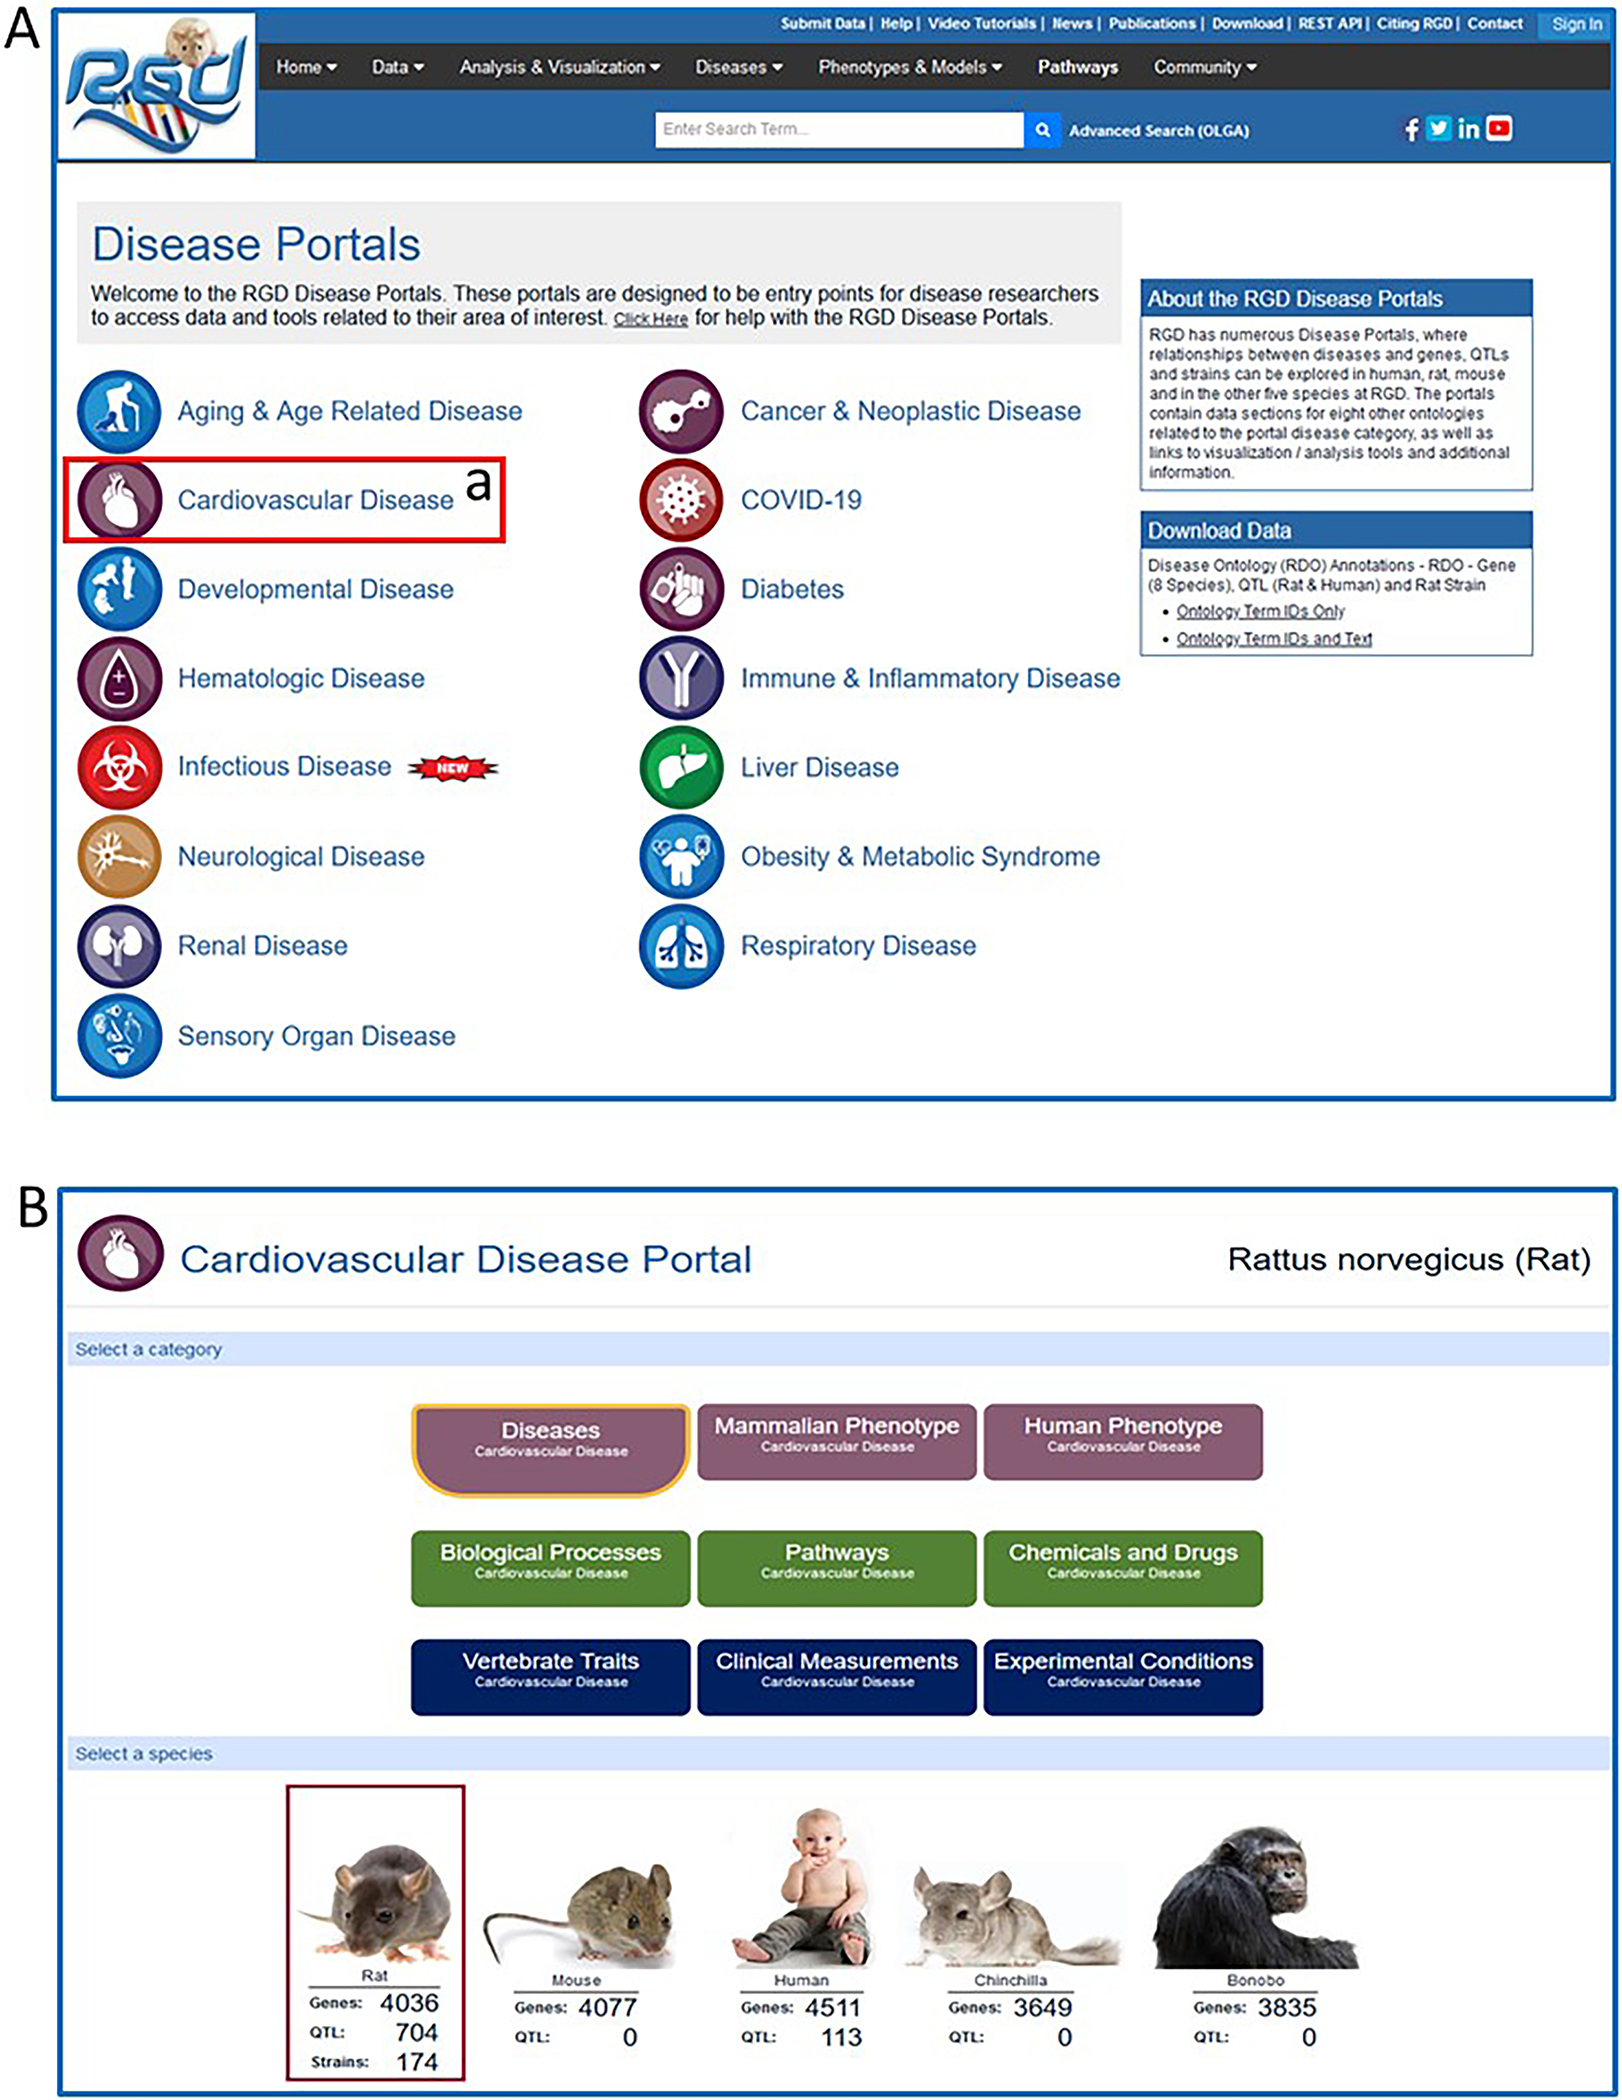
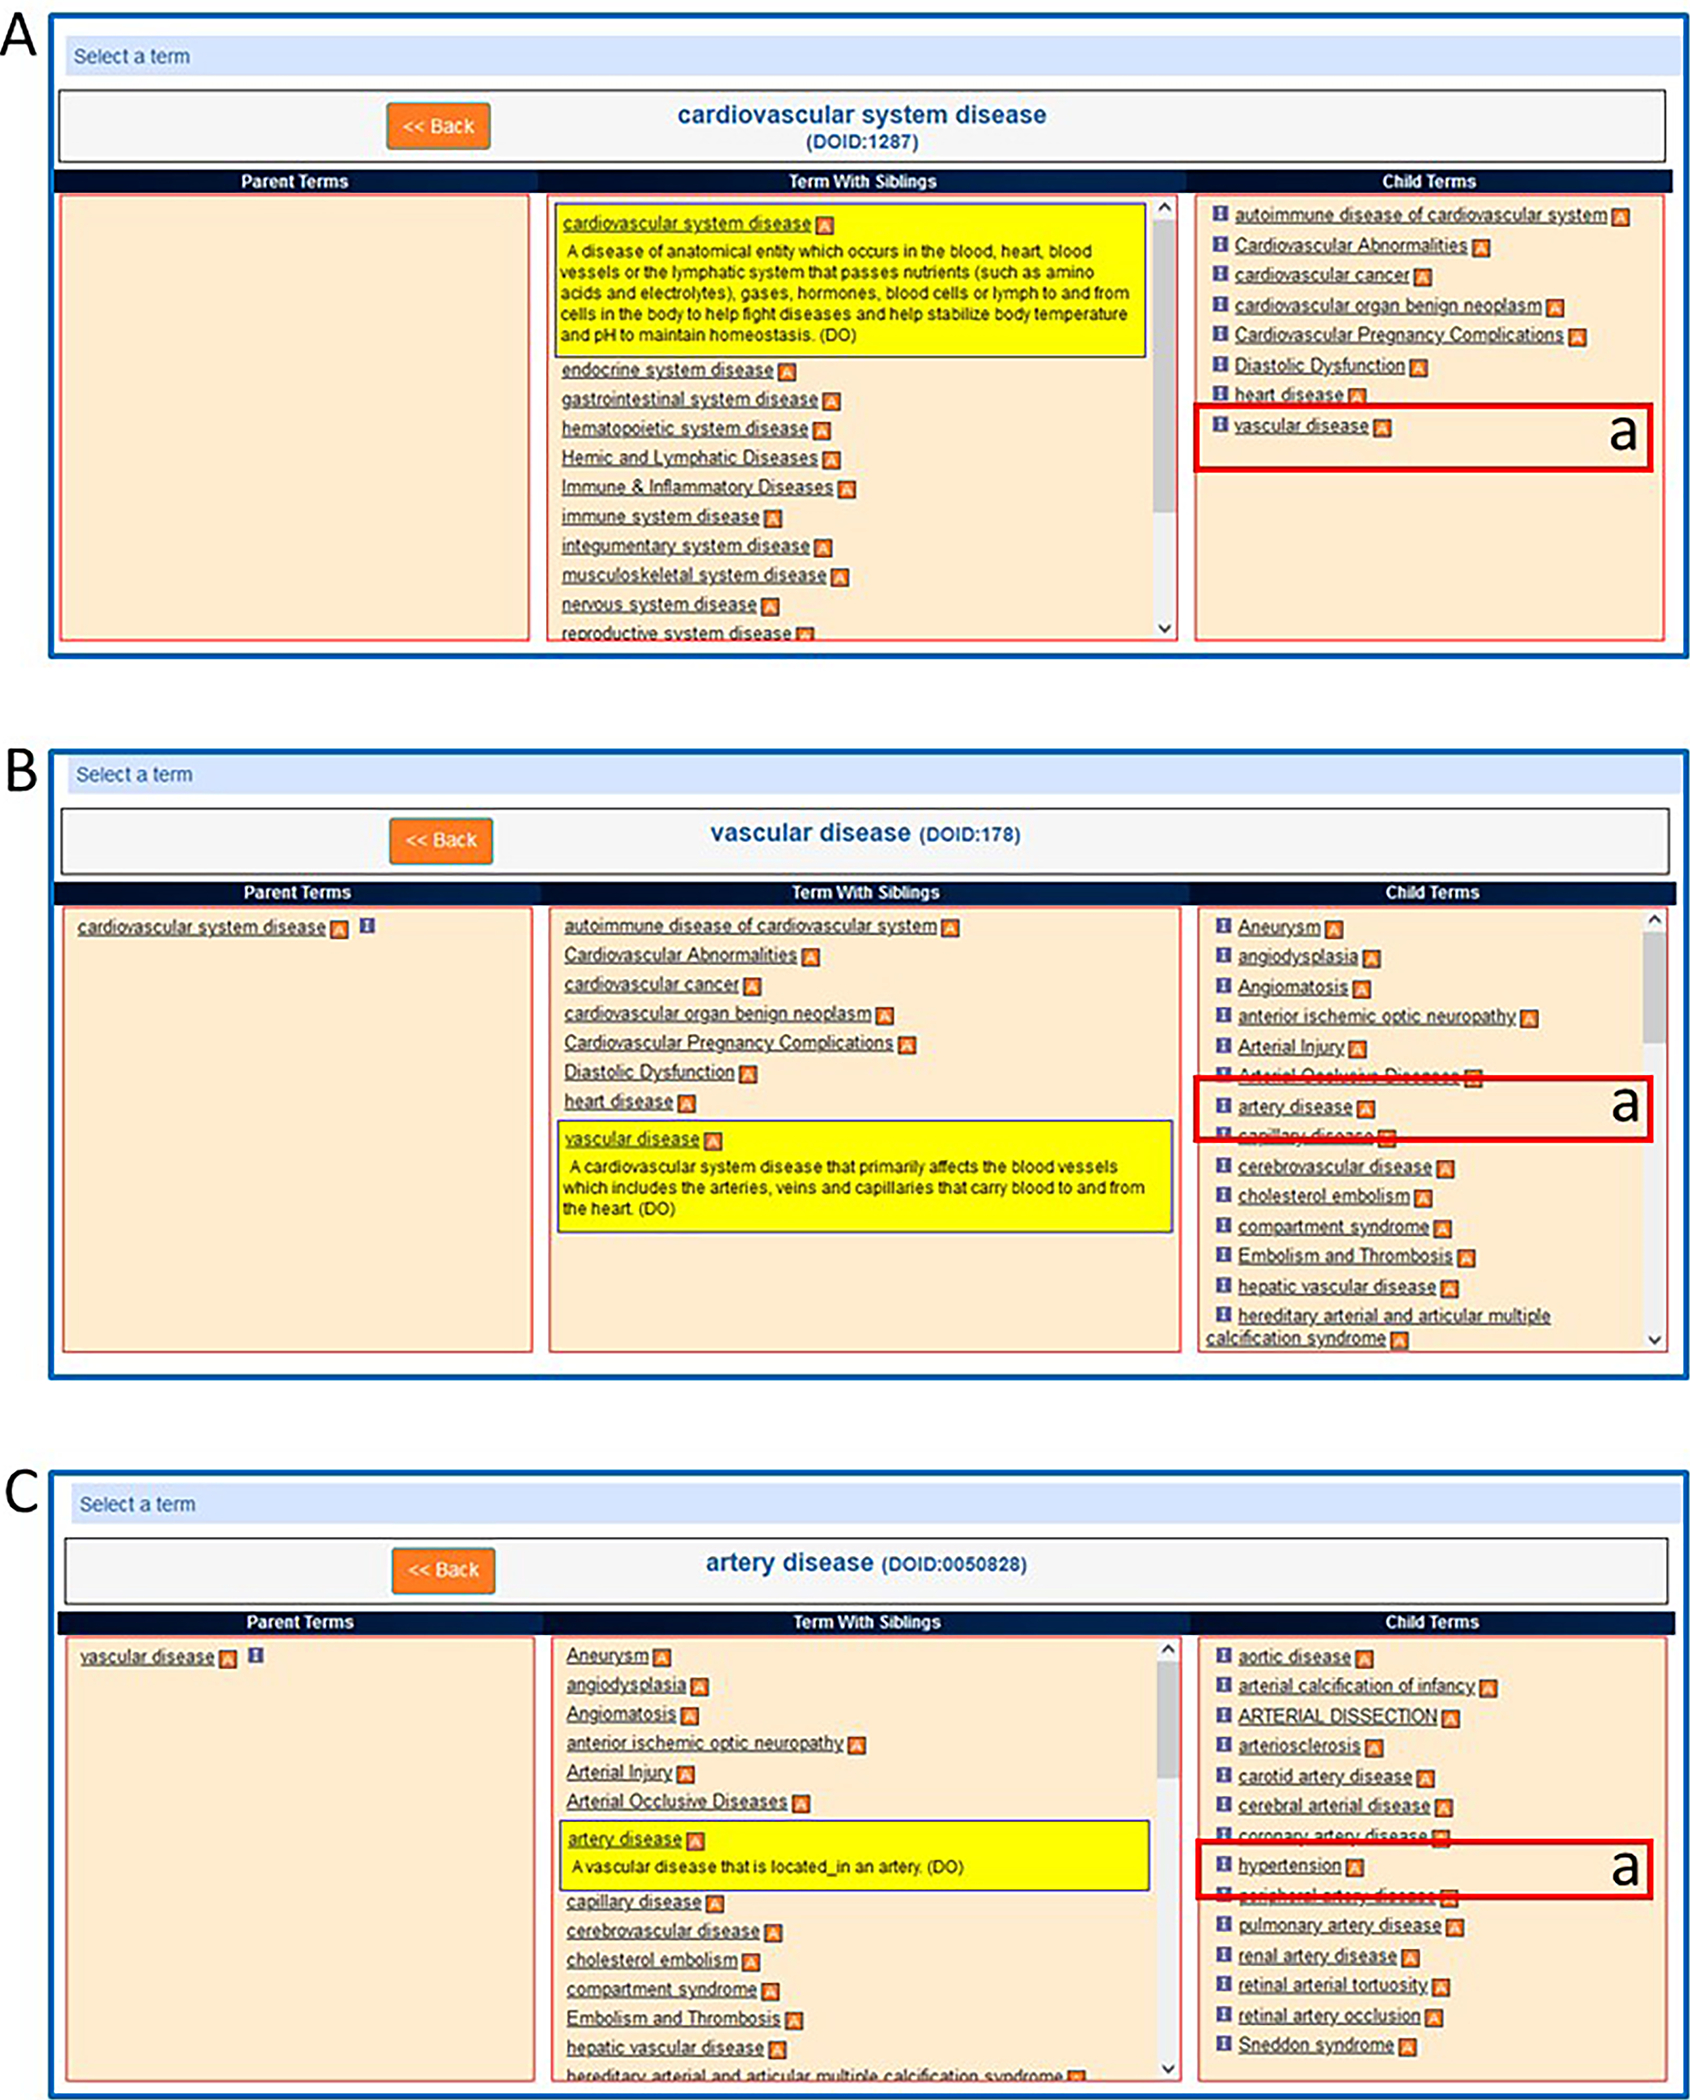
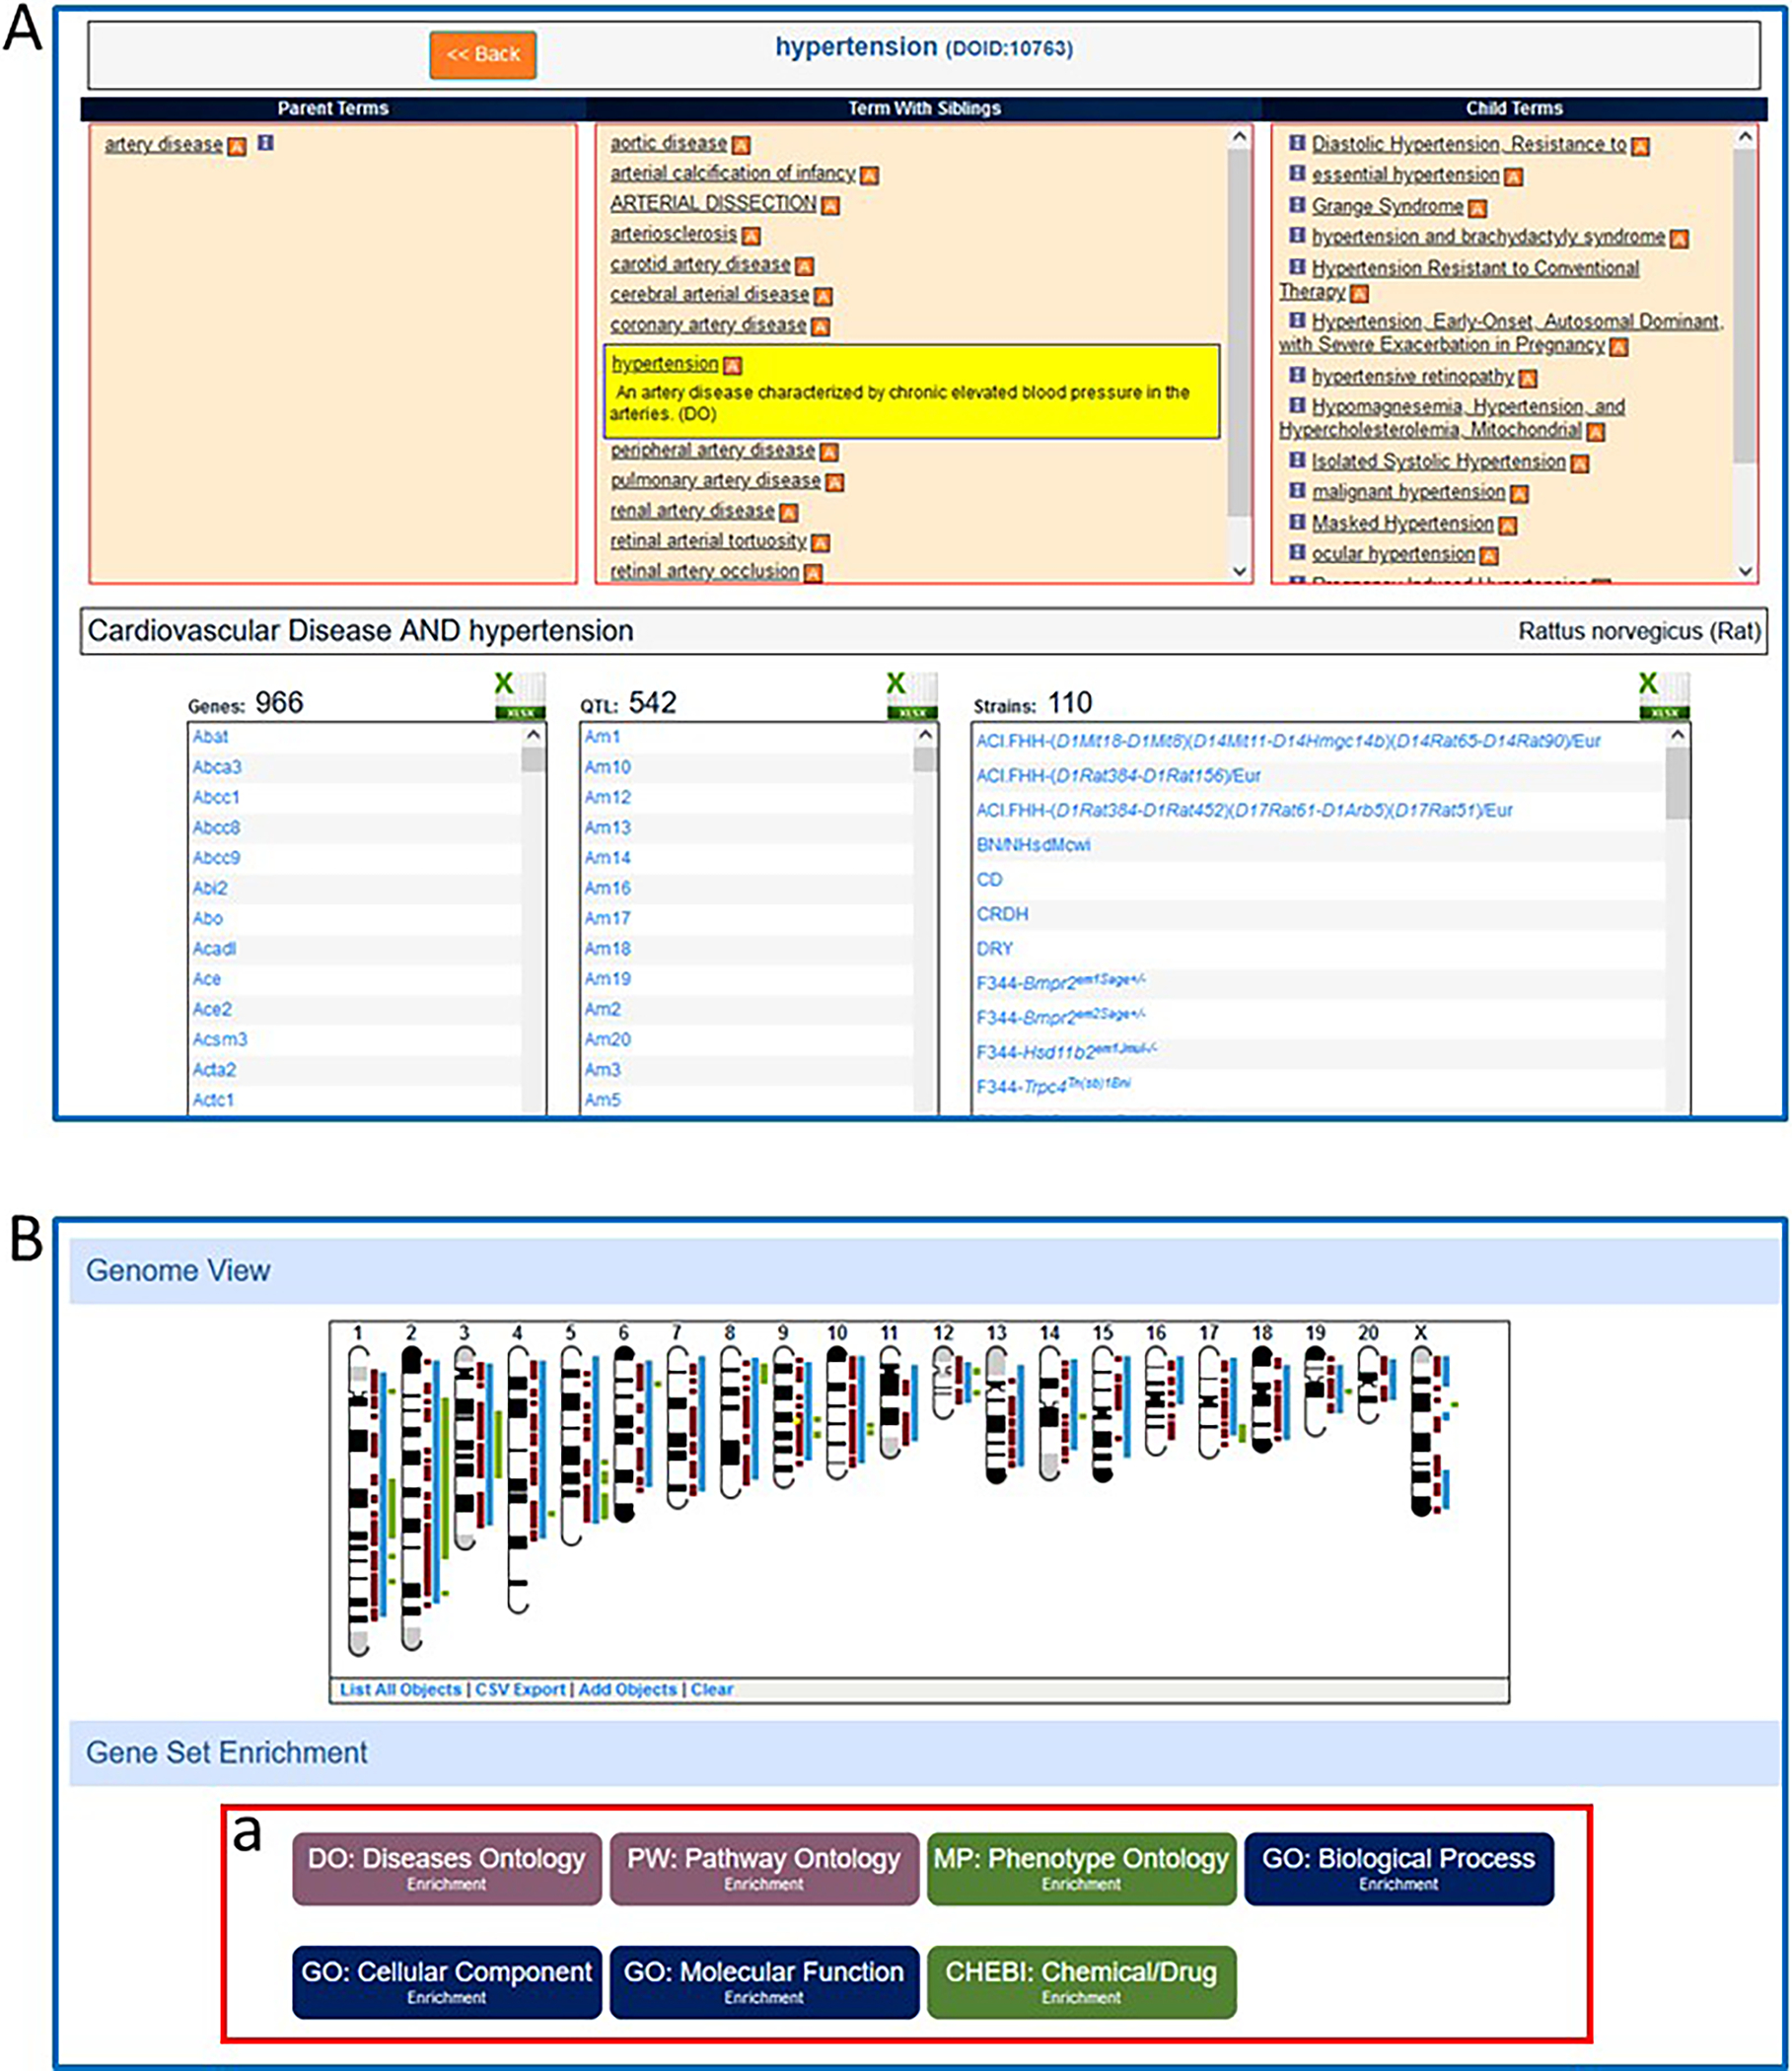
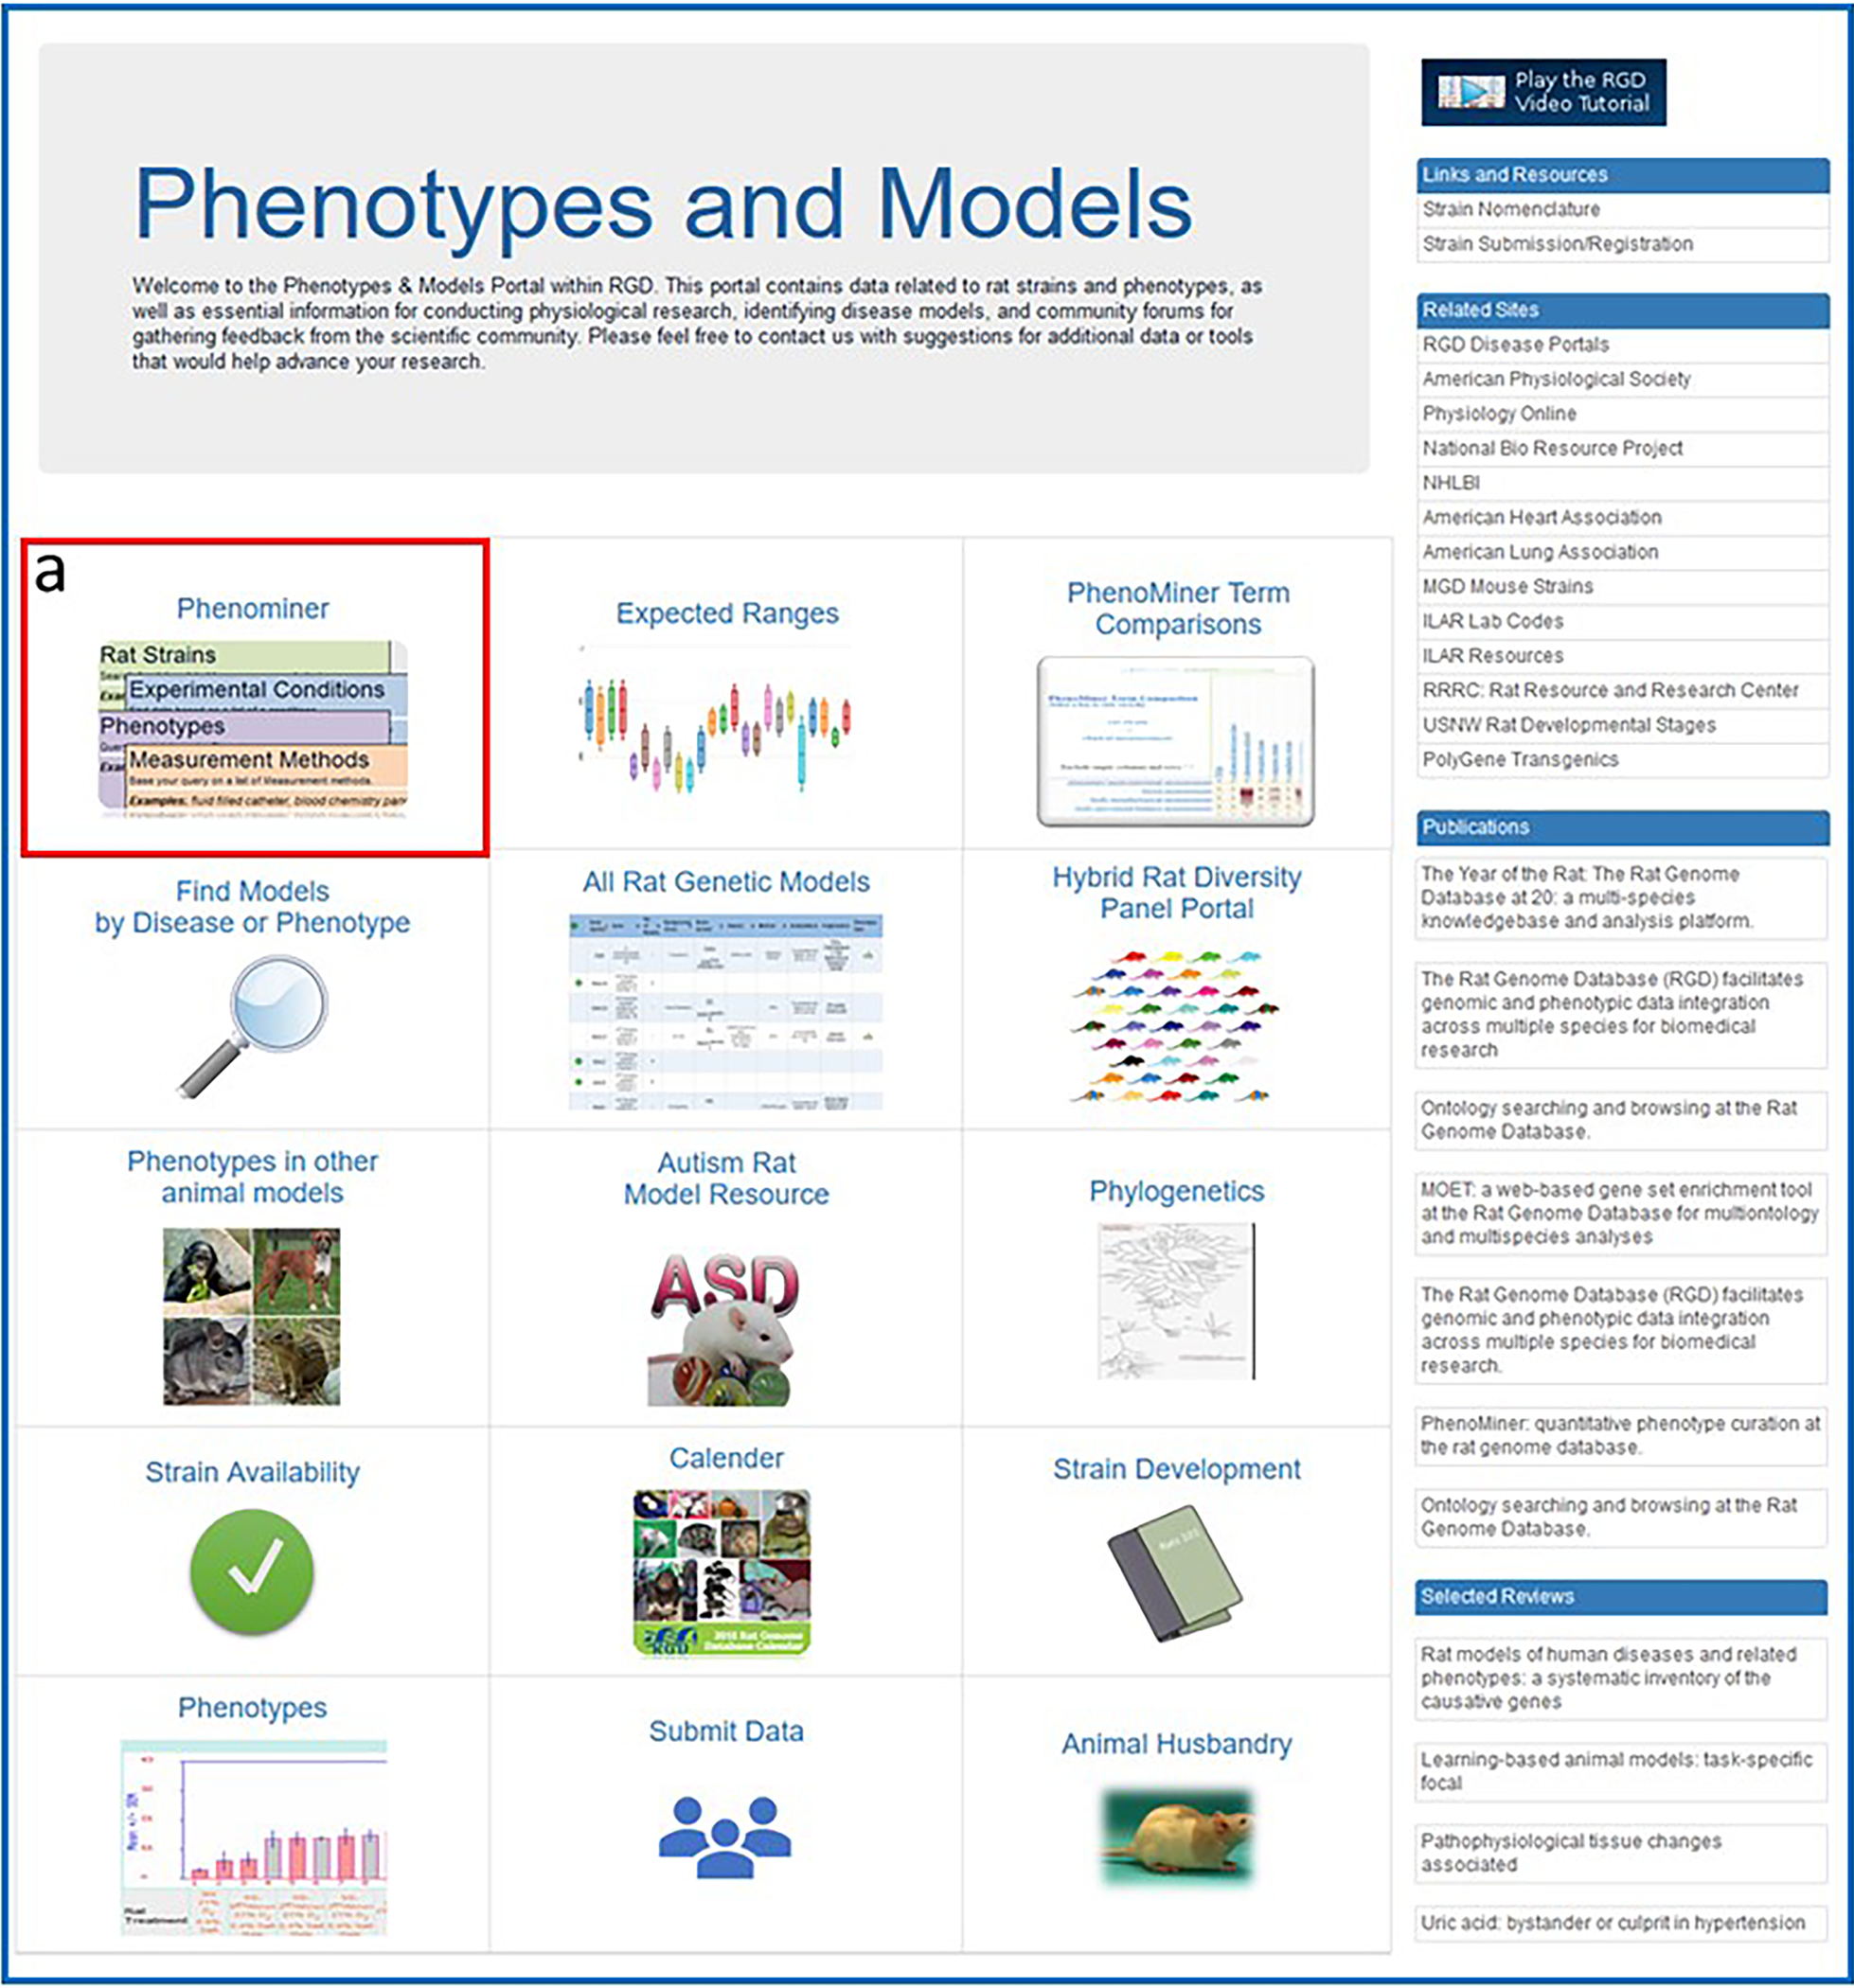
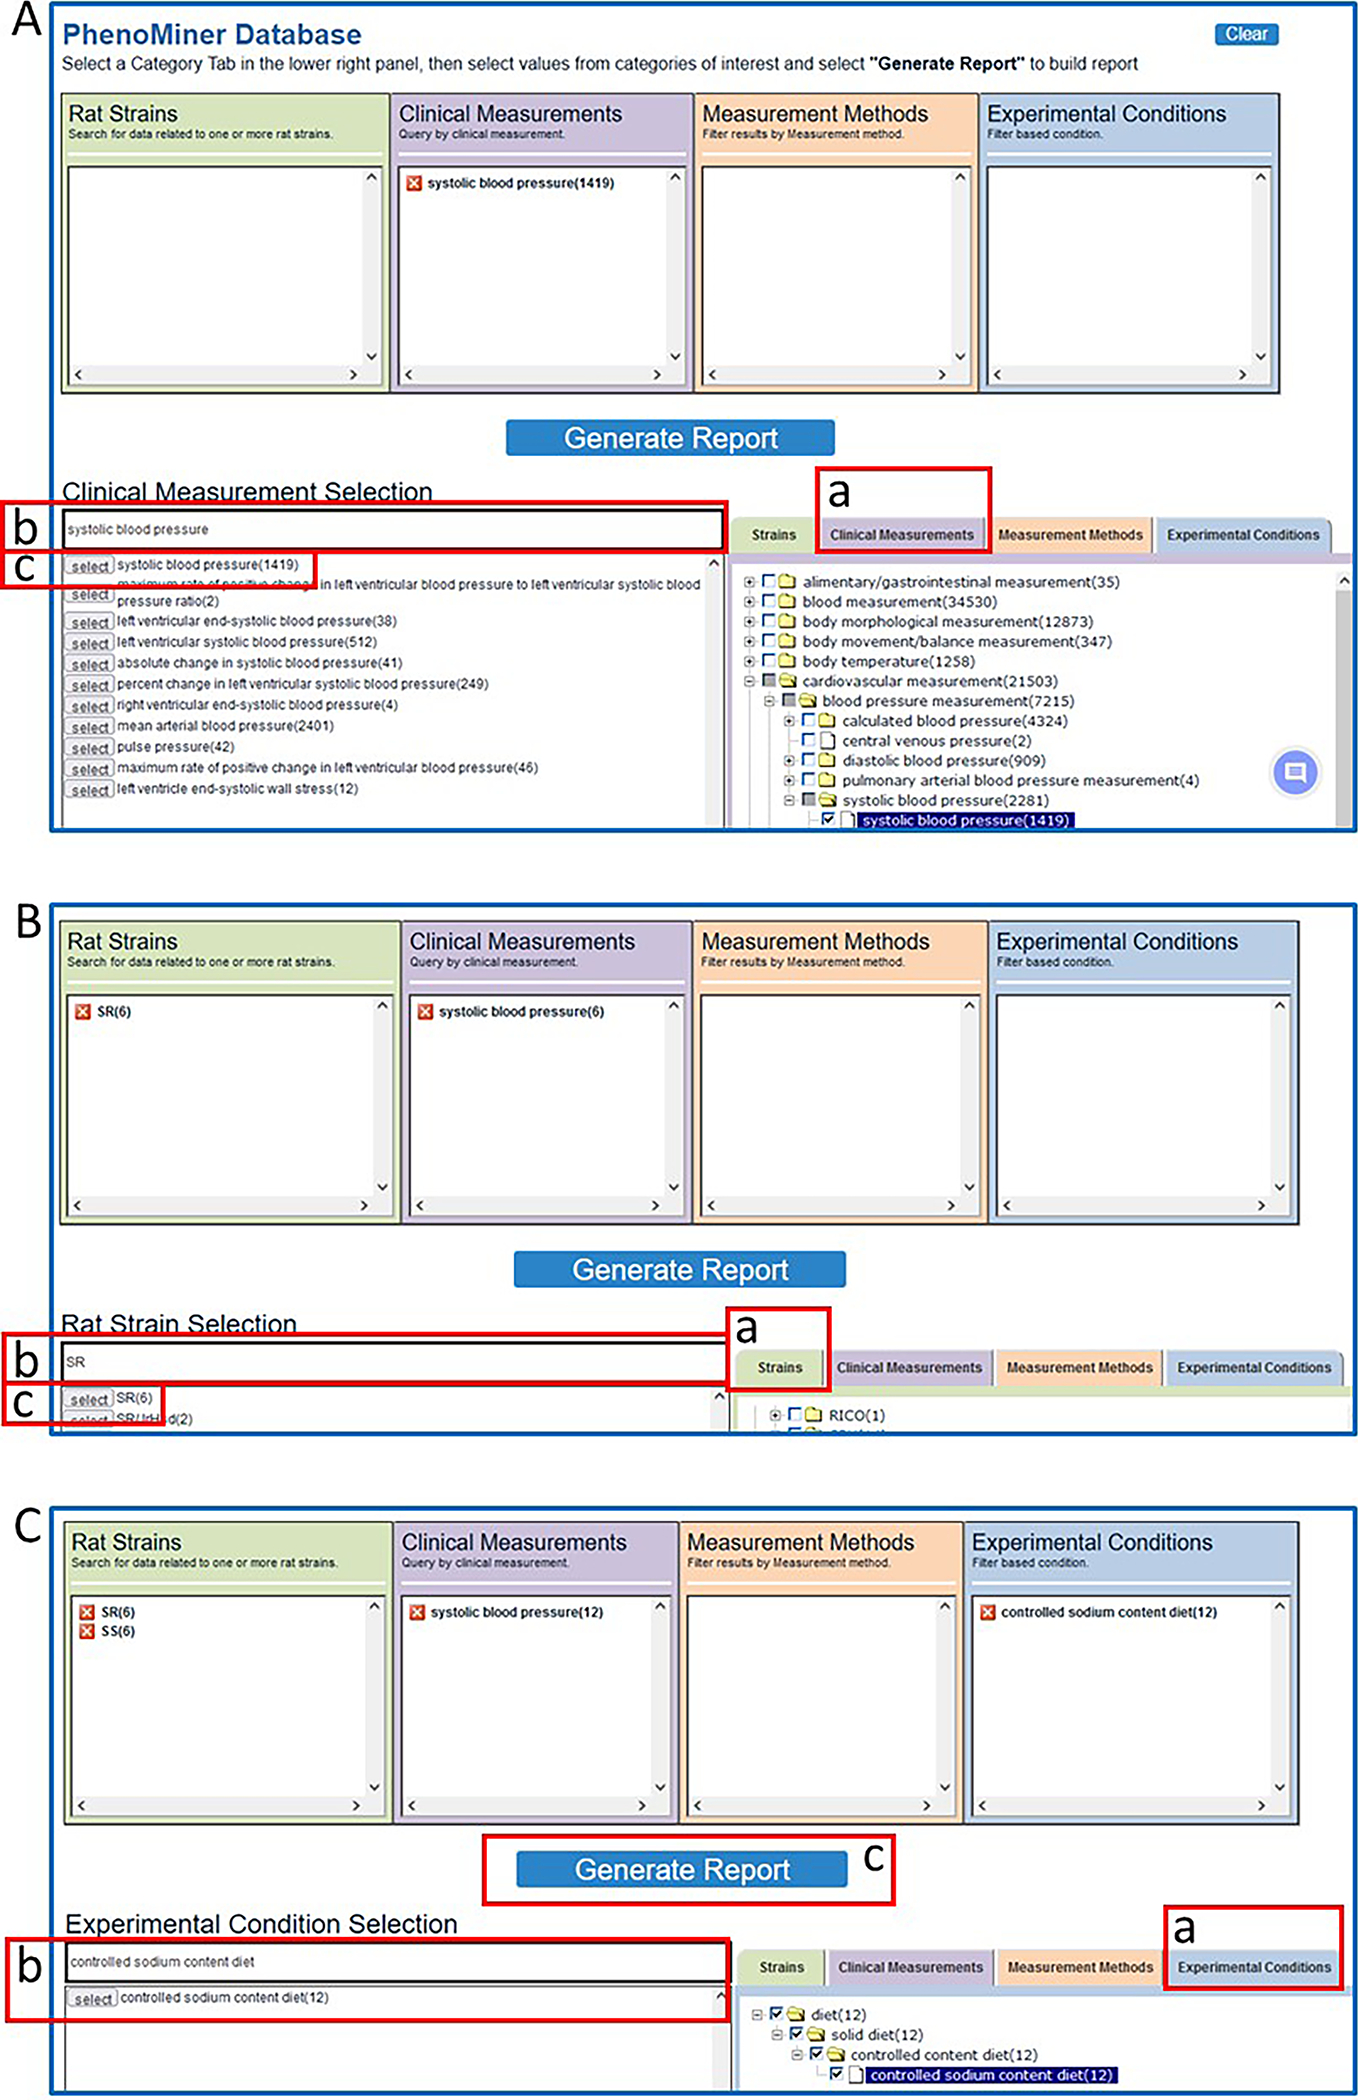
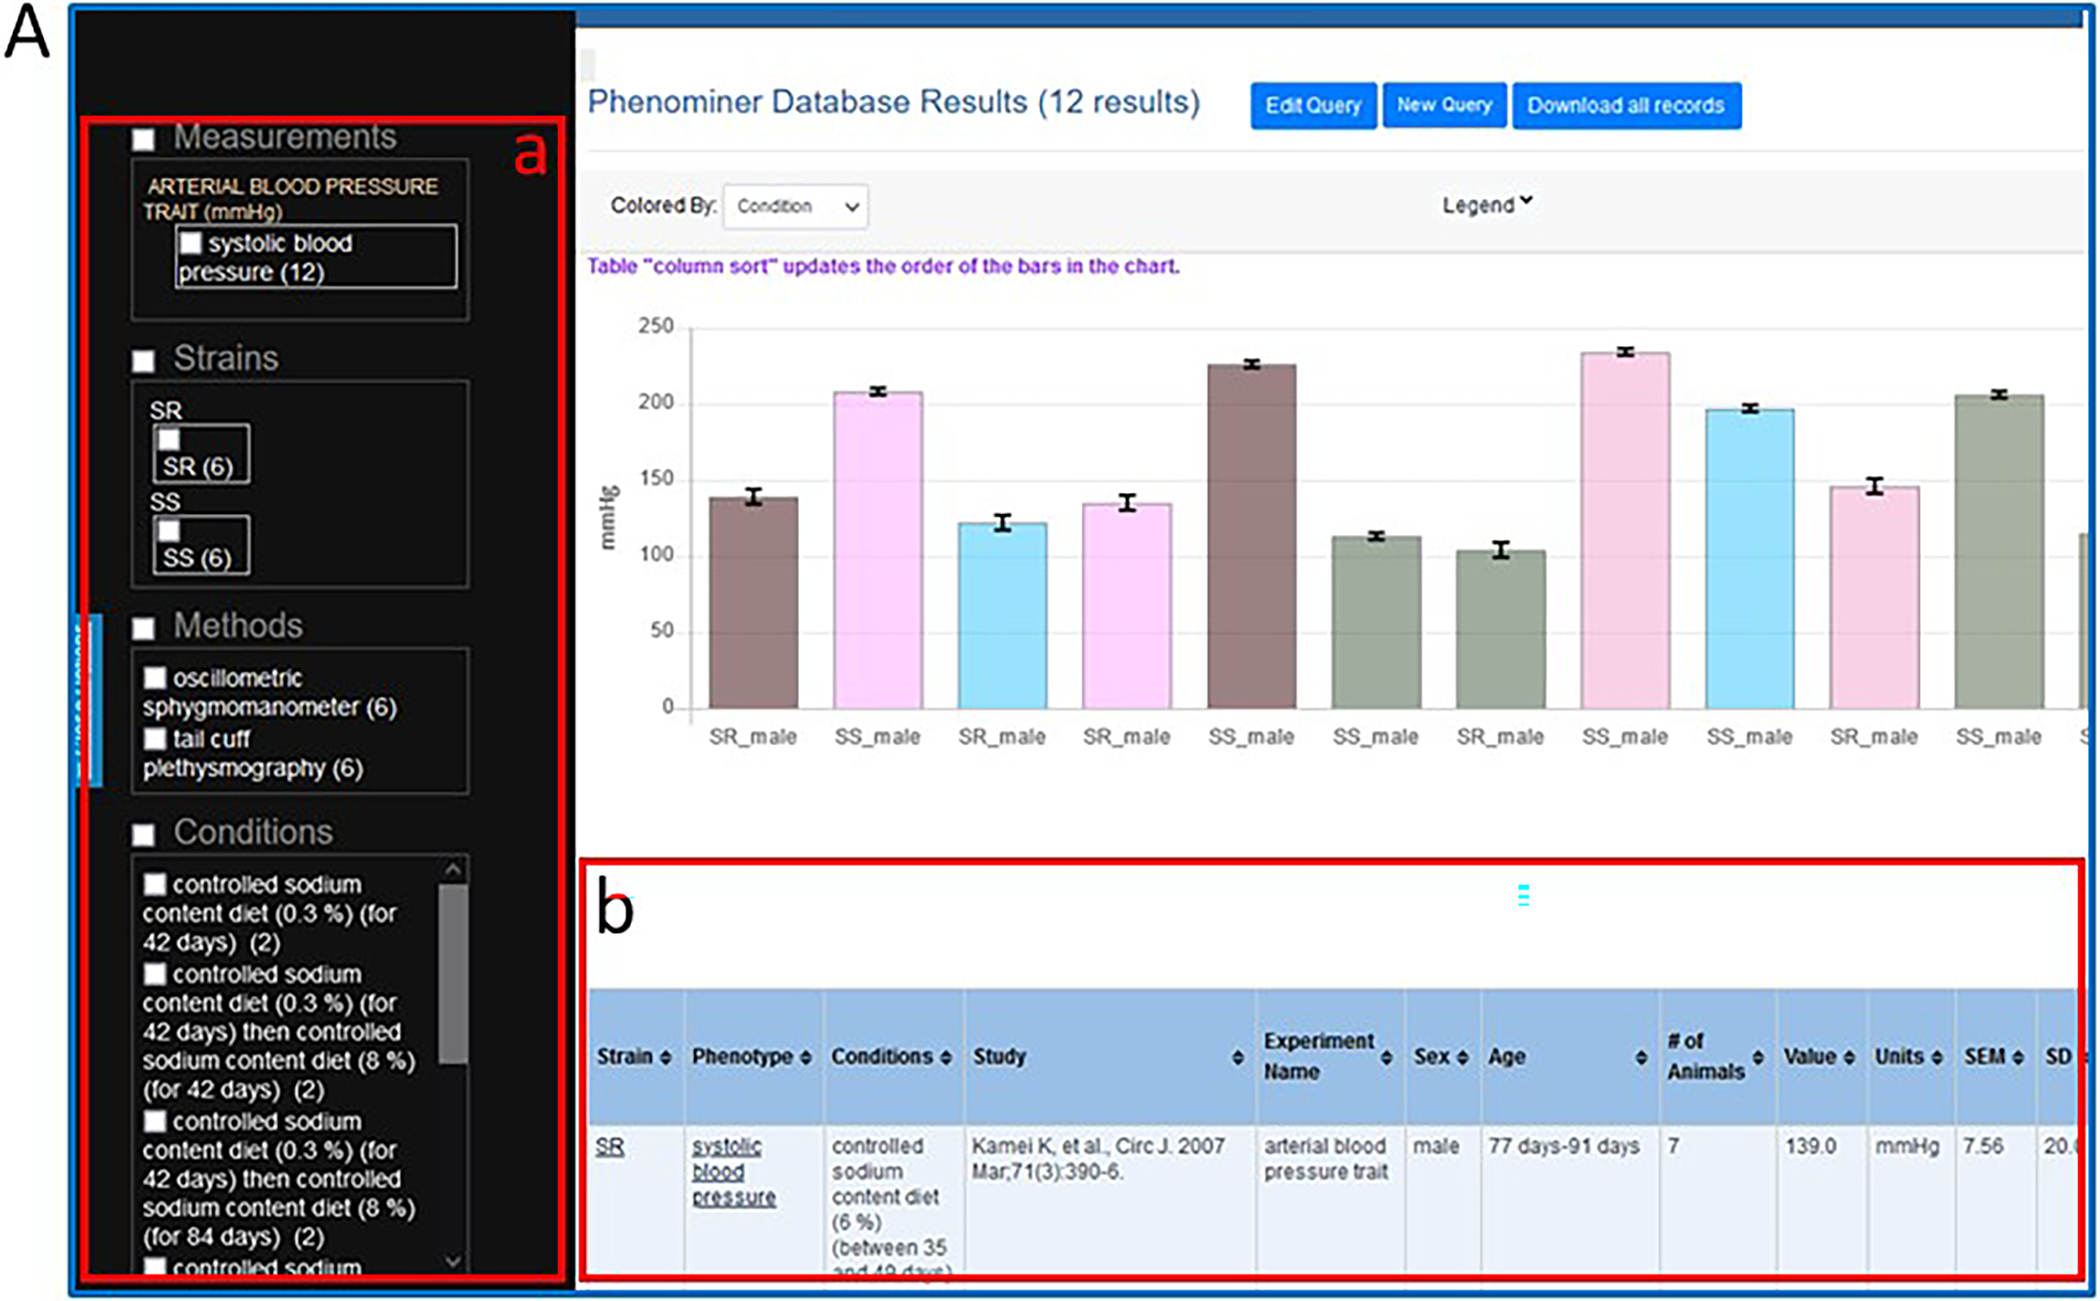
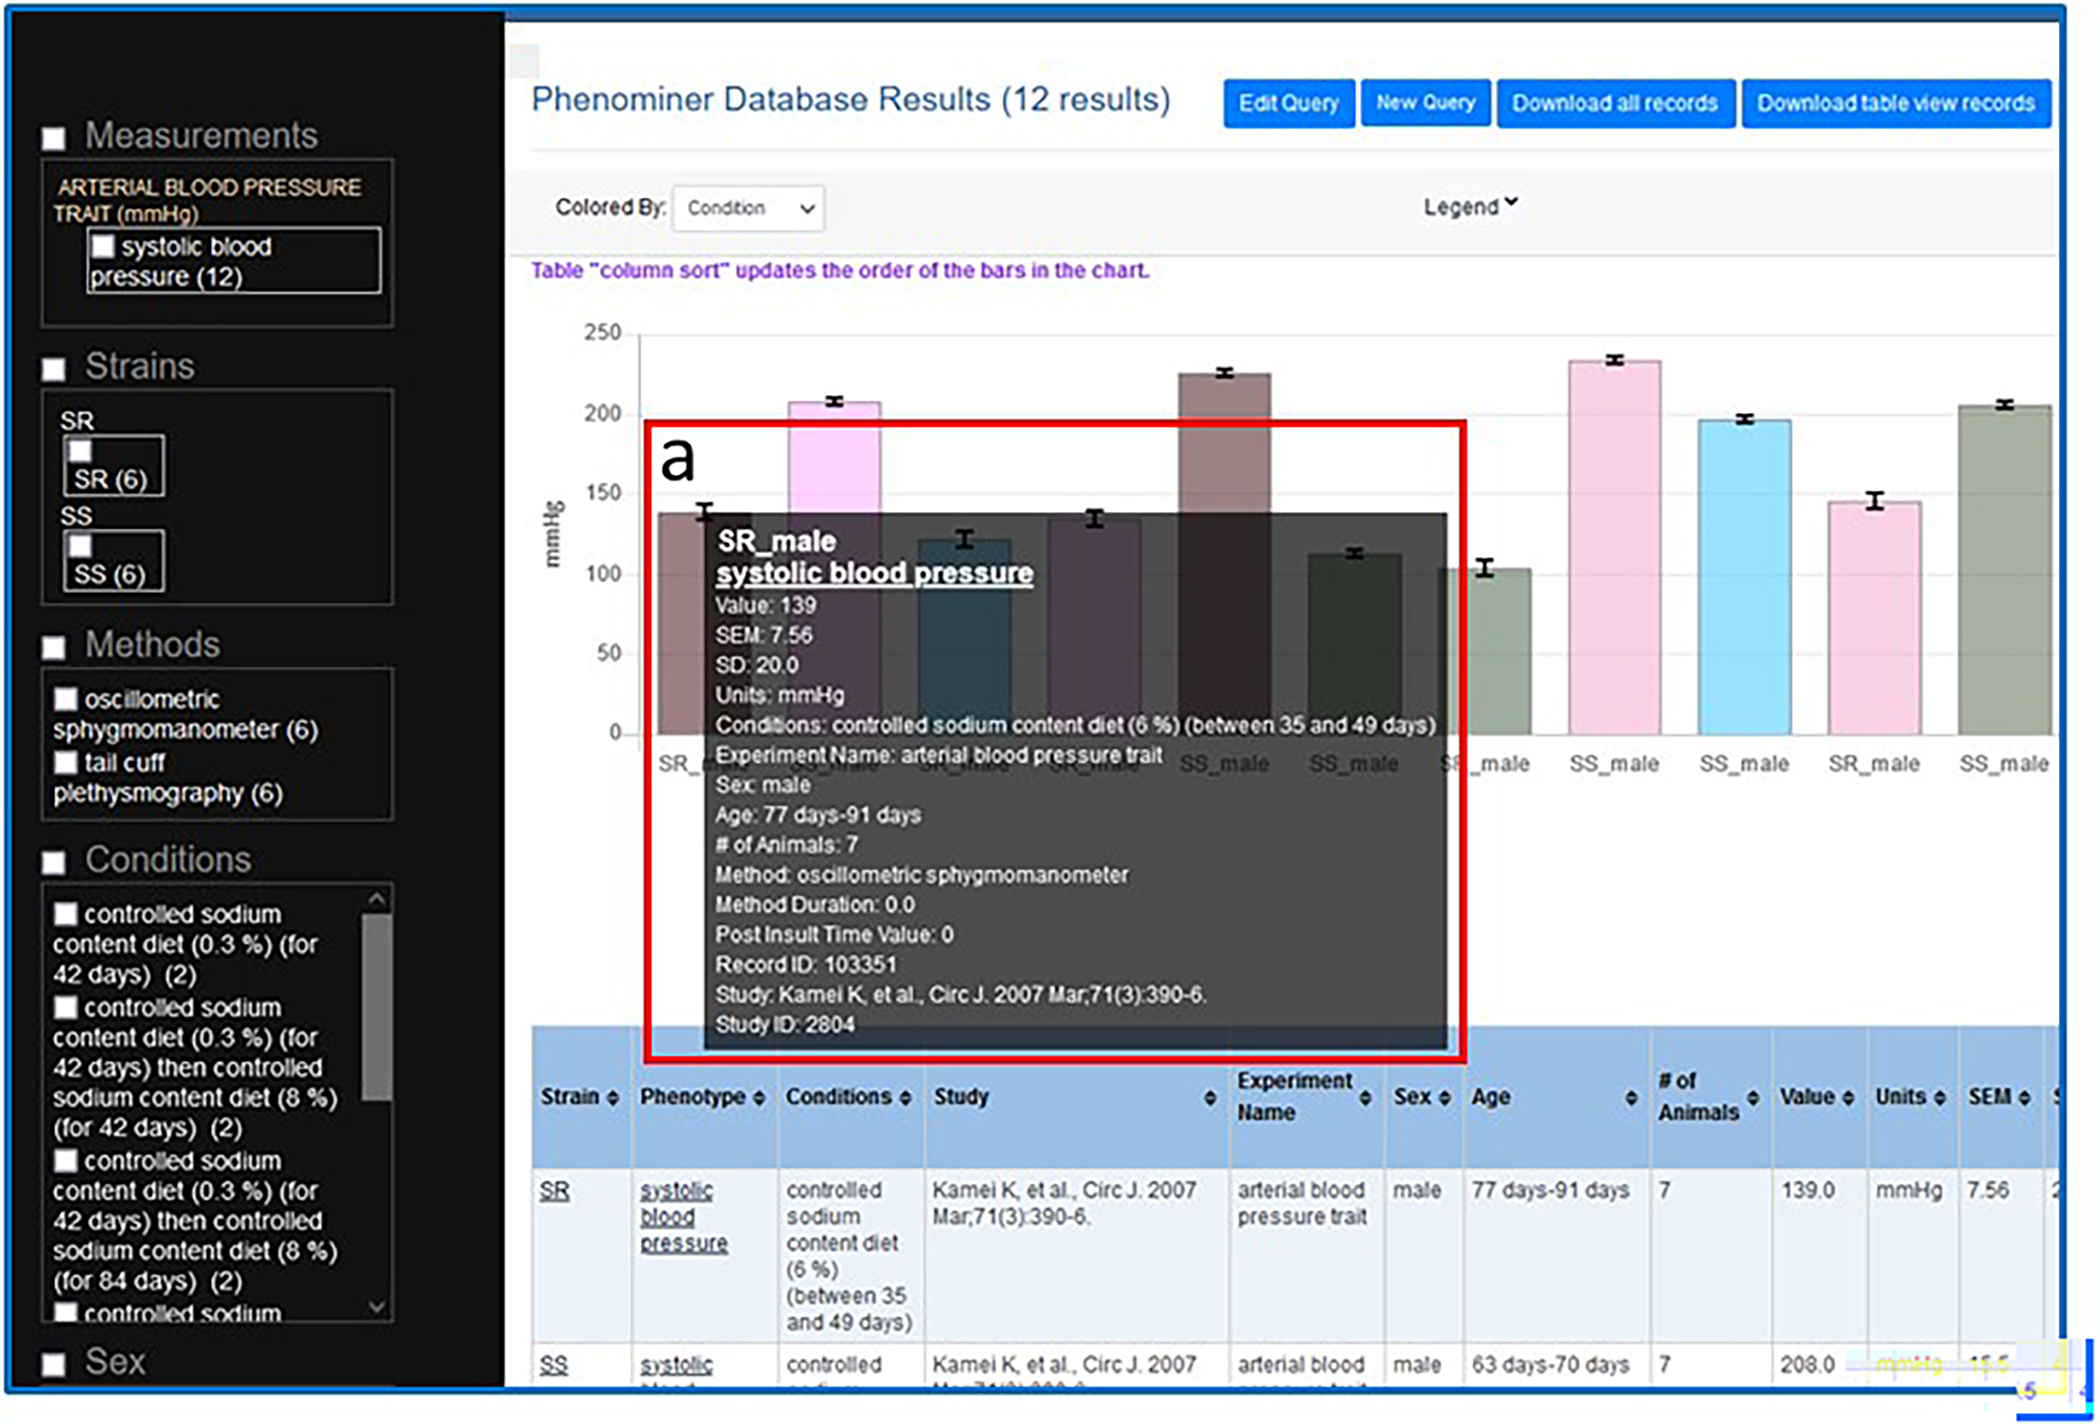
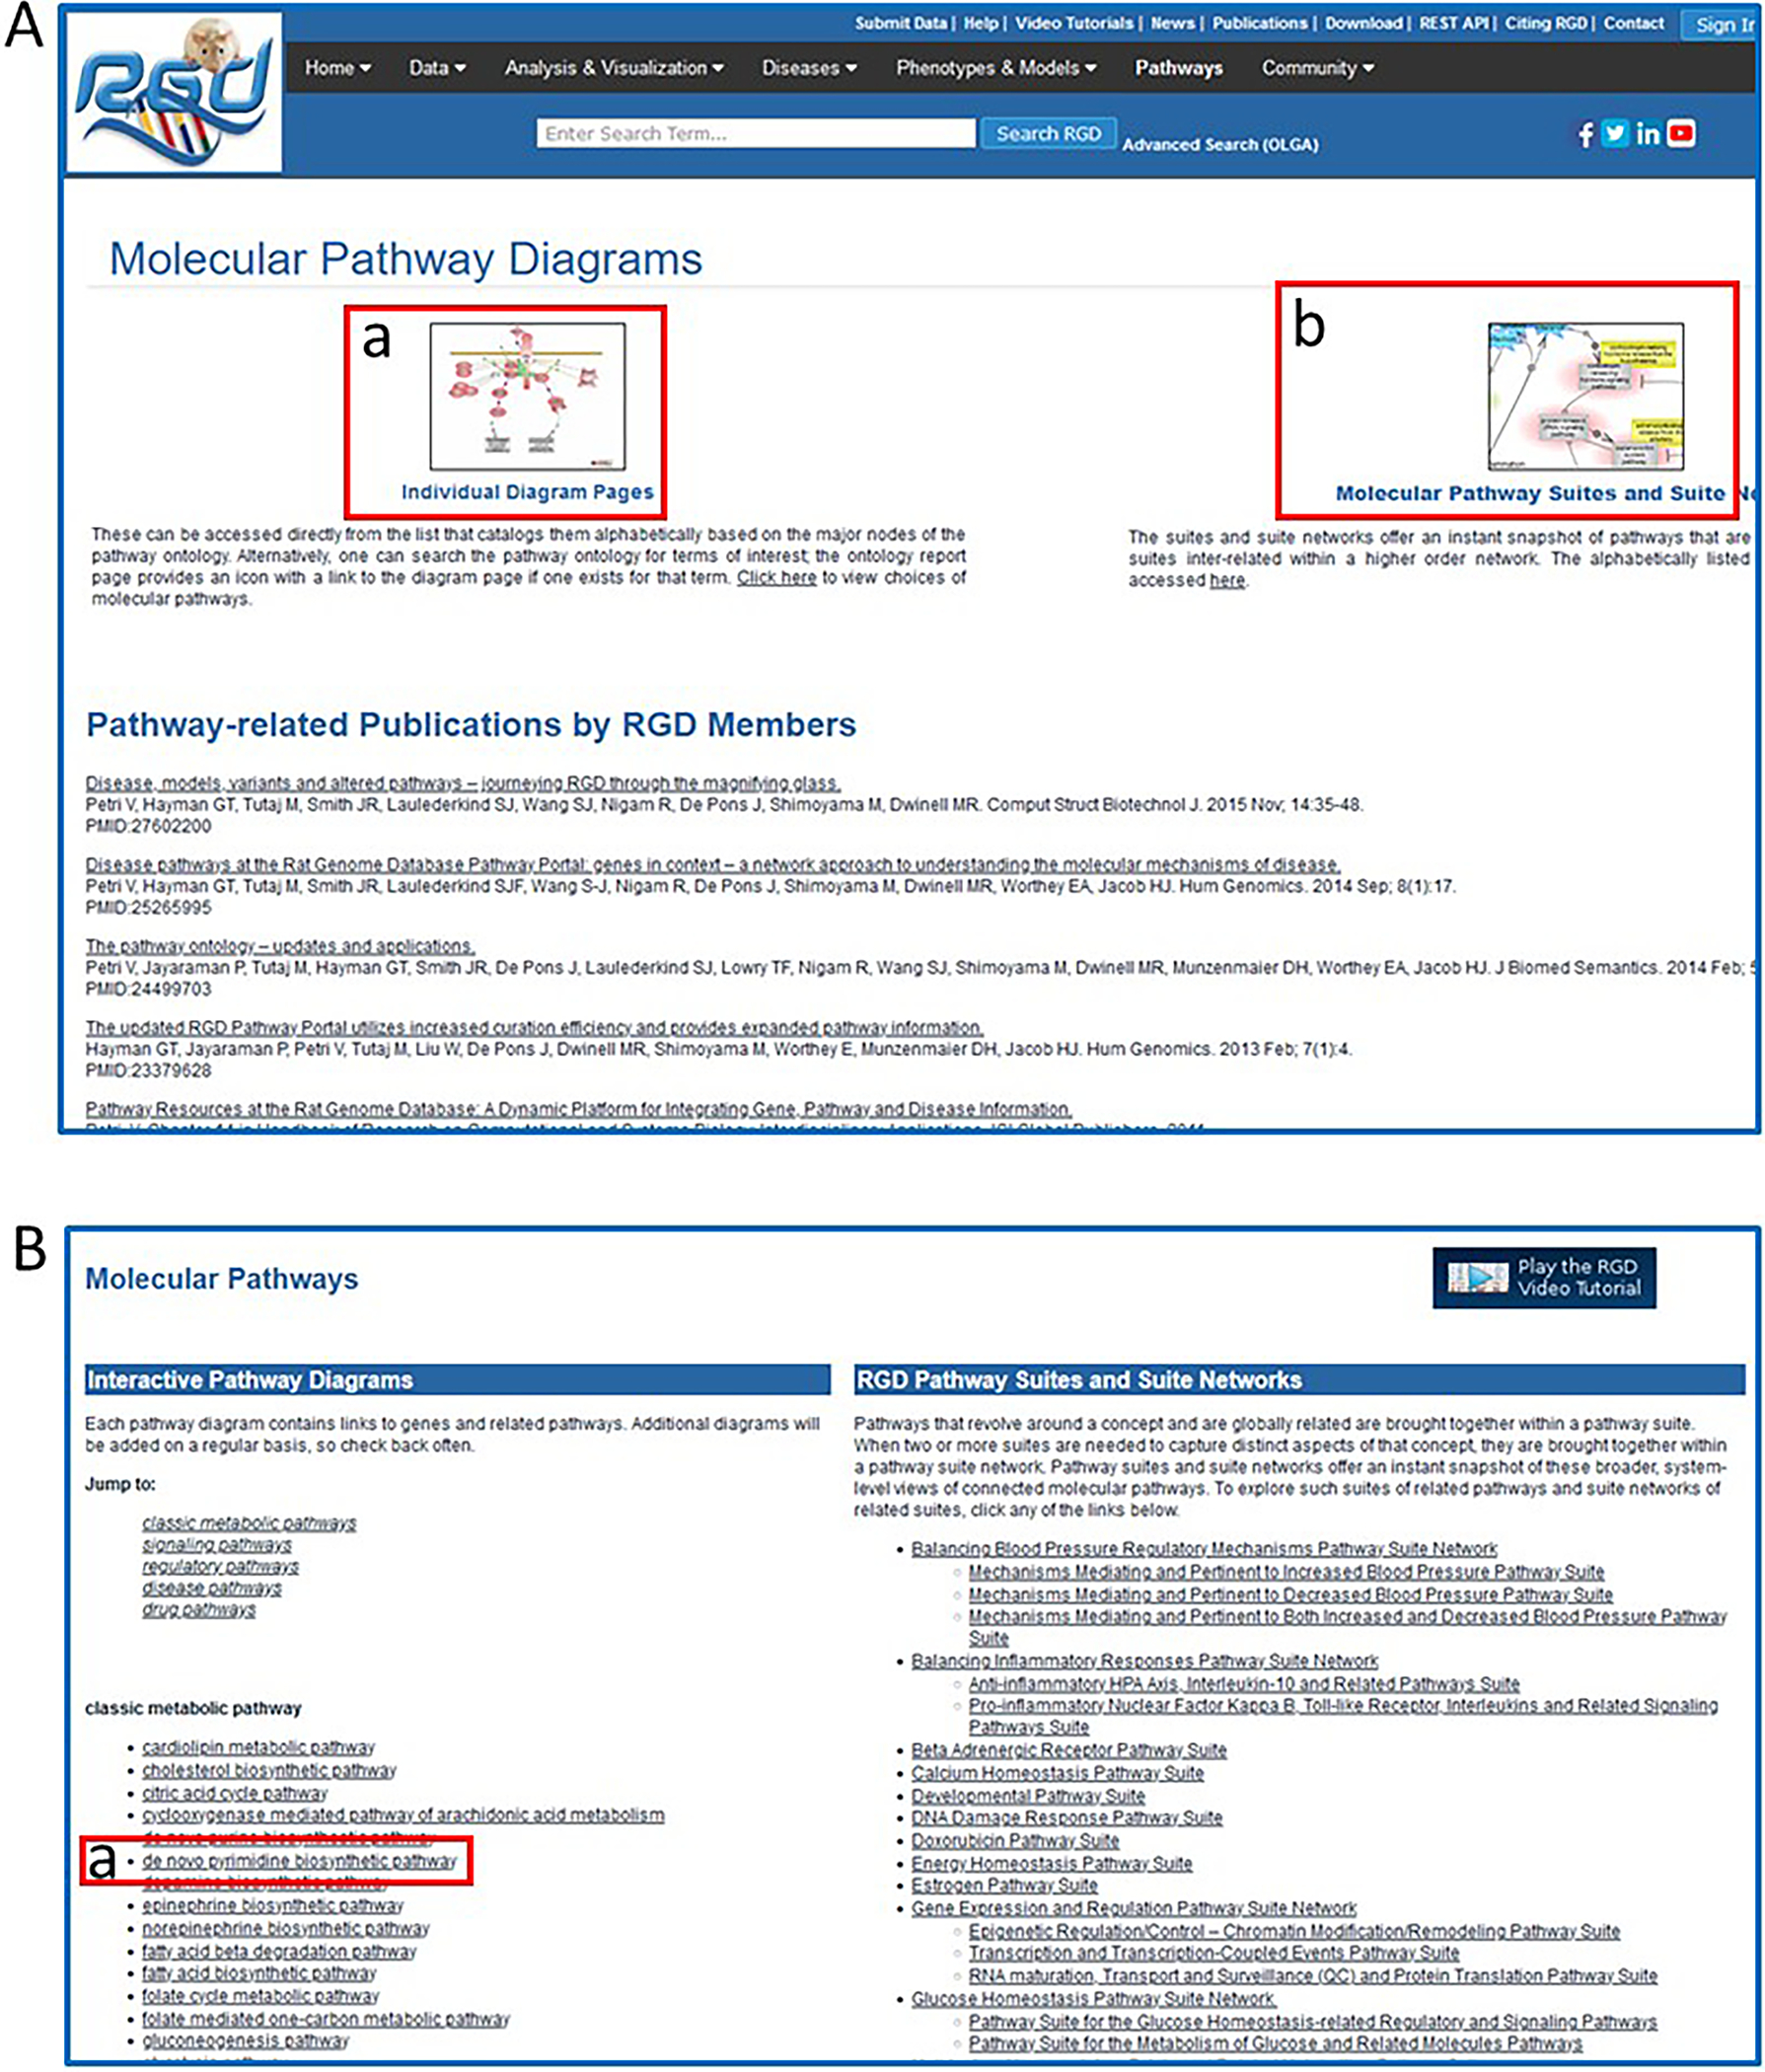
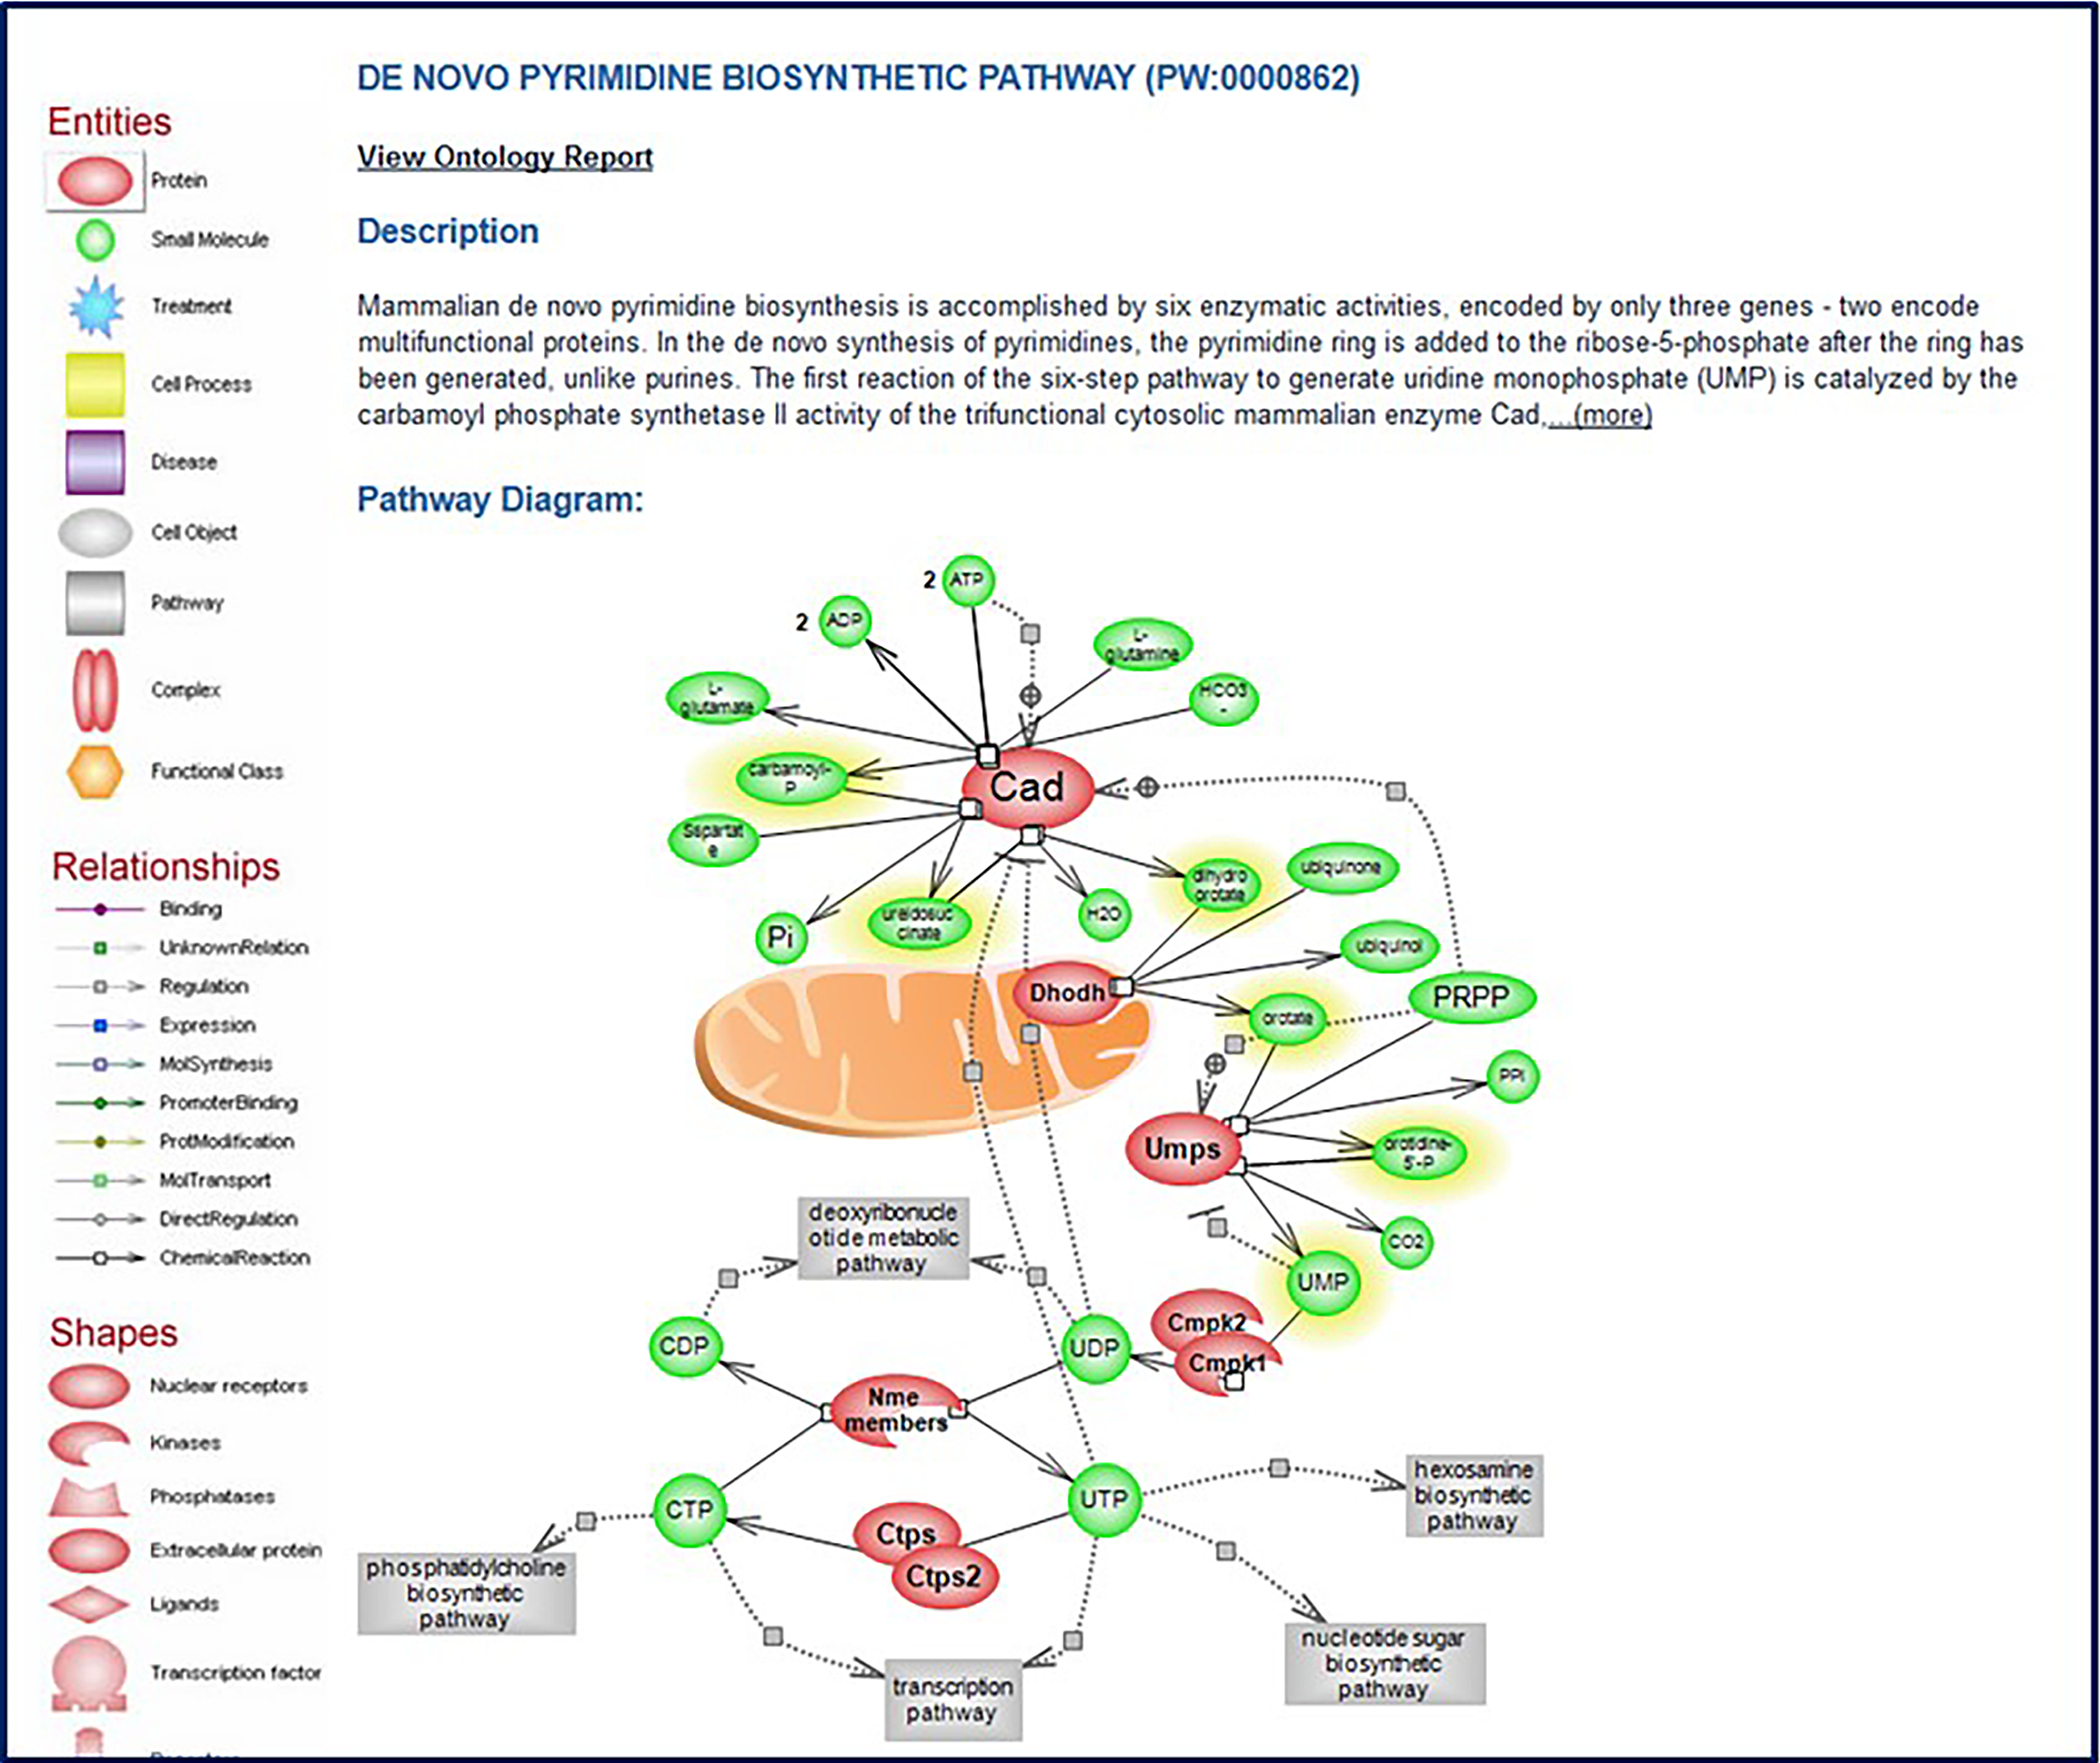
The laboratory rat, Rattus norvegicus, is an important model of human health and disease, and experimental findings in the rat have relevance to human physiology and disease. The Rat Genome Database (RGD, https://rgd.mcw.edu) is a model organism database that provides access to a wide variety of curated rat data including disease associations, phenotypes, pathways, molecular functions, biological processes, cellular components, and chemical interactions for genes, quantitative trait loci, and strains. We present an overview of the database followed by specific examples that can be used to gain experience in employing RGD to explore the wealth of functional data available for the rat and other species. © 2023 Wiley Periodicals LLC. Basic Protocol 1: Navigating the Rat Genome Database (RGD) home page Basic Protocol 2: Using the RGD search functions Basic Protocol 3: Searching for quantitative trait loci Basic Protocol 4: Using the RGD genome browser (JBrowse) to find phenotypic annotations Basic Protocol 5: Using OntoMate to find gene-disease data Basic Protocol 6: Using MOET to find gene-ontology enrichment Basic Protocol 7: Using OLGA to generate gene lists for analysis Basic Protocol 8: Using the GA tool to analyze ontology annotations for genes Basic Protocol 9: Using the RGD InterViewer tool to find protein interaction data Basic Protocol 10: Using the RGD Variant Visualizer tool to find genetic variant data Basic Protocol 11: Using the RGD Disease Portals to find disease, phenotype, and other information Basic Protocol 12: Using the RGD Phenotypes & Models Portal to find qualitative and quantitative phenotype data and other rat strain-related information Basic Protocol 13: Using the RGD Pathway Portal to find disease and phenotype data via molecular pathways.

Keywords: database; gene; ontology; quantitative trait locus; rat.


Conflict of interest statement

CONFLICT OF INTEREST STATEMENT:

Disclosure Statement: The authors have no conflicts of interest to declare.

Figures

Figure 1
Figure 1
The RGD home page. Tabs and links to all the data and analysis tools at RGD are found here: Menu bar (A), General text search box (B), Links to data visualization and analysis software tools (C), and RGD messages made on Twitter (D). The bottom half of the page covers RGD tutorial videos (E), RGD news (F), and a conference list for users (G).
Figure 2
Figure 2
Intermediate search results page. This page shows results grouped by category (ontology category example: A. Gene Ontology) with links to the specific groups of data.
Figure 3
Figure 3
Intermediate search results page. This page provides the ontology results of a general search for “protease”.
Figure 4
Figure 4
Search results for the Gene Ontology term “protease binding”. This figure tracks the search of “protease binding” through the general search and the RGD term browser to the ontology report page.
Figure 5
Figure 5
A. Gene Search page. This page provides a gene-specific version of the RGD data search. B. Genes results page. This page displays gene search data for rat with multiple options for viewing and analyzing the results.
Figure 6
Figure 6
Ontology general search results for the word “protease”. These pages highlight the narrowing of the search results down to a single Gene Ontology-Molecular Function term.
Figure 7
Figure 7
Ontology report page. This page defines the selected ontology term, lists all RGD objects annotated with that term and its children, and displays the genomic location of annotated genes, QTLs, and congenic strains.
Figure 8
Figure 8
Bottom of ontology report page. Underneath the annotated object list are text and graph representations of the ontology branch(es) containing the selected term.
Figure 9
Figure 9
The RGD ontology browser. Any of the ontologies/vocabularies used at RGD can be displayed in this horizontally oriented term browser.
Figure 10
Figure 10
The GViewer. All genes, QTLs, and congenic strains annotated to the selected term and its descendants are shown at the appropriate chromosomal location.
Figure 11
Figure 11
The RGD gene report page for Drd3. The summary/general section has a textual description of the gene, shows orthologs, has links to Alliance of Genome Resources gene pages, and genomic position information. Links on the left side lead to the Annotation, References, Genomics, and other sections of the page.
Figure 12
Figure 12
A. The QTL-specific search. This page uses a keyword search with optional restrictions to narrow the search. B. QTL search results for “blood pressure” on rat chromosome 8.
Figure 13
Figure 13
QTL report page including general information section, Annotation section, and others.
Figure 14
Figure 14
QTL report page (A) and QTL-term report page (B). The QTL-term report page gives annotation information such as type of evidence, data source, number of annotations from that data source, and number of references associated with the QTL.
Figure 15
Figure 15
Genes in Region subsection of the QTL report page.
Figure 16
Figure 16
Position Markers subsection of the QTL report page.
Figure 17
Figure 17
The References (A) and Additional Information (B) sections of the QTL report page.
Figure 18
Figure 18
A default view of rat JBrowse with an RGD genes track selected.
Figure 19
Figure 19
JBrowse page with “Cardiovascular Diseases” selected, showing rat genes, rat QTLs, and rat strains.
Figure 20
Figure 20
Navigating to OntoMate, the ontology-driven, literature search tool at RGD.
Figure 21
Figure 21
OntoMate homepage with search choices of the disease term “hypertension” and the gene “Abcc8”.
Figure 22
Figure 22
OntoMate results page for a search of “hypertension” and “Abcc8”. Various features are pointed out (A-a & b, B-a through B-d).
Figure 23
Figure 23
A. MOET tool homepage B. MOET homepage with gene list entered in textbox.
Figure 24
Figure 24
A. MOET results page with enrichment results for the entered rat gene list and Disease Ontology (default ontology view, table A-b). Data for orthologs in other species are accessed by the tabs shown in A-c. Data for the same genes in other ontologies are accessed by the tabs in A-d. B. Graph of results shown in table (A-b).
Figure 25
Figure 25
Steps in use of the OLGA tool. A. Selection of “Ontology Annotation”. B. Selection of “Disease Ontology”. C. Selection of “hypertension”. D. Preliminary results and selection of another list (D-a).
Figure 26
Figure 26
A. Further steps in OLGA tool for analysis of two gene lists. B. Final result of overlapping gene sets (B-a) and link to more analysis options (B-b). C. Page of links to other RGD tools for further analysis of final gene result list.
Figure 27
Figure 27
A. GA tool homepage with sample gene list entered in textbox and option of entering genomic region (A-b). B. Selection page for annotation ontologies, external links, and orthologs desired in search result. C. Result page with annotations for entered gene list (C-a) and further options for results display (C-b).
Figure 28
Figure 28
A. Display of “Annotation Distribution” (enrichment-type analysis). B. Details for genes associated with one of the disease terms (nervous system disease, B-a) in the list and link (B-b) to “Comparison Heat Map” analysis.
Figure 29
Figure 29
Display of “Comparison Heat Map” results from data entered in Figure 27 with viewing options (29-a) and a link (29-b) to additional analysis tools.
Figure 30
Figure 30
The Interviewer homepage with textbox (30-a) for entering protein/gene identifiers.
Figure 31
Figure 31
A. The Interviewer results page for rat protein ACADL with graphic display (A-a), data table (A-b), and tool controls (A-c). B. Highlighted gene in graphic with details pane (B-a) and download options (B-b & B-c).
Figure 32
Figure 32
Steps in use of the Variant Visualizer tool. A. Variant Visualizer homepage showing rat strain selection button (A-a) and default assembly (A-b) ready for analysis. B. Rat strain selection page. C. Options for limiting analysis based on assembly, genomic position, function, and gene(s). D. Entry page for a selected gene list. E. Option page for limiting the analysis.
Figure 33
Figure 33
A. Variant Visualizer results page for the entered genes showing variant distribution across the three selected strains (A-a, Acvrl1 in MWF/Hsd). B. Results page showing nucleotide variants for Acvrl1 across the three strains compared to the reference assembly mRatBN7.2. Individual color-coded variants (B-a) are linked to detailed pop-up pages (C). Optional views and links to further analysis are available from a pop-up selection box accessed by a link in the upper right corner of the display (B-b).
Figure 34
Figure 34
A. RGD Disease Portals homepage with link (A-a) to Cardiovascular Disease Portal. B. Cardiovascular Disease Portal homepage with default selection of “Rattus norvegicus (rat)”.
Figure 35
Figure 35
The embedded onytology term browser in the Cardiovascular Disease Portal showing a sequence of selections: A-a. vascular disease B-a. artery disease C-a. hypertension.
Figure 36
Figure 36
A. The embedded ontology term browser in the Cardiovascular Disease Portal showing the selection of “hypertension” and the lists of genes, QTLs, and strains annotated with the term “hypertension”. B. The Cardiovascular Disease Portal page for “hypertension” with an ideogram showing the genomic locations of genes, QTLs, and regions responsible for strains annotated to “hypertension”. B-a. Gene Set Enrichment section of the Cardiovascular Disease Portal page for “hypertension” which shows the option of MOET enrichment analysis of genes in the “hypertension” annotation set.
Figure 37
Figure 37
The Phenotypes and Models homepage showing the various options of data and tools available, including the PhenoMiner tool (37-a).
Figure 38
Figure 38
Steps in querying the PhenoMiner database. A. After a selection of “Clinical Measurements” (A-a), “systolic blood pressure” is entered in a textbox (A-b) and selected (A-c). B. After a selection of “Strains” (B-a), “SR” is entered in a textbox (B-b) and selected (B-c). C. After repeating B-a, -b, -c for “SS”, “Experimental Conditions” (C-a) is selected, “controlled sodium content diet” is entered in a textbox and selected (C-b), and “Generate Report” is selected to activate the query.
Figure 39
Figure 39
A. The PhenoMiner results page showing the graphed results of the SR/SS/systolic blood pressure/controlled sodium content diet query, the data filtering options (A-a), and the query results in table form (A-b).
Figure 40
Figure 40
The PhenoMiner results page showing the graphed results of the SR/SS/systolic blood pressure/controlled sodium content diet query with details of the first column (a) being shown in a pop-up window when the mouse cursor hovers over the column.
Figure 41
Figure 41
A. Homepage of the RGD Pathway Portal showing the options of “Molecular Pathway Diagrams” (41-a) and “Molecular Pathway Suites and Suite Networks” (41-b), links that lead to the pathway diagrams homepage (41B). B. Pathway diagram homepage with links to all pathway diagrams in RGD, including “de novo pyrimidine biosynthetic pathway” (B-a).
Figure 42
Figure 42
The pathway diagram page for “de novo pyrimidine biosynthetic pathway” (PW:0000862).
Figure 43
Figure 43
Additional sections of the “de novo pyrimidine biosynthetic pathway” diagram page which appear below the diagram on the webpage. A. “Genes in Pathway”: A list of genes with annotations to the title term of the diagram and to child terms of the title pathway from the Pathway Ontology. B. “Additional Elements in Pathway” is a list of small molecules and a gene group. C. “Pathway Gene Annotations” is a list of disease terms associated with the genes involved in the diagrammed pathway. This list toggles between disease term to genes and gene to disease terms. D. A list of additional pathways with which the diagrammed pathway genes are involved. This list toggles between pathway term to genes and gene to pathway terms. E. A list of phenotype terms associated with the genes involved in the diagrammed pathway. This list toggles between phenotype term to genes and gene to phenotype terms.

References

    1. Aitman TJ, et al. 2008. Progress and prospects in rat genetics: a community view. Nat Genet 40(5):516–22. - PubMed
    1. Ashburner M, et al. 2000. Gene ontology: tool for the unification of biology. The Gene Ontology Consortium. Nat Genet 25(1):25–9. - PMC - PubMed
    1. Buels R, et al. 2016. JBrowse: a dynamic web platform for genome visualization and analysis. Genome Biol 17:66. - PMC - PubMed
    1. Howe K, et al. 2021. The genome sequence of the Norway rat, Rattus norvegicus Berkenhout 1769. Wellcome Open Res 6:118. - PMC - PubMed
    1. Kalbfleisch TS, et al. 2023. The Assembled Genome of the Stroke-Prone Spontaneously Hypertensive Rat. Hypertension 80(1):138–146. - PMC - PubMed

LinkOut - more resources