

The climatic risk of Amazonian protected areas is driven by climate velocity until 2050
- PMID: 37347789
- PMCID: PMC10286990
- DOI: 10.1371/journal.pone.0286457
The climatic risk of Amazonian protected areas is driven by climate velocity until 2050
Abstract
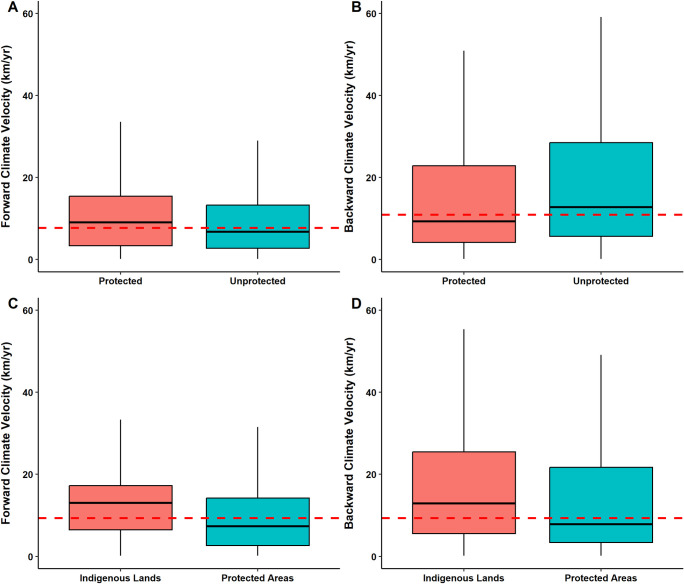
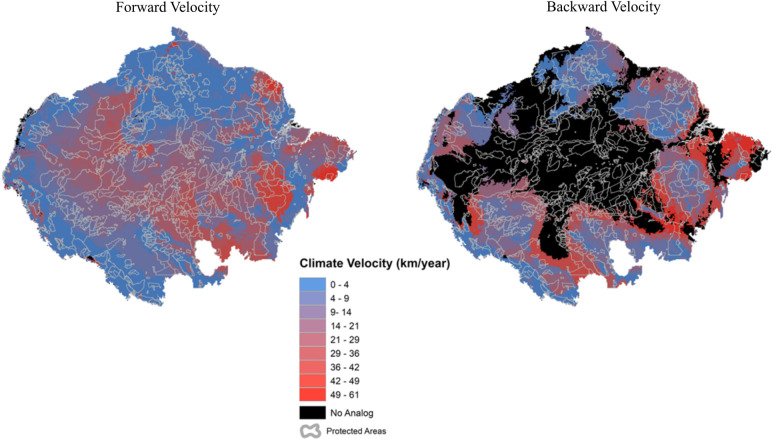
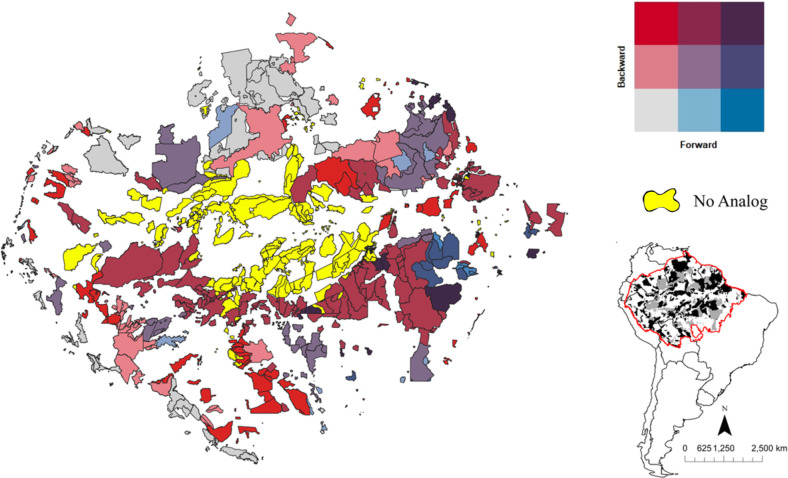
Changes in species distribution in response to climate change might challenge the territorial boundaries of protected areas. Amazonia is one of the global regions most at risk of developing long distances between current and future analogous climates and the emergence of climate conditions without analogs in the past. As a result, species present within the network of Protected Areas (PAs) of Amazonia may be threatened throughout the 21st century. In this study, we investigated climate velocity based on future and past climate-analogs using forward and backward directions in the network of PAs of Amazonia, in order to assess the climatic risk of these areas to climate change and verify their effectiveness in maintaining the current climate conditions. Using current (1970-2000) and future (2041-2060) average annual air temperature and precipitation data with a resolution of 10 km, climate velocities across the entire Amazon biome and average climate velocities of PAs and Indigenous Lands (ILs) were evaluated. The results show that the effects of backward velocity will be greater than that of forward velocity in the Amazon biome. However, the PA network will be less exposed to backward velocity impacts than unprotected areas (UAs)-emphasizing the importance of these areas as a conservation tool. In contrast, for the forward velocity impacts, the PA network will be slightly more exposed than UAs-indicating that the current spatial arrangement of the PA network is still not the most suitable to minimize impacts of a possible climate redistribution. In addition, a large extent of no-analog climates for backward velocities was found in central Amazonia, indicating that high temperatures and changes in precipitation patterns in this region will surpass the historical variability of the entire biome, making it a potentially isolated and unsuitable climatic envelope for species in the future. Most of the no-analog climates are in PAs, however the climate risks in ILs should also be highlighted since they presented higher climate velocities than PAs in both metrics. Our projections contrast with the median latitudinal migration rate of 2 km/year observed in most ecosystems and taxonomic groups studied so far and suggest the need for median migration rates of 7.6 km/year. Thus, despite the important role of PAs and ILs as conservation tools, they are not immune to the effects of climate change and new management strategies, specific to each area and that allow adaptation to global changes, will be necessary.
Copyright: © 2023 Torres-Amaral et al. This is an open access article distributed under the terms of the Creative Commons Attribution License, which permits unrestricted use, distribution, and reproduction in any medium, provided the original author and source are credited.
Conflict of interest statement
The authors have declared that no competing interests exist.
Figures
References
-
- Pecl G, Araujo MB, Bell JD, Blanchard J, Bonebrake TC, Pecl GT, et al. Biodiversity redistribution under climate change: Impacts on ecosystems and human well-being Publication Details. Science (80-) [Internet]. 2017;355(6332):1–9. Available from: http://ro.uow.edu.au/smhpapers/4629 - PubMed
-
- Balmford A, Bruner A, Cooper P, Costanza R, Farber S, Green RE, et al. Ecology: Economic reasons for conserving wild nature. Science (80-). 2002;297(5583):950–3. - PubMed
Publication types
MeSH terms
LinkOut - more resources
Full Text Sources
Research Materials
Miscellaneous
