. 2023 Jun 23;380(6651):1258-1265.
doi: 10.1126/science.adg8802. Epub 2023 Jun 22.

Perforin-2 is a pore-forming effector of endocytic escape in cross-presenting dendritic cells

Affiliations

Perforin-2 is a pore-forming effector of endocytic escape in cross-presenting dendritic cells

Pablo Rodríguez-Silvestre et al. Science. .

Abstract

During initiation of antiviral and antitumor T cell-mediated immune responses, dendritic cells (DCs) cross-present exogenous antigens on major histocompatibility complex (MHC) class I molecules. Cross-presentation relies on the unusual "leakiness" of endocytic compartments in DCs, whereby internalized proteins escape into the cytosol for proteasome-mediated generation of MHC I-binding peptides. Given that type 1 conventional DCs excel at cross-presentation, we searched for cell type-specific effectors of endocytic escape. We devised an assay suitable for genetic screening and identified a pore-forming protein, perforin-2 (Mpeg1), as a dedicated effector exclusive to cross-presenting cells. Perforin-2 was recruited to antigen-containing compartments, where it underwent maturation, releasing its pore-forming domain. Mpeg1-/- mice failed to efficiently prime CD8+ T cells to cell-associated antigens, revealing an important role for perforin-2 in cytosolic entry of antigens during cross-presentation.


Conflict of interest statement

Competing interests

The authors declare no competing interests.

Figures

Fig. 1
Fig. 1. Saporin-puromycin assay to monitor endocytic escape in DCs.
(A, B) Saporin-puromycin assay. (A) Schematic representation. Saporin-pulsed cells are labelled nascent puromycin to monitor translation rate. Puromycin incorporated into nascent peptides is detected with an αPuromycin Ab and flow cytometry. If saporin is retained within the endosomes, translation remains high. When saporin escapes into the cytosol it depurinates ribosomes inducing translation arrest. (B) Representative flow cytometry plot MutuDCs were incubated with 0.5 mg/ml of saporin followed by 0.01 mg/mL puromycin (purple histogram), with puromycin alone (yellow) or in media only (grey). Cells in translation arrest are denoted by the purple gate. See also fig. S1B. (C) Volcano plots showing the sgRNAs enrichment analysis for the saporin-puromycin endocytic escape screen. Each of the dots represents one targeted gene. Data represent the combined mean enrichment scores and the non-adjusted p values from three independent experiments (Fisher’s method). See also fig. S3. (D) Schematic representation of the different perforin-2 domains alongside structures of single subunit and hexadecameric perforin-2 in pre-pore (PDB ID: 6U2K and PDB ID: 6SB3) and pore-forming conformations (PDB ID: 6SB5). (E) Quantification of translation arrest in Mpeg1KO and NT MutuDCs. Cells were pulsed with saporin (11:1 unlabelled:Atto550-labelled saporin) for 2 h, and translation was monitored by a 30 min puromycin chase. The X axis represents Atto550 MFI normalised to the NT MutuDC Atto550 MFI at the highest saporin concentration. Data represent mean and SEM of three independent experiments, ns, not significant; *P<0.5; ** P<0.01; *** P<0.001; ****P<0.0001 using a multiple unpaired t-test (two-stage step-up, Benjamini, Krieger and Yekutieli). Significance symbols in the plot refer to the differences in proportion of cells in translation arrest. Differences in saporin Atto550 MFI were not significant. See also fig. S4A. (F) Mpeg1KO MutuDCs were reconstituted with the indicated Mpeg1 mutants or with mScarlet only and used in the saporin-puromycin assay with a 2 h pulse at 0.1 mg/ml saporin. Data are representative of three independent experiments. See also fig. S4C.
Fig. 2
Fig. 2. Perforin-2 is sufficient for endocytic escape of cargo in non-immune cells.
(A) HEK293Ts and Mpeg1-complemented HEK293Ts were pulsed with saporin (11:1 unlabelled:Atto550-labelled saporin) for 2 h, and translation was monitored by a 30 min puromycin chase. The x-axis represents Atto550 MFI normalised to the WT cells pulsed with 0.5 mg/ml saporin. Data represent mean and SEM of three independent experiments, ns, not significant; * P<0.5; **P<0.01; ***P<0.001’ ****P<0.0001 using a multiple t-test (Bonferroni-Dunn). Significance symbols on the plot refer to the differences in cells in translation arrest. Differences in saporin Atto550 MFI were not significant. (B) Cytosolic escape of β-lactamase in cells loaded with the CCF4 results in CCF4 cleavage, loss of FRET and shift in emission fluorescence. HeLas expressing either Mpeg1IRES-mScar let or mScarlet only were pulsed with β-lactamase for the indicated time. β-lactamase escape was monitored by measuring the shift in fluorescence emission by flow cytometry. Data represent mean and SEM of three independent experiments, ns, not significant, *P<0.5; **P<0.01; ***P<0.001; ****P<0.0001 using a multiple t-test (two-stage step-up, Benjamini, Krieger and Yekutieli) For gating strategy see fig. S6. (C) To monitor the escape of Tau oligomers, cells expressing NLS-eGFP-LargeBiT were pulsed with Tau-HiBit oligomers. The escape of Tau-HiBiT into the cytoplasm allows binding to the 18 kDA luciferase subunit, LgBiT. This results in reconstitution of catalytic activity and generation of luminescence. NLS-eGFP-LargeBiT HEK293Ts expressing either Mpeg1IRES-BFP or BFP-only were pulsed with tau-HiBiT for the indicated time. Following substrate addition, luminesce and cell viability were assessed. Relative luminescent units (RLUs) were then normalised to viability per well. Data represent mean and SEM of three independent experiments each with six technical replicates, ***P<0.001 using a paired t-test. (D) HEK293Ts were plated in the presence or absence of bleomycin and cultured in an Incucyte ® for 48 h to monitor the growth rate. Data represent mean and SEM of three independent experiments each with four wells per condition, ns, not significant; *P<0.5; **P<0.01; ***P<0.001; ****P<0.0001 using a multiple t-test (Bonferroni-Dunn).
Fig. 3
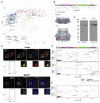
Fig. 3. Perforin-2 undergoes proteolytic cleavage releasing its pore forming domain into the organellar lumen.
(A, B) (A) Principal component analysis of mass spectrometry-based organellar mapping of MutuDCs (19) (see also fig. S7A). The maps were prepared from control MutuDCs and cells treated with drugs that promote lysosomal leakiness, prazosin and tamoxifen. Peptides derived from lysosomal and endosomal proteins are represented by filled and empty circles, respectively. The different colours indicate localisation of the protein within the corresponding organelle. Perforin-2 peptides are displayed as filled black circles regardless of their localisation. (B) Mapping of the different lysosomal and endosomal perforin-2 peptides detected by organellar mass spectrometry onto the different perforin-2 domains and structure. (C) Perforin-2 levels in NT MutuDCs treated with 0.5 μM BafA1 for 3 h were assessed by immunoblot under reducing conditions using the αMACPF and αC-terminal tail antibodies. (D) Confocal microscopy images of MutuDCs stained for perforin-2 with either αC-terminal tail or αMACPF antibodies (red), Vps35 (green) and lysotracker (blue). Data represent two independent experiments each with at least 80 cells, ***P<0.0001 using a Kolmogorov-Smirnov test. (E) BafA1 and CpG induced changes in the abundance of tryptic and semi-tryptic (cleaved) perforin-2 peptides. Control and treated cells (1 μM BafA1 or 1 μM CpG) were analysed by mass spectrometry, and peptide intensities were normalised to corresponding protein intensities. Statistical analysis was performed with a two-sided student’s t-test. P-values (y-axis) and fold change in abundance (line thickness) in treated vs control cells are shown. The amino acid position indicates the location of the peptides along the different perforin-2 domains. (F) Differences in the abundance of tryptic and semi-tryptic (cleaved) perforin-2 peptides between control and AEPKO MutuDCs (fig. S9B) by full proteome mass spectrometry. The analysis was performed as in (E).
Fig. 4
Fig. 4. Perforin-2 undergoes pH-dependent maturation in antigen-containing phagosomes.
(A) Schematic representation of the phagoFACS assay. Cells are pulsed with OVA-beads and allowed to internalise them. After an indicated chase period, non-internalised beads are marked with an α Ovalbumin antibody. Following cell homogenisation, phagosomes are stained with antibodies against ovalbumin coupled to an alternative fluorophore and phagosomal markers. (B) Mpeg1KO and NT MutuDCs were pulsed with OVA-beads and chased for the indicate time in the presence of either BFA or BafA1. Isolated phagosomes were stained with antibodies against Lamp1 and either the perforin-2 C-terminal tail (top panel) or MACPF domain (bottom panel). Data are representative of three independent experiments. See also fig. S11 for gating strategy, quantification, and additional plots.
Fig. 5
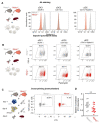
Fig. 5. Antigen cross-priming is impaired in vivo in the absence of perforin-2.
(A) Perforin-2 expression was assessed by intracellular staining with an αPerforin-2 antibody and flow cytometry in Mpeg1+/+ and Mpeg1-/- splenocytes. cDC1s are defined as Lineage (CD3, CD19, NK1.1)-, F4/80-, CD11C+, XCR1+), cDC2s as Lineage (CD3, CD19, NK1.1)-, F4/80-, CD11C+, CD172a+) and pDCs as Lineage (CD3, CD19, NK1.1)-, F4/80-, CD11cintSiglecH+. For gating strategies see fig. S13C. (B) CD11c+ magnetically enriched splenocytes from wild-type and Mpeg1-/- mice were pulsed with saporin for 2 h, and translation was monitored by a 30 min puromycin chase. cDC1s are defined as (CD11c+, XCR1+), cDC2s are defined as (CD11c+, CD172a+) and pDCs are defined as (CD11cintSiglecH+). Dot plots are representative of two independent experiments. For gating strategies see fig. S14E. (C, D) Wild-type and Mpeg1-/- mice were intravenously (i.v.) injected with 0.5x10⁶ CTV-labelled magnetically purified OT-I cells. One day later, mice were i.v. injected with 1x10⁶ UVC-irradiated (240mJ/cm2) 3T3 cells, coated with 10 mg/mL ovalbumin as antigen source and 0.5 mg/mL Poly(I:C) as an adjuvant. Three days later, OT-I proliferation was assessed by flow cytometry (C). OT-I are defined as Lineage (CD19, F4/80, CD11c)-, CD3+, CD4-CD8+, TCRvβ5.1, 5.2+TCRvα2+, CTV+. For gating strategy see fig. S15A. (D) Normalised OT-I counts three days after i.v. antigen injection. Each dot corresponds to an individual mouse, with three to five mice per group. For each experiment, OT-I counts per 1x10⁶ splenocytes were normalised to the average of wild-type controls. Data represent five independent experiments, ns, not significant; **P<0.01 using an unpaired t-test.

References

    1. Palmowski MJ, Gileadi U, Salio M, Gallimore A, Millrain M, James E, Addey C, Scott D, Dyson J, Simpson E, Cerundolo V. Role of Immunoproteasomes in Cross-Presentation. J Immunol. 2006;177:983–990. - PubMed
    1. Helft J, Manicassamy B, Guermonprez P, Hashimoto D, Silvin A, Agudo J, Brown BD, Schmolke M, Miller JC, Leboeuf M, Murphy KM, et al. Cross-presenting CD103+ dendritic cells are protected from influenza virus infection. J Clin Invest. 2012;122:4037–4047. - PMC - PubMed
    1. Theisen DJ, Davidson JT, Briseño CG, Gargaro M, Lauron EJ, Wang Q, Desai P, Durai V, Bagadia P, Brickner JR, Beatty WL, et al. WDFY4 is required for crosspresentation in response to viral and tumor antigens. Science. 2018;362:694–699. - PMC - PubMed
    1. Giampazolias E, Schulz O, Lim KHJ, Rogers NC, Chakravarty P, Srinivasan N, Gordon O, Cardoso A, Buck MD, Poirier EZ, Canton J, et al. Secreted gelsolin inhibits DNGR-1-dependent cross-presentation and cancer immunity. Cell. 2021;184:4016–4031.:e22. - PMC - PubMed
    1. Kovacsovics-Bankowski M, Rock KL. A Phagosome-to-Cytosol Pathway for Exogenous Antigens Presented on MHC Class I Molecules. Science. 1995;267:243–246. - PubMed