. 2023 Jun 23;380(6651):1270-1275.
doi: 10.1126/science.adf9725. Epub 2023 Jun 22.

Wide-field fluorescence lifetime imaging of neuron spiking and subthreshold activity in vivo

Affiliations

Wide-field fluorescence lifetime imaging of neuron spiking and subthreshold activity in vivo

Adam J Bowman et al. Science. .

Abstract

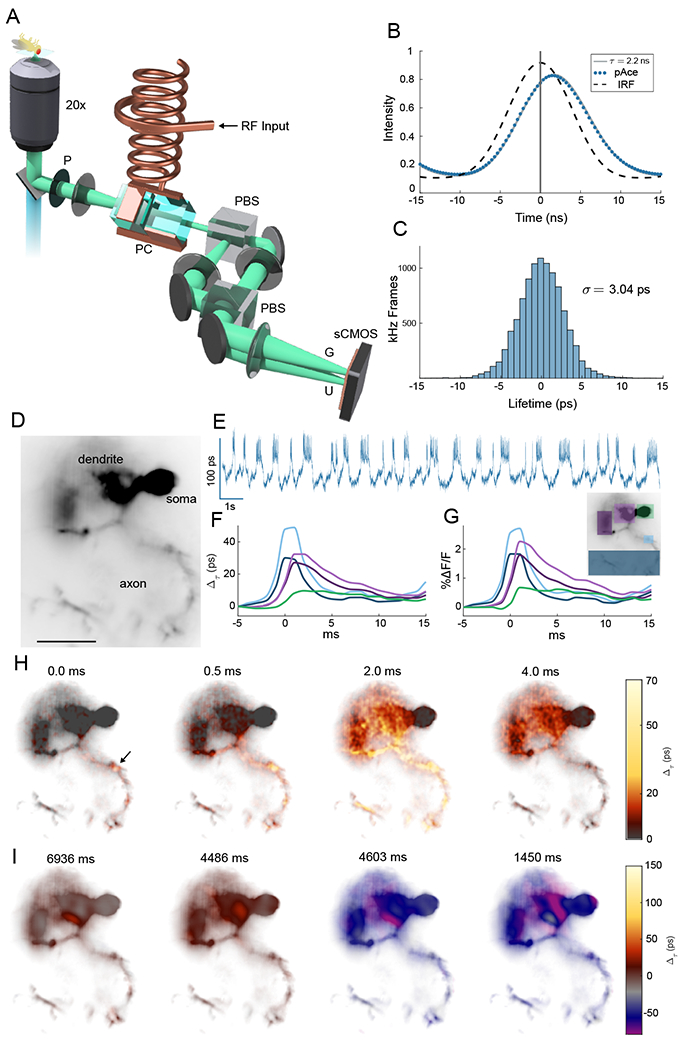
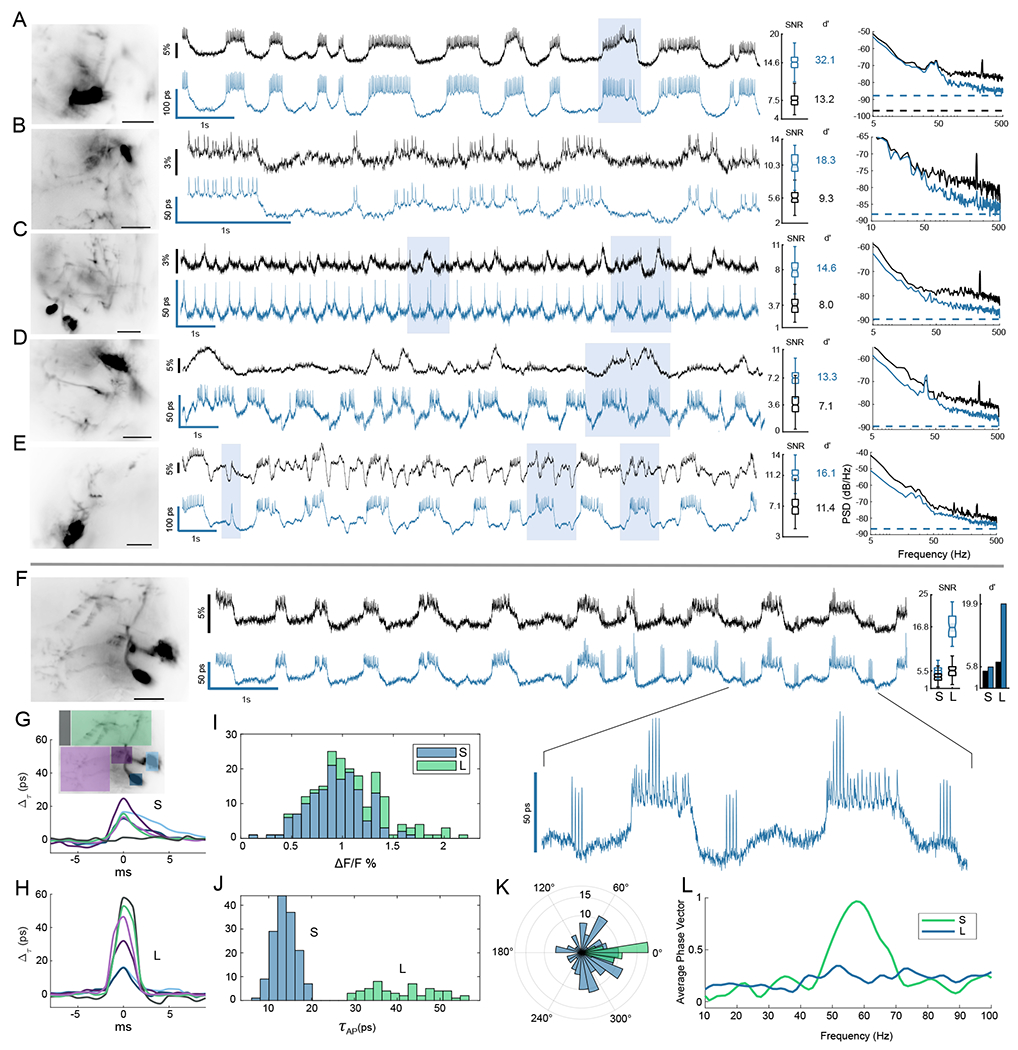
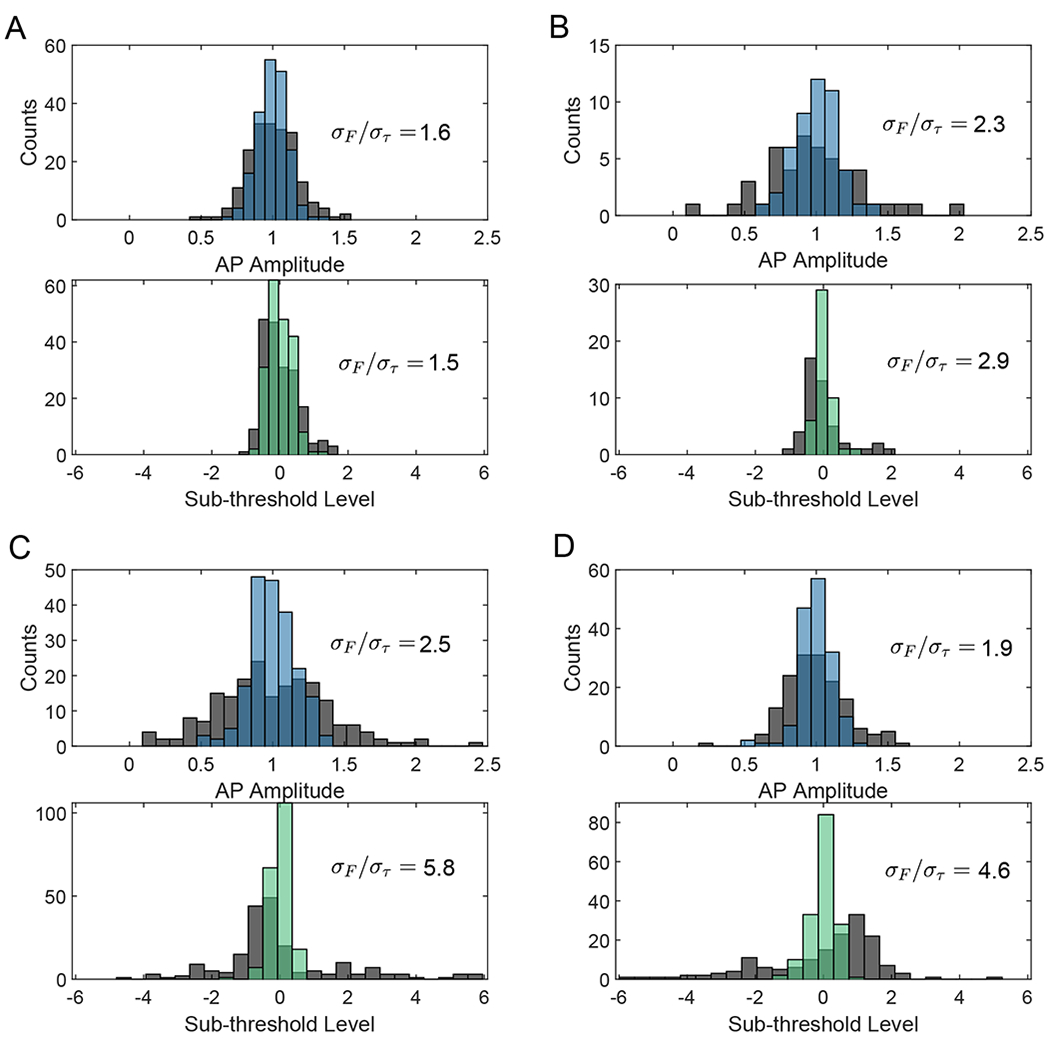
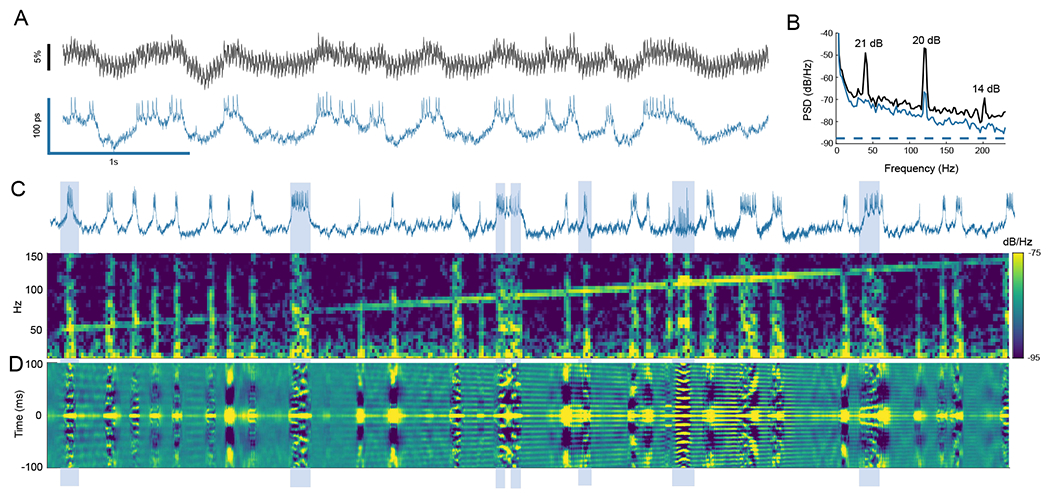
The development of voltage-sensitive fluorescent probes suggests fluorescence lifetime as a promising readout for electrical activity in biological systems. Existing approaches fail to achieve the speed and sensitivity required for voltage imaging in neuroscience applications. We demonstrated that wide-field electro-optic fluorescence lifetime imaging microscopy (EO-FLIM) allows lifetime imaging at kilohertz frame-acquisition rates, spatially resolving action potential propagation and subthreshold neural activity in live adult Drosophila. Lifetime resolutions of <5 picoseconds at 1 kilohertz were achieved for single-cell voltage recordings. Lifetime readout is limited by photon shot noise, and the method provides strong rejection of motion artifacts and technical noise sources. Recordings revealed local transmembrane depolarizations, two types of spikes with distinct fluorescence lifetimes, and phase locking of spikes to an external mechanical stimulus.


Conflict of interest statement

Competing Interests: A.B. and M.K. are inventors on PCT/US2019/062640, US17/153438, and US17/898093.

Figures

Fig. 1.
Fig. 1.. Lifetime imaging of action potentials
(A) Schematic of EO-FLIM microscope. Wide-field fluorescence images were modulated by a Pockels cell (PC) placed between crossed polarizers (P and PBS) and driven at 20 MHz by a high voltage resonant transformer. Two spatially offset output images were simultaneously captured after a second polarizing beamsplitter (PBS) on a sCMOS camera, corresponding to gated (G) and ungated (U) intensities. (B) Instrument response function (IRF) and fluorescence traces for the U channel were measured by varying the Pockels cell drive phase relative to the excitation laser. The pAce GEVI was fit to 2.2 ns lifetime. For kilohertz imaging, a single optimal phase point was captured (vertical line at 0 ns delay) and the G/U image intensity ratio was converted to a lifetime estimate (see also Fig. S1). (C) Histogram of measurements (highpass filtered) obtained at 1 kHz for a single neuron in vivo demonstrate a lifetime sensitivity of 3 ps (full trace in Fig. 2(A)) (D) Wide-field image of a neuron with structures indicated (scalebar 25 μm) (E) Whole cell lifetime trace resolves action potentials and sub-threshold transitions (F, G) Average spike shape is plotted in intensity and lifetime from color-coded regions (H) Frames from an interpolated lifetime movie demonstrate spike propagation, averaging the signal from ~300 individual spikes. The point of initiation is indicated by the arrow, and bidirectional propagation was observed both along the axon and backwards towards soma and dendrites (see Movies S1–S3). Spike propagation was also imaged directly without averaging in Movies S4 and S5. (I) Applying a 10 frame moving average allowed sub-threshold signals to be localized to neuron structures in Movies S6 and S7. Example frames demonstrate localization in the dendrite for both positive and negative sub-threshold signals.
Fig. 2.
Fig. 2.. Lifetime suppresses intensity noise and improves fidelity of sub-threshold recording.
Six example MBON neurons are shown comparing lifetime (blue) to ΔF/F intensity recordings (black). Recordings were obtained by averaging over high-resolution images shown at left (scalebar 25 μm). Shaded boxes highlight some notable regions of the traces for improved lifetime readout. For each example, the distributions of spike SNR are compared for intensity and lifetime, with calculated spike detection fidelity d′ indicated. (A,B) Two examples of flies without motion demonstrate improvement of technical noise floor at high frequencies by up to 7 dB. The noise power spectra for the traces are compared at right, with dotted lines indicating the photon shot noise limits (C-E) Three examples of flies having low-frequency noise associated with motion artifacts. Lifetime improves noise power spectrum across temporal frequencies, rejecting intensity noise by up to 9 dB at low frequencies. See also further analysis in Fig. 3. (F-J) Lifetime provided an improved readout of two spike amplitudes in response to mechanical stimulus at 60 Hz. Large (L) spikes showed an enhanced lifetime responsivity and tripled detection SNR and d′ over the small (S) spikes. L spikes occured independent of sub-threshold waveform level but synchronized with spiking on plateaus in the inset. (G,H) Average spike waveforms for color-coded regions. The point of initiation for S spikes was a central region of the axon (consistent with Movies S1 and S2), while L spikes were diffuse and associated with background fluorescence. L spikes also correspond to local spikes in the dendrite and soma in (H). L spike background component possibly resulted from out of focus neurons (Movies S8 and S9). (I,J) Histograms of action potential amplitudes are compared. In intensity the L and S populations were not resolved and strongly overlap, but they were clearly separated in lifetime. Using lifetime to identify the spikes, the intensity histogram (I) is shaded with two colors to show overlapping populations. (K) A polar histogram demonstrates strong phase locking of the L spikes to mechanical stimulus using a bandpass filtered lifetime trace as phase reference. S spikes do not show phase locking. (L) The average phase vector length Σi cos(θi)/NAP is plotted vs. bandpass center frequency to show narrow-band locking response.
Fig. 3.
Fig. 3.. Lifetime improves uniformity in action potential amplitude and threshold level.
Histograms of action potential amplitudes (lifetime in blue) and action potential levels on the sub-threshold waveform (lifetime in green) are plotted for each activity trace, overlayed on the same histograms for intensity (grey). Action potential amplitudes are normalized to the mean. Sub-threshold level is also mean normalized as (LL_)/L_ where L is the spike’s corresponding level on a low-pass filtered trace, and its distance is measured relative to the mean level of all other spikes L_. A perfectly uniform threshold would thus result in L = 0 for all spikes. In each histogram, the ratio of standard deviation between intensity and lifetime readouts σFτ is given as a figure of merit for uniformity. Panes (A, B-D) correspond to panes (A, C-E) in Fig. 2 respectively.
Fig. 4.
Fig. 4.. Phase locking of spikes to direct mechanical stimulus
(A) Lifetime provided strong rejection of intensity noise associated with shaking the sample (40 Hz square wave, ~ 0.8 μm peak-to-peak). (B) Intensity noise at the stimulus frequency and second harmonic were attenuated by 21 and 20 dB. (C) A spectrogram of the lifetime trace is plotted as stimulus is swept from 50 to 150 Hz. Vertical lines of activity in the spectrogram correspond to spike bursts in the lifetime trace. Mechanical cross-talk is seen as the diagonal line sweep, and phase locking appears as increased frequency content at the stimulus frequency during spike bursts. (D) To show phase locking visually, a sliding window autocorrelation of the lifetime trace is plotted using a 150 ms window. Phase locking may be seen by observing alignment of autocorrelation peaks during activity bursts to the peaks resulting from mechanical cross-talk signal. Examples of bursts showing phase locking are highlighted.

References

    1. Kim TH, Schnitzer MJ, Cell 185, 9–41 (2022). - PMC - PubMed
    1. Ahrens MB, Orger MB, Robson DN, Li JM, Keller PJ, Nature Methods 10, 413–420 (2013). - PubMed
    1. Kannan M, et al., Science 378, eabm8797 (2022). - PMC - PubMed
    1. Tian H, et al., 10.1101/2021.11.22.469481v1 (2021). - DOI
    1. Piatkevich KD, et al., Nature 574, 413–417 (2019). - PMC - PubMed

Substances

LinkOut - more resources