. 2023 Jul 21;18(7):1564-1581.
doi: 10.1021/acschembio.3c00194. Epub 2023 Jun 22.

CES1 Releases Oxylipins from Oxidized Triacylglycerol (oxTAG) and Regulates Macrophage oxTAG/TAG Accumulation and PGE2/IL-1β Production

Affiliations

CES1 Releases Oxylipins from Oxidized Triacylglycerol (oxTAG) and Regulates Macrophage oxTAG/TAG Accumulation and PGE2/IL-1β Production

Maggie E Phillips et al. ACS Chem Biol. .

Abstract

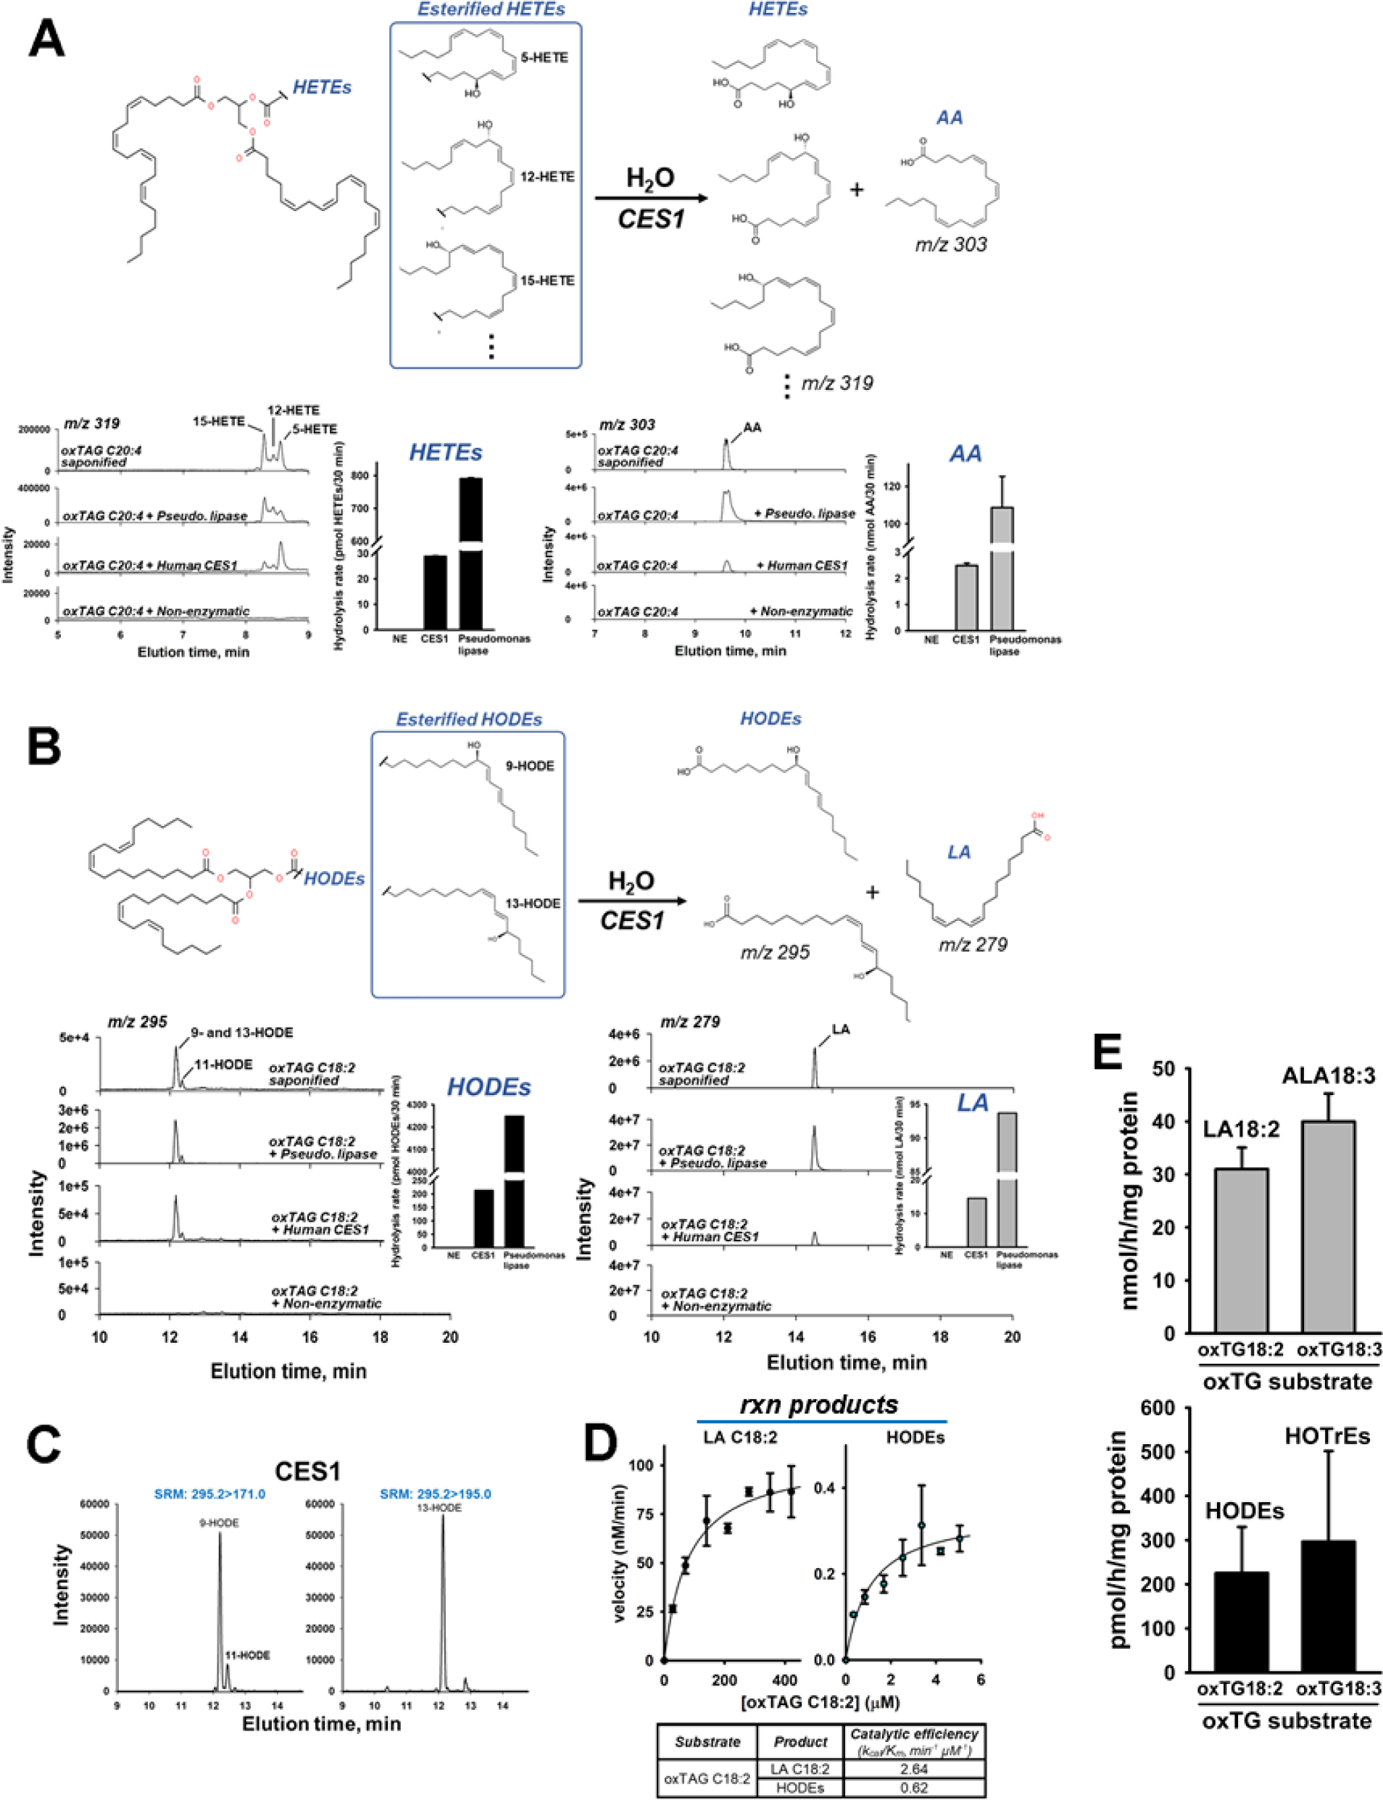
Triacylglycerols (TAGs) are storage forms of fat, primarily found in cytoplasmic lipid droplets in cells. TAGs are broken down to their component free fatty acids by lipolytic enzymes when fuel reserves are required. However, polyunsaturated fatty acid (PUFA)-containing TAGs are susceptible to nonenzymatic oxidation reactions, leading to the formation of oxylipins that are esterified to the glycerol backbone (termed oxTAGs). Human carboxylesterase 1 (CES1) is a member of the serine hydrolase superfamily and defined by its ability to catalyze the hydrolysis of carboxyl ester bonds in both toxicants and lipids. CES1 is a bona fide TAG hydrolase, but it is unclear which specific fatty acids are preferentially released during lipolysis. To better understand the biochemical function of CES1 in immune cells, such as macrophages, its substrate selectivity when it encounters oxidized PUFAs in TAG lipid droplets requires study. We sought to identify those esterified oxidized fatty acids liberated from oxTAGs by CES1 because their release can activate signaling pathways that enforce the development of lipid-driven inflammation. Gaining this knowledge will help fill data gaps that exist between CES1 and the lipid-sensing nuclear receptors, PPARγ and LXRα, which are important drivers of lipid metabolism and inflammation in macrophages. Oxidized forms of triarachidonoylglycerol (oxTAG20:4) or trilinoleoylglycerol (oxTAG18:2), which contain physiologically relevant levels of oxidized PUFAs (<5 mol %), were incubated with recombinant CES1 to release oxylipins and nonoxidized arachidonic acid (AA) or linoleic acid (LA). CES1 hydrolyzed each oxTAG, yielding regioisomers of hydroxyeicosatetraenoic acids (5-, 11-, 12-, and 15-HETE) and hydroxyoctadecadienoic acids (9- and 13-HODE). Furthermore, human THP-1 macrophages with deficient CES1 levels exhibited a differential response to extracellular stimuli (oxTAGs, lipopolysaccharide, and 15-HETE) as compared to those with normal CES1 levels, including enhanced oxTAG/TAG lipid accumulation and altered cytokine and prostaglandin E2 profiles. This study suggests that CES1 can metabolize oxTAG lipids to release oxylipins and PUFAs, and it further specifies the substrate selectivity of CES1 in the metabolism of bioactive lipid mediators. We suggest that the accumulation of oxTAGs/TAGs within lipid droplets that arise due to CES1 deficiency enforces an inflammatory phenotype in macrophages.


Figures

Figure 1.
Figure 1.
Synthesis and chemical characterization of oxTAGs. (A) Chemical scheme describing the partial oxidation of TAG 20:4 by FeSO4, followed by reduction of the resulting lipid hydroperoxides by triphenylphosphine to give several esterified regioisomers of hydroxyeicosatetraenoic acids (HETEs). (B,C) LC-MS of the oxTAG mixture was performed on an Orbitrap Exploris. Extracted ion chromatograms (EICs) and MS1 mass spectra for non-oxidized TAG 20:4 (tR, 21.27 min) and oxTAG20:4 (15-, 11-, 12-, and 5-HETEs; tR, 17.93–18.62 min) are shown in (B) and (C), respectively. The MS1 spectrum shows the [M+NH4]+ ion and its expected C13 isomer distribution. A lesser amount of [M+Na]+ ion of TAG 20:4 is also detected in (B). The results indicated that only one arachidonoyl chain in each oxTAG molecule was oxidized (5 mol%, which is a physiologically relevant level of oxidation). The oxTAG C20:4 structure shown in (C) depicts an esterified 15-HETE group attached at the sn-1(3) position. The distribution and abundance of HETE products was confirmed by saponification of the oxTAG preparation and subsequent analysis of free HETE molecules by LC-MS/MS (Fig. 2A). oxTAG18:2 and oxTAG18:3 mixtures containing esterified hydroxyoctadecadienoic acid (HODEs) and HOTrEs, respectively, were prepared in a similar way. These synthetically oxidized TAG substrates were used to determine the substrate-specificity of recombinant human CES1.
Figure 2.
Figure 2.
Release of oxylipins from oxTAGs by human recombinant CES1 enzyme. (A) Hydrolysis of oxTAG20:4 (containing HETEs) by CES1. LC-MS chromatograms (single-quadrupole MS) indicated that CES1 preferentially releases 5-HETE from the oxidized substrate. (B) Hydrolysis of oxTAG C18:2 (containing HODEs) by CES1. 9- and 13-HODE elute as one peak by LC-MS; however, LC-MS/MS (triple-quadrupole MS) – using distinct SRMs for each HODE – indicated that approximately equal amounts of each oxylipin was released by enzymatic hydrolysis (C). A smaller amount of 11-HODE was also detected in the SRM 295>171 chromatogram. Bar graphs in (A,B) depict CES1- and Pseudomonas lipase-catalyzed oxTAG hydrolysis rates; significantly more oxylipin and non-oxidized PUFA was released from oxTAG18:2 than from oxTAG20:4 by CES1 (~7-fold more). (D) Substrate-velocity graphs for the hydrolytic conversion of oxTAG18:2 to the products LA18:2 and HODEs (sum of 9-, 11-, and 13-HODE produced). The concentration of esterified HODE in the oxTAG18:2 substrate is <5mol% of the esterified LA18:2 concentration. Catalytic efficiencies for the CES1-catalyzed release of LA18:2 and HODEs are depicted. The efficiency of hydrolytic release of LA C18:2 was ~4-fold greater than that of the HODEs. (E) CES1-catalyzed conversion rates for oxTAG18:2 and oxTAG18:3 to free fatty acids (LA18:2 and ALA18:3, top) and hydroxylated fatty acids (HODEs and HOTrEs, bottom). Data represents mean ± SD (n=3). Cumulative amounts of HETEs, HODEs, and HOTrEs were determined. NE, non-enzymatic; Pseudomonas lipase, positive control.
Figure 3.
Figure 3.
Metabolism of exogenous oxTAG20:4 by wildtype mouse lung membrane proteomes in the absence and presence of serine hydrolase inhibitors. The levels of AA (20:4), 15-HETE, 12-HETE, and 5-HETE in the presence of the inhibitors MAFP (A), Orlistat (B), and WWL229 (C) were determined by LC-MS/MS. All HETEs: indicates the cumulative amount of 15-HETE, 12-HETE, and 5-HETE. Data represents mean ± SD (n=3). * p<0.05, ** p<0.01, *** p<0.001.
Figure 4.
Figure 4.
Metabolism of exogenous oxTAGs 18:2, 18:3, and 20:4 by wildtype and Ces1d-/- mouse lung membrane proteomes. (A) Chemical scheme describing the hydrolysis of the oxTAG18:2 releasing 9- and 13-HODE and LA (18:2). Chromatographic SRM peaks for 9-HODE (295>171) and 13-HODE (295>195) are shown. (B) Gel-based activity-based protein profiling (ABPP) of wildtype (WT) and Ces1d-/- (Ces1dKO) female lung membrane proteomes (n=4 mice/genotype). Ces1d is the major serine hydrolase protein detected in WT lung membrane proteome. Hydrolysis activities of WT and Ces1d-/- lung proteomes toward (C) oxTAG18:2, (D) oxTAG18:3, and (E) oxTAG20:4. Data represents mean ± SD (n=3). * p<0.05, ** p<0.01; ns, not significant.
Figure 5.
Figure 5.
oxTAG treatment increases IL1b mRNA expression in THP-1 macrophages. (A) Macrophages were treated with increasing concentrations of oxTAGs (oxTAG20:4 or oxTAG18:2) or their non-oxidized counterparts (TAG20:4 or TAG18:2) for 24 h. IL1b mRNA levels were quantified by RT-qPCR. (B) Control and CES1KD macrophages were treated with either oxTAG18:2 (50 µM) or vehicle for 24 h followed by IL1b, CD36, and FABP4 mRNA quantitation. (C) Each cell type was treated with LPS (1 µg/mL), followed 3 h later by either oxTAG18:2 (50 µM) or vehicle without changing the media. IL1b and FABP4 mRNA were quantified. Data represents mean ± SD (n=3). * p<0.05, ** p<0.01, *** p<0.001.
Figure 6.
Figure 6.
CES1KD macrophages exhibit a proinflammatory phenotype compared to control macrophages. (A) Experimental protocol describing treatment of control and CES1KD cells with oxTAG18:2. (B) Proinflammatory gene expression (RT-qPCR) following oxTAG18:2 or vehicle treatments. (C) Proinflammatory gene expression (RT-qPCR) in control and CES1KD cells before (Mo, monocyte) and after differentiation (Mac, macrophage) using PMA. (D) IL-1β protein levels in cell supernatants after differentiation of control and CES1KD cells. (E) Experimental protocol describing treatment of macrophages with LPS for indicated amounts of time. Time course of PGE2 levels (F) and IL-1β protein levels (G) in cell supernatants. (H) Exogenous PGE2 was added to THP-1 macrophages at the indicated concentrations and its stability in the media determined over 24 h. (I) RT-qPCR of PTGS2, PTGS1, and PTGES3 after LPS treatment of control and CES1KD macrophages (1 µg/mL, 0–24 h). (J) Expression of inflammasome components in macrophages under resting conditions as determined by RNA-seq. Data represents mean ± SD (n=3–4). * p<0.05, ** p<0.01, *** p<0.001 (panels A-I); * padj<0.05 (panel J).
Figure 7.
Figure 7.
CES1KD macrophages accumulate more TAGs than control macrophages. (A) Levels of total TAGs were quantified after a 2.5-d differentiation protocol using PMA. LC-HRMS (sum of major species, see Supplementary Table 3) and colorimetric assays provided complementary approaches to measure bulk TAG levels. (B) Total TAGs after an LPS challenge (1 µg/mL, 18 h) as measured by LC-HRMS. (C-E) Lipidomic analysis of cellular extracts indicated an increase in specific TAG species, such as TG(10:0_14:0_16:0), which were identified using LipidSearch. (C) Extracted ion chromatograms of TG(10:0_14:0_16:0) from control and CES1KD lipid extracts. (D) MS1 and MS2 spectra of the ammoniated adduct of TG(10:0_14:0_16:0). Product ions provide confirmation of the fatty acyl groups in the TAG. NL, neutral loss. (E) Quantitation of EIC peak areas in (C) demonstrates a significantly higher level of TG(10:0_14:0_16:0) in CES1KD cells compared to control cells. (F) Neutral lipids and nuclei in macrophages were labeled with BODIPY493/503 and DAPI, respectively, and examined by confocal microscopy. The mean number of lipid droplets/cell were quantified using Image J software. (G) RT-qPCR of PLIN2 and PLIN3 mRNA in macrophages under baseline conditions and after treatment with palmitic acid (PA, 0.5 mM, 16 h). Data in each panel represents mean ± SD (n=3–4). * p<0.05, ** p<0.01, *** p<0.001.
Figure 8.
Figure 8.
Time-course study of 15-HETE metabolism in control and CES1KD macrophages. Concentrations of 15-HETE (A) and tetranor metabolites of 15-HETE (B) in the cell supernatants (extracellular space). (C) Concentrations of 15-HETE in the intracellular space following saponification of lipid extracts. (D) Pathway describing the β-oxidation of 15-HETE to tetranor metabolites. The chemical structures that are colored red were detected by LC-HRMS analysis and their amounts were added together to quantify the total tetranors of 15-HETE. Data represents mean ± SD (n=3). * p<0.05, ** p<0.01, *** p<0.001.
Figure 9.
Figure 9.
Incorporation of 15-HETE into cellular lipids. (A) Experimental protocol describing the treatment of macrophages with exogenous 15-HETE. (B) Levels of AA- and HETE-containing phospholipids (PLs) – PE(18:0/20:4)/PC(16:0/20:4) and PE(18:0/20:4+O)/PC(16:0/20:4+O) – in lipid extracts. Supplementary Table 1 detail the SRMs for analysis. (C) Levels of AA- and HETE-containing TAGs in lipid extracts. Supplementary Table 2 detail the SRMs. A comparison of SRM chromatograms (914.7807>577.5190) for the HETE-containing TAG designated TG(54:5)+O in control and CES1 macrophages is shown in (A); this SRM is due to the neutral loss of 15-HETE+NH3. Note that TG(54:5)+O and TG(52:4)+O are only detected in the 15-HETE-treated cells. Because of the targeted approach used to detect AA- and HETE-containing TAGs, the identity of the other fatty acyl chains in each TAG was not determined. Supplementary Figure 5 contains the full chromatograms for each TAG and PL species analyzed. (D) TAG biosynthetic and catabolic pathway genes in control and CES1KD macrophages under baseline conditions as measured by RNA-seq. Log2(FPKM+1) values for each replicate were center normalized across each gene (z-score) and the z-scores visualized on a heat map. Data represents the mean ± SD (panels A-C: n=3, *** p<0.001; panel D: n=4, *** padj<0.001, log2FC≥±1).
Figure 10.
Figure 10.
Scheme describing the metabolic fate of 15-HETE in macrophages including its metabolism to tetranors in peroxisomes and incorporation into oxTAG (HETE-containing TAGs). CES1 is a hydrolytic enzyme that, in addition to releasing unoxidized fatty acids (FAs), might regulate the cellular levels of oxylipins that are sequestered within oxTAGs. ACSL, fatty acyl-CoA synthase (or ligase); CoA, coenzyme A; DGAT, diacylglycerol acyltransferase; 15-HETE, 15-hydroxyeicosatetraenoic acid; MGAT, monoacylglycerol acyltransferase.

References

    1. Wang D; Zou L; Jin Q; Hou J; Ge G; Yang L Human Carboxylesterases: A Comprehensive Review. Acta Pharm. Sin. B 2018, 8 (5), 699–712. 10.1016/J.APSB.2018.05.005. - DOI - PMC - PubMed
    1. Lian J; Nelson R; Lehner R Carboxylesterases in Lipid Metabolism: From Mouse to Human. Protein Cell 2018, 9 (2), 178–195. 10.1007/s13238-017-0437-z. - DOI - PMC - PubMed
    1. Ross MK; Streit TM; Herring KL Carboxylesterases: Dual Roles in Lipid and Pesticide Metabolism. J. Pestic. Sci 2010, 35 (3), 257–264. 10.1584/jpestics.R10-07. - DOI - PMC - PubMed
    1. Ross MK; Crow JA Human Carboxylesterases and Their Role in Xenobiotic and Endobiotic Metabolism. J. Biochem. Mol. Toxicol. 2007, 21 (4), 187–196. 10.1002/JBT.20178. - DOI - PubMed
    1. Li G; Li X; Yang L; Wang S; Dai Y; Fekry B; Veillon L; Tan L; Berdeaux R; Eckel-Mahan K; Lorenzi PL; Zhao Z; Lehner R; Sun K Adipose Tissue-Specific Ablation of Ces1d Causes Metabolic Dysregulation in Mice. Life Sci. Alliance 2022, 5 (8). 10.26508/LSA.202101209. - DOI - PMC - PubMed

Publication types

LinkOut - more resources