. 2023 Aug 9;224(4):iyad116.
doi: 10.1093/genetics/iyad116.

The effects of inversion polymorphisms on patterns of neutral genetic diversity

Affiliations

The effects of inversion polymorphisms on patterns of neutral genetic diversity

Brian Charlesworth. Genetics. .

Abstract

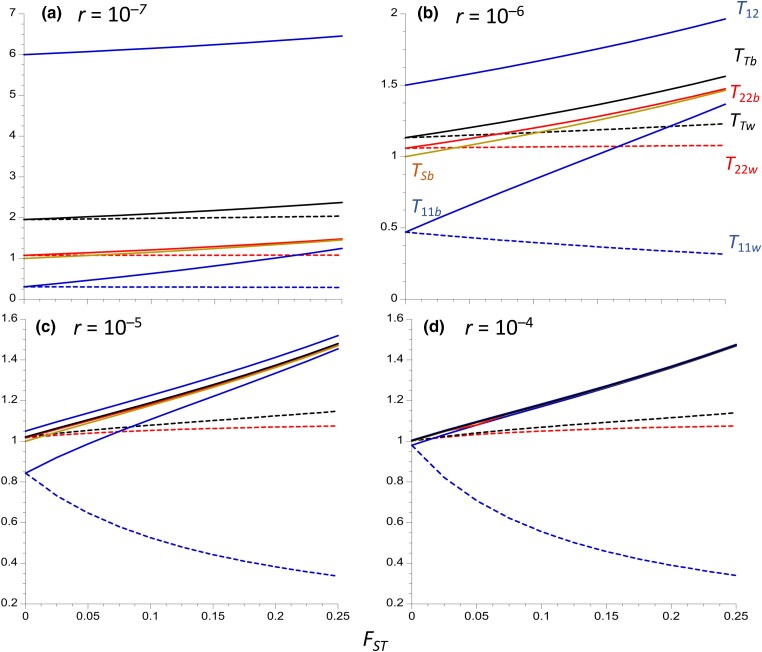
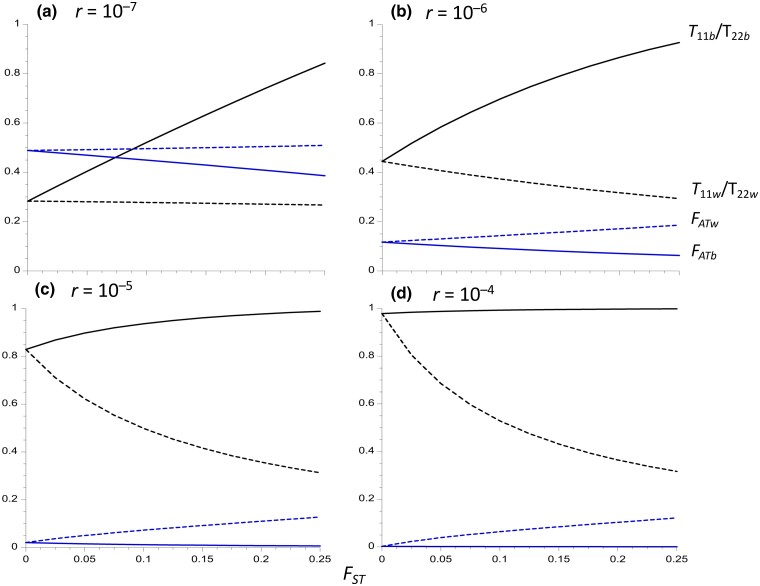
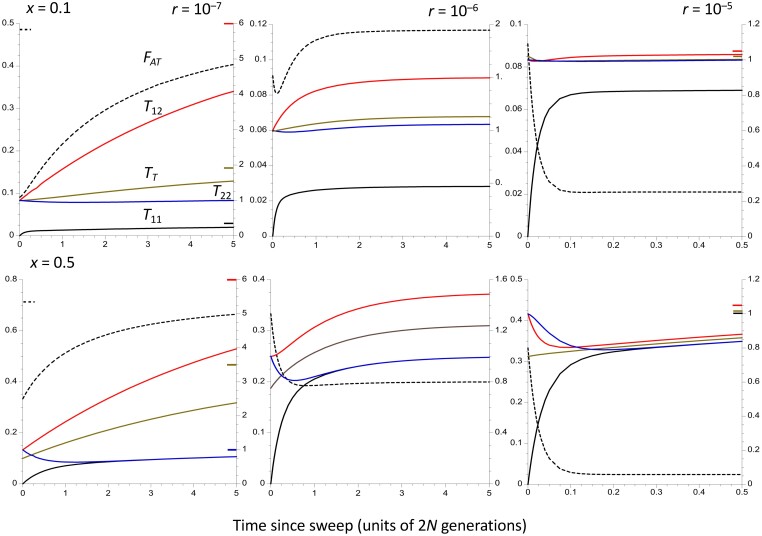
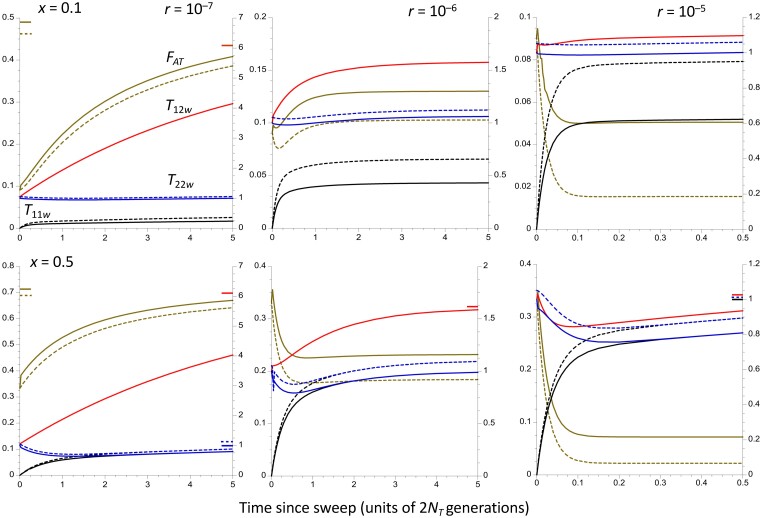
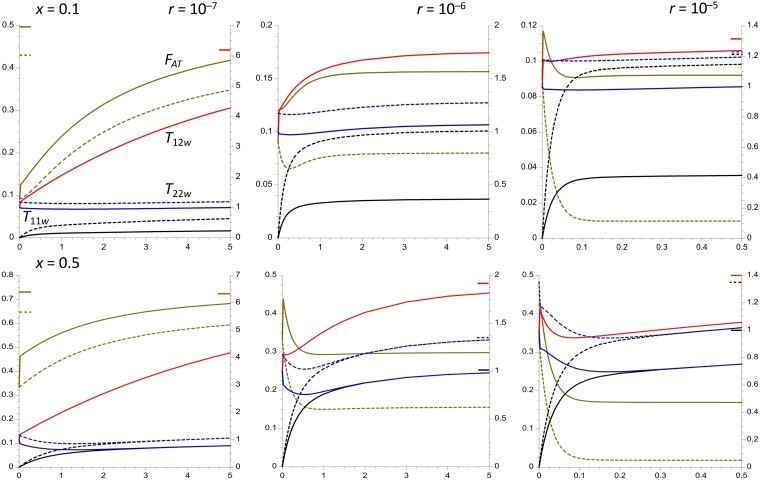
The strong reduction in the frequency of recombination in heterozygotes for an inversion and a standard gene arrangement causes the arrangements to become partially isolated genetically, resulting in sequence divergence between them and changes in the levels of neutral variability at nucleotide sites within each arrangement class. Previous theoretical studies on the effects of inversions on neutral variability have assumed either that the population is panmictic or that it is divided into 2 populations subject to divergent selection. Here, the theory is extended to a model of an arbitrary number of demes connected by migration, using a finite island model with the inversion present at the same frequency in all demes. Recursion relations for mean pairwise coalescent times are used to obtain simple approximate expressions for diversity and divergence statistics for an inversion polymorphism at equilibrium under recombination and drift, and for the approach to equilibrium following the sweep of an inversion to a stable intermediate frequency. The effects of an inversion polymorphism on patterns of linkage disequilibrium are also examined. The reduction in effective recombination rate caused by population subdivision can have significant effects on these statistics. The theoretical results are discussed in relation to population genomic data on inversion polymorphisms, with an emphasis on Drosophila melanogaster. Methods are proposed for testing whether or not inversions are close to recombination-drift equilibrium, and for estimating the rate of recombinational exchange in heterozygotes for inversions; difficulties involved in estimating the ages of inversions are also discussed.

Keywords: genetic diversity; inversion polymorphisms; population subdivision; recombination rate; sequence divergence.


Conflict of interest statement

Conflicts of interest statement The author declares no conflict of interest.

Figures

Fig. 1.
Fig. 1.
Equilibrium expected coalescence times (relative to 2NT) for an inversion polymorphism where the inversion is maintained at a constant frequency of 0.1. Four different recombination rates in heterokaryotypes (r) are modeled, as indicated at the top left of each panel. An island model of population structure is assumed, with 200 demes and a total population size of NT = 106, so that individual demes have a population size of N = 5,000. The X axis is the equilibrium FST for neutral sites unlinked to the inversion. Subscripts 1 and 2 denote alleles sampled from the inversion and standard arrangement, respectively; subscripts w and b denote alleles sampled from the same and from separate demes, respectively; subscript T denotes pairs of alleles sampled without regard to karyotype. The dashed curves represent within-deme coalescent times, and the solid curves are between-deme coalescent times; blue is T12 and T11, black is TT, blue is T11, and red is T22 (for T12, there is no significant difference between with- and between-deme values.) The mean within-karyotype values for between-deme samples (TSb) is the solid beige curve; the within-deme equivalent (TSw) is equal to 1 for all r and FST values and is not displayed.
Fig. 2.
Fig. 2.
Equilibrium values of FATw (blue dashed curves), FATb (blue solid curves), T11w/T22w (black dashed curves), and T11b/T22b (black solid curves), for an inversion polymorphism where the inversion is maintained at a constant frequency of 0.1. The population and recombination parameters in Fig. 1 are used.
Fig. 3.
Fig. 3.
The trajectories of change in the population statistics for the case of a panmictic population of size n = 106, assuming that the time taken to approach the equilibrium inversion frequency is negligible compared with the coalescent time of 2N generations. The X axes display times in units of coalescent time following the sweep to equilibrium. Three different recombination rates in heterokaryotypes are shown, as well as 2 different frequencies of the inversion (0.1 in the upper panels and 0.5 in the lower panels). The dashed curves are FAT, whose values are displayed on the left-hand Y axes. The solid curves are mean coalescent times, measured relative to 2N (right-hand Y axes); red is T12, brown is TT, black is T11, and blue is T22. For the highest rate of recombination (r = 10–5), only the first N generations are shown, in order to capture the rapid changes at the start of the process. The colored bars inside the Y axes indicate the equilibrium values of the corresponding statistics, for cases when these are substantially different from the final values of the statistics.
Fig. 4.
Fig. 4.
The trajectories of change in the population statistics for the case of a subdivided (island model) population of total size NT = 106, with 200 demes of size N = 500 and an FST = 0.05 (4Nm = 19) for neutral sites independent of the inversion. It is assumed that the time taken to approach the equilibrium inversion frequency is negligible compared with the coalescent time of 2NT generations. The X axes display times in units of coalescent time following the sweep to equilibrium. Three different recombination rates in heterokaryotypes are shown, as well as 2 different frequencies of the inversion (0.1 in the upper panels and 0.5 in the lower panels). The solid curves represent within-population statistics, and the dashed curves are between-population statistics. The values of FATw and FATb (brown curves) are given by the left-hand Y axes. The other curves are mean coalescent times, measured relative to 2NT; red is T12w (T12b behaves almost identically, except for its higher initial value and slower rate of increase when the time since the sweep is <0.005); black is T11 and blue is T22 (right-hand Y axes). For the highest rate of recombination (r = 10–5), only the first NT generations are shown. The colored bars inside the Y axes indicate the equilibrium values of the corresponding statistics, for cases when these are substantially different from the final values of the statistics.
Fig. 5.
Fig. 5.
This is the same as Fig. 4, except that FST = 0.15 (4Nm = 5.67).

Similar articles

Cited by

References

    1. Andolfatto P, Depaulis F, Navarro A. Inversion polymorphisms and nucleotide variability in Drosophila. Genet Res. 2001;77(1):1–8. doi:10.1017/S0016672301004955. - DOI - PubMed
    1. Andolfatto P, Wall JD, Kreitman M. Unusual haplotype structure at the proximal breakpoint of In(2L)t in a natural population of Drosophila melanogaster. Genetics. 1999;153(3):1297–1311. doi:10.1093/genetics/153.3.1297. - DOI - PMC - PubMed
    1. Assaf ZJ, Tilk S, Park J, Siegal ML, Petrov DA. Deep sequencing of natural and experimental populations of Drosophila melanogaster reveals biases in the spectrum of new mutations. Genome Res. 2017;27(12):1988–2000. doi:10.1101/gr.219956.116. - DOI - PMC - PubMed
    1. Aulard S, David JR, Lemeunier F JR. Chromosomal inversion polymorphism in Afrotropical populations of Drosophila melanogaster. Genet Res. 2002;79(1):49–63. doi:10.1017/S0016672301005407. - DOI - PubMed
    1. Bartolomé C, Charlesworth B. Rates and patterns of chromosomal evolution in Drosophila pseudoobscura and D. miranda. Genetics. 2006;173(2):779–791. doi:10.1534/genetics.105.054585. - DOI - PMC - PubMed

LinkOut - more resources