. 2023 Aug:585:164-178.
doi: 10.1016/j.virol.2023.05.007. Epub 2023 Jun 13.

Host ranges of Sf-rhabdoviruses harbored by lepidopteran insects and insect cell lines

Affiliations

Host ranges of Sf-rhabdoviruses harbored by lepidopteran insects and insect cell lines

Mark T Menghini et al. Virology. 2023 Aug.

Abstract

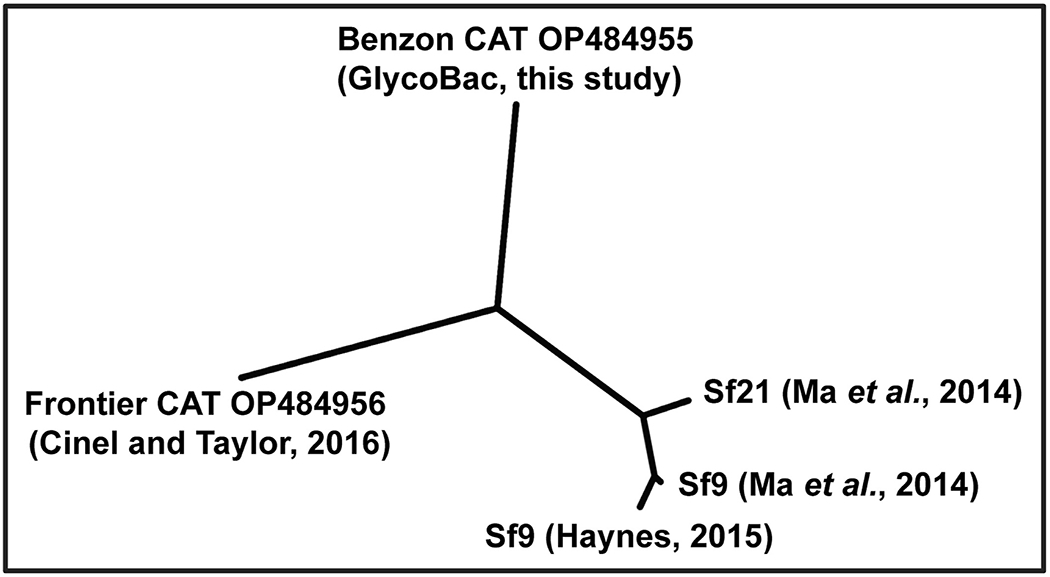
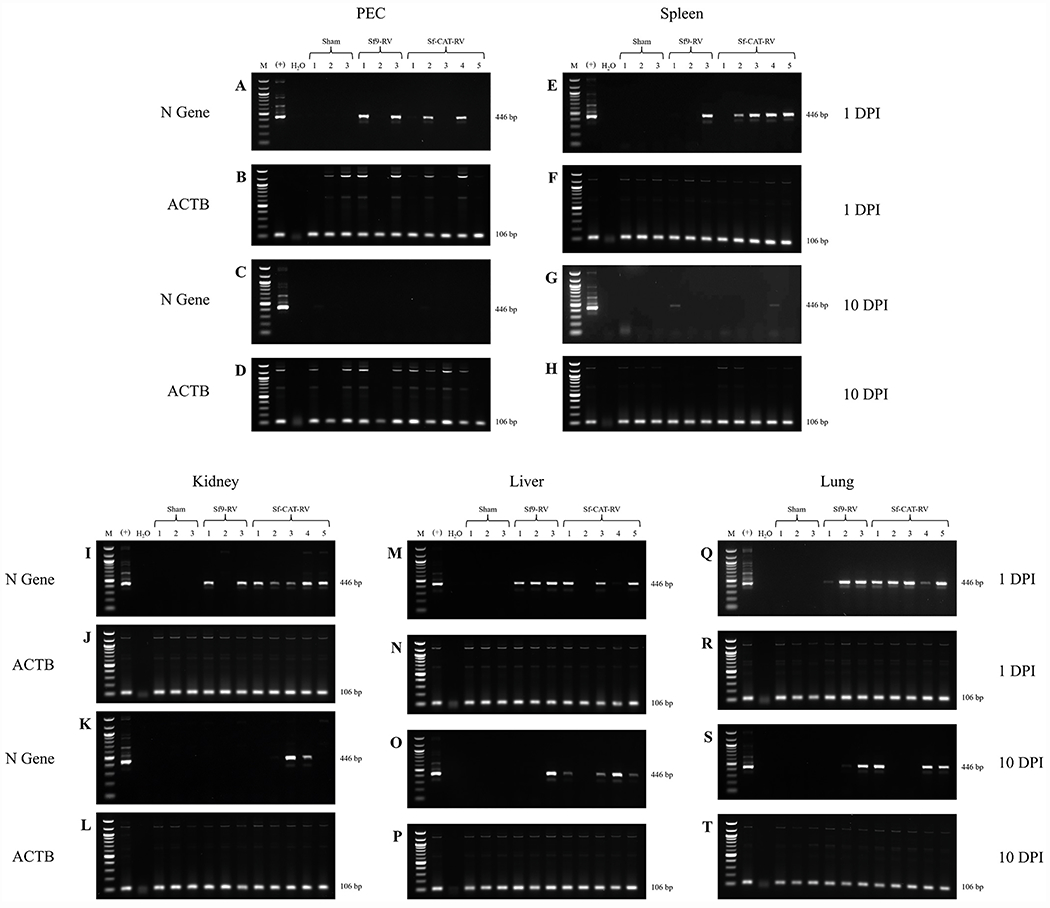
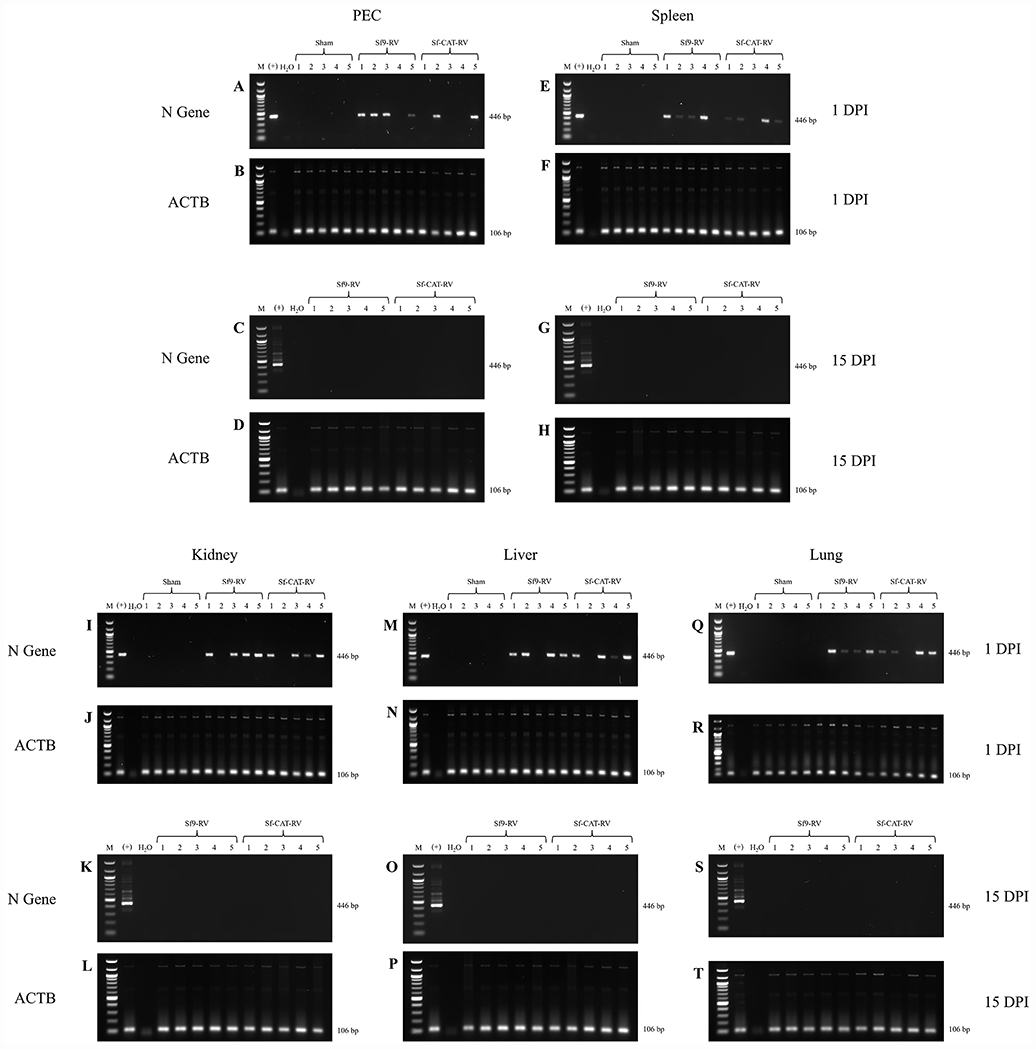
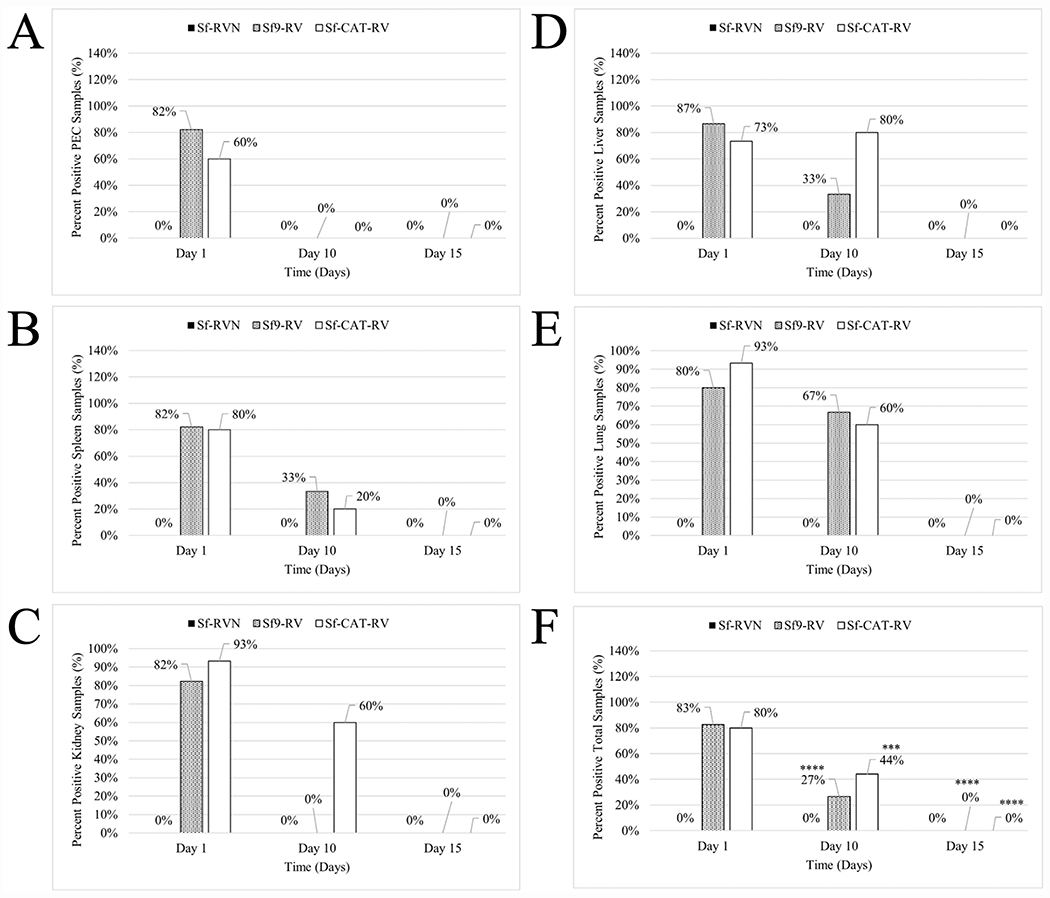
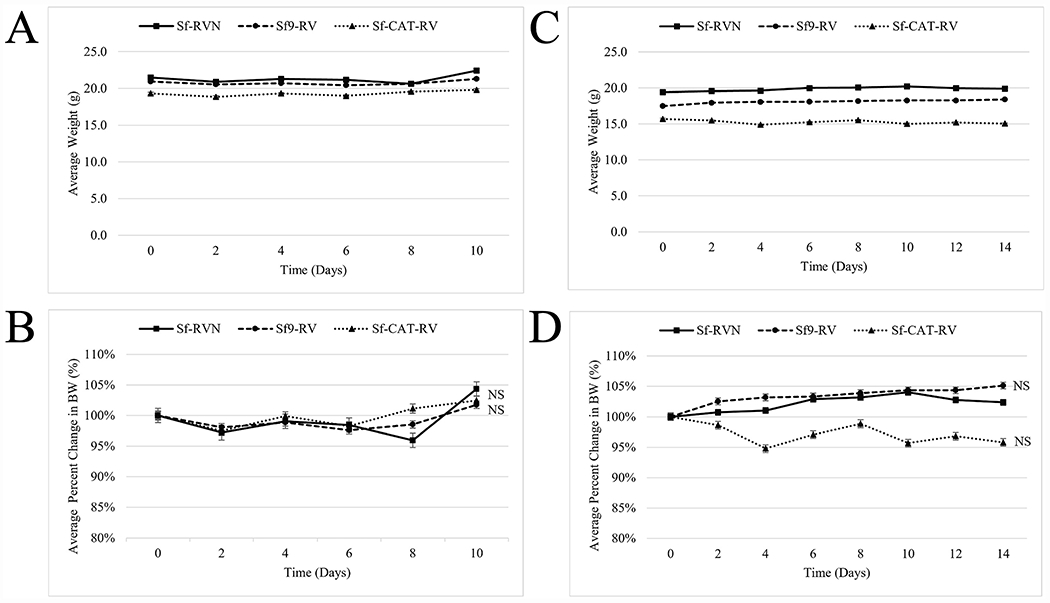
Cell lines derived from Spodoptera frugiperda (Sf), which are the most widely used hosts in the baculovirus-insect cell system, are contaminated with Sf-rhabdoviruses (Sf-RVs). In this study, we identified a closely related virus (Sf-CAT-RV) in the caterpillar species used to isolate the original Sf cell line. We then evaluated the Sf-RV and Sf-CAT-RV host ranges, found Sf-CAT-RV could infect Vero cells, and obtained results suggesting both variants can infect mouse ear fibroblasts. In addition, we found both variants could establish pantropic infections in severely immunocompromised (RAG2/IL2RG-/-) mice. However, both variants were cleared by two weeks post-inoculation and neither produced any symptoms or obvious adverse outcomes in these hosts. We conclude the caterpillars used to isolate Sf21 cells were the most likely source of the Sf-RV contaminant, Sf-RVs and their Sf-CAT-RV progenitor have broader host ranges than expected from previous work, but neither variant poses a serious threat to human health.

Keywords: Adventitious viral contamination; Baculovirus-insect cell expression system; Biosafety; Insect cell lines; Sf-rhabdovirus.


Conflict of interest statement

Declaration of competing interest The authors declare that they have no known competing financial interests or personal relationships that could have appeared to influence the work reported in this paper.

Figures

Fig. 1.
Fig. 1.
Phylogenetic relationships between Sf cell line- and caterpillar-derived rhabdoviruses. Vector NTI was used to compare the genomic sequences of Sf9 cell- (Haynes, 2015; Ma et al., 2014) and Sf21 cell- (Ma et al., 2014) derived Sf-RVs and the Frontier (GenBank Acc #OP484955; this study) and Benzon (GenBank Acc #OP484955; this study) caterpillar-derived Sf-CAT-RVs. PHYLIP was then used to produce the unrooted dendogram shown in the Figure, as described in Materials and Methods.
Fig. 2.
Fig. 2.
Infectivity of Benzon Sf-CAT-RV for Sf-RVN cells. Benzon Sf-CAT-RV was isolated from caterpillars, blind-passaged once through Sf-RVN cells, and samples of the resulting cell-free media (CFM) were filtered and tested by the two-step RT-PCR assay (see Table 2) for negative-stranded, N-specific RNAs (CAT), as described in Materials and Methods. Samples of this validated crude virus preparation were inoculated onto a fresh Sf-RVN or S2 cell culture as a negative control. Another culture was mock-inoculated in parallel with CFM from uninfected Sf-RVN cells as an additional negative control. The inoculated Sf-RVN cultures were sub-cultured every three days and samples were taken at various times from 24 h to P20 PI. Samples were only taken from the negative control cultures at 24 h PI. Total cellular RNAs were extracted from each sample, assayed for the presence of negative stranded, Sf-RV N-specific RNAs using the two-step RT-PCR assay (see Table 2), and the genomic, negative-stranded viral RNA amplification products were analyzed by agarose gel electrophoresis with ethidium bromide staining, as described in Materials and Methods.
Fig. 3.
Fig. 3.
Infectivity of Sf-RV and Sf-CAT-RV for primate cell lines. CFM from Sf9 (A, E) or Sf-RVN-CAT-RV cells (B, C, D, F) were inoculated onto WI-38 (A-D) or Vero (E, F) cell cultures, and then the cultures were passaged every three days and samples were taken at various times from 24 h to P20 PI. Total RNA was prepared from each sample and tested for the presence of negative-stranded N-specific RNAs using the two-step RT-PCR followed by nested PCR assay (see Table 2). The genomic, negative-stranded viral RNA amplification products were analyzed by agarose gel electrophoresis with ethidium bromide staining, as described in Materials and Methods. Samples of the homologous inocula (+, Sf9, CAT) were used as positive controls. Two step RT-PCR followed by nested PCR assays on total RNAs from uninfected WI-38 cells (Un), mock-infected Vero cells (Mock), Drosophila S2 cells at 72 h PI with Sf-RV- or Sf-CAT-RV, and no RNA template (H2O) in the primary two-step RT-PCRs were used as negative controls.
Fig. 4
Fig. 4
Infectivity of Sf-RV and Sf-CAT-RV for MEFs. CFM from Sf-RVN (A, lanes 1), Sf9 (A, lanes 2 and Panel B) or Sf-RVN-CAT-RV (A, lanes 3 and Panel C) cells were inoculated onto MEF cultures, and then the cultures were passaged once a week and samples were taken at various times PI. Total RNA was prepared from each sample and tested for the presence of negative-stranded N-specific RNAs using one-step RT-PCR followed by nested PCR assays (see Table 2). The genomic, negative-stranded viral RNA products obtained after the primary one-step RT-PCRs followed by nested PCR assays were analyzed by agarose gel electrophoresis with ethidium bromide staining, as described in Materials and Methods. One-step RT-PCR followed by nested PCR assays performed with water no RNA templates (H2O) in the primary one-step RT-PCRs were used as additional negative controls.
Fig. 5
Fig. 5
Sf-RV and Sf-CAT-RV infectivity for RAG2/IL2RG−/− mice from 1- to 10-days PI. Total RNAs were isolated from PECs (A, B, C, D), spleens (E, F, G, H), kidneys (I, J, K, L), livers (M, N, O, P), or lungs (Q, R, S, T) harvested from sham (Sf-RVN-), Sf-RV-, or Sf-CAT-RV-inoculated mice at 1- (A, B, E, F, I, J, M, N, Q, R) or 10- (C, D, G, H, K, L, O, P, S, T) days PI. Samples were then assayed for viral N-specific (A, C, E, G, I, K, M, O, Q, S) or endogenous murine ACTB-specific (B, D, F, H, J, L, N, P, R, T) RNAs using one-step RT-PCR followed by nested PCR or one-step RT-PCR with no nested PCR assays (see Table 2), respectively, as described in Materials and Methods. The resulting viral N-specific or ACTB-specific amplification products were analyzed by agarose gel electrophoresis with ethidium bromide staining, as described in Materials and Methods. The expected sizes of the Sf-RV N and mACTB amplification products were 446 bp and 106 bp, respectively.
Fig. 6
Fig. 6
Sf-RV and Sf-CAT-RV infectivity for RAG2/IL2RG−/− mice from 1- to 15-days PI. Total RNAs were isolated from PECs (A, B, C, D), spleens (E, F, G, H), kidneys (I, J, K, L), livers (M, N, O, P), or lungs (Q, R, S, T) harvested from sham (Sf-RVN-), Sf-RV-, or Sf-CAT-RV-inoculated mice at 1- (A, B, E, F, I, J, M, N, Q, R) or 15- (C, D, G, H, K, L, O, P, S, T) days PI. Samples were then assayed for viral N-specific (A, C, E, G, I, K, M, O, Q, S) or endogenous murine ACTB-specific (B, D, F, H, J, L, N, P, R, T) RNAs using one-step RT-PCR followed by nested PCR or one-step RT-PCR with no nested PCR assays (see Table 2), respectively, as described in Materials and Methods. The resulting viral N-specific or ACTB-specific amplification products were analyzed by agarose gel electrophoresis with ethidium bromide staining, as described in Materials and Methods. The expected sizes of the viral N- and mACTB-specific amplification products were 446 bp and 106 bp, respectively.
Fig. 7
Fig. 7
Summary of virus-host interactions. Overall summary of the viral N-specific nested PCR assay results obtained using organs isolated at 1-, 10-, and/or 15-days PI from sham- (Sf-RVN; black bars), Sf9-RV- (white bars), and Sf-CAT-RV- (gray bars) inoculated mice in three independent experiments. The bar graphs document the percentages of mice in each cohort positive for viral N-specific RNAs in PECs (A), spleens (B), kidneys (C), Livers (D), and lungs (E), as well as the total percentages of positive organs observed at 1-, 10,- and 15-days PI with p-values determined using the Two-Sample Proportion Z-score Test (F), as described in Materials and Methods (*** = P ≤ 0.001; **** = P ≤ 0.0001).
Fig. 8
Fig. 8
Impact of viral infections on mouse body weights. Sham Sf-RVN- (squares), Sf9-RV- (circles), and Sf-CAT-RV- (triangles) inoculated mice were weighed every other day and the average weights (A, C) and changes in body weight (B, D) over the course of the 10- (ME#2; A, B) or 15- (ME#3; C, D) day experiments are shown as a function of days PI.

Similar articles

Cited by

References

    1. Bautista-Hernández LA, Gómez-Olivares JL, Buentello-Volante B, Bautista-de Lucio VM 2017. Fibroblasts: The unknown sentinels eliciting immune responses against microorganisms. Eur. J. Microbiol. Immunol 7:151–157. doi: 10.1556/1886.2017.00009. - DOI - PMC - PubMed
    1. Cinel SD and Taylor SJ 2019. Prolonged bat call exposure induces a broad transcriptional response in the male fall armyworm (Spodoptera frugiperda; Lepidoptera: Noctuidae) brain. Front. Behav. Neurosci 13:36. doi: 10.3389/fnbeh.2019.00036. - DOI - PMC - PubMed
    1. Felberbaum RS, 2015. The baculovirus expression vector system: A commercial manufacturing platform for viral vaccines and gene therapy vectors. Biotechnol. J 10, 702–714. - PMC - PubMed
    1. Food and Drug Administration, 2010. Guidance for Industry - Characterization and Qualification of Cell Substrates and Other Biological Materials Used in the Production of Viral Vaccines for Infectious Disease Indications, in: Research, C.f.B.E.a (Ed.). Office of Communication, Outreach and Development, Rockville, MD.
    1. Garcia S, DiSanto J, Stockinger B, 1999. Following the development of a CD4 T cell response in vivo: from activation to memory formation. Immunity 11, 163–171. - PubMed

Publication types

LinkOut - more resources