. 2023 Aug:64:102786.
doi: 10.1016/j.redox.2023.102786. Epub 2023 Jun 15.

Metformin inhibits methylglyoxal-induced retinal pigment epithelial cell death and retinopathy via AMPK-dependent mechanisms: Reversing mitochondrial dysfunction and upregulating glyoxalase 1

Affiliations

Metformin inhibits methylglyoxal-induced retinal pigment epithelial cell death and retinopathy via AMPK-dependent mechanisms: Reversing mitochondrial dysfunction and upregulating glyoxalase 1

Ponarulselvam Sekar et al. Redox Biol. 2023 Aug.

Abstract

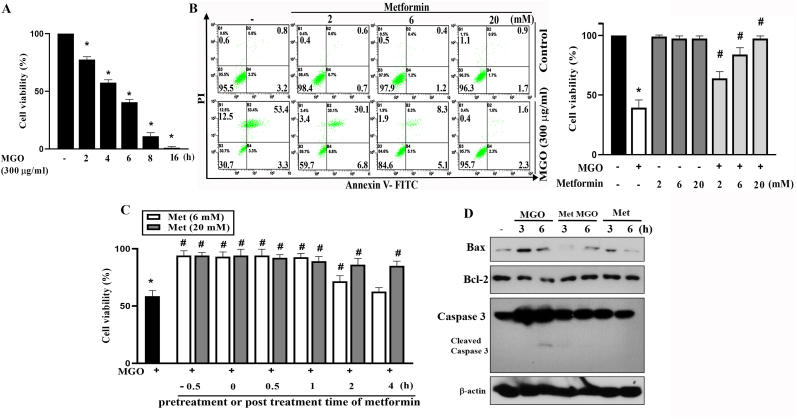
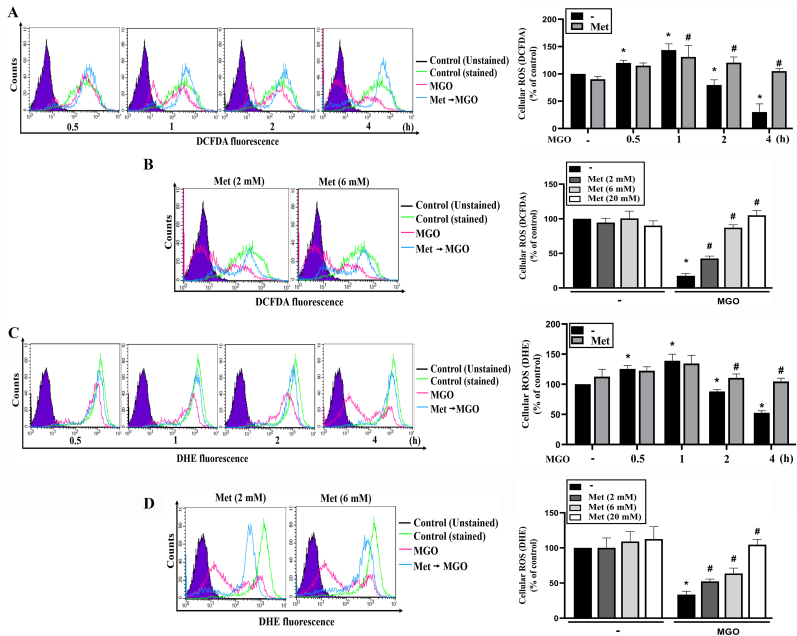
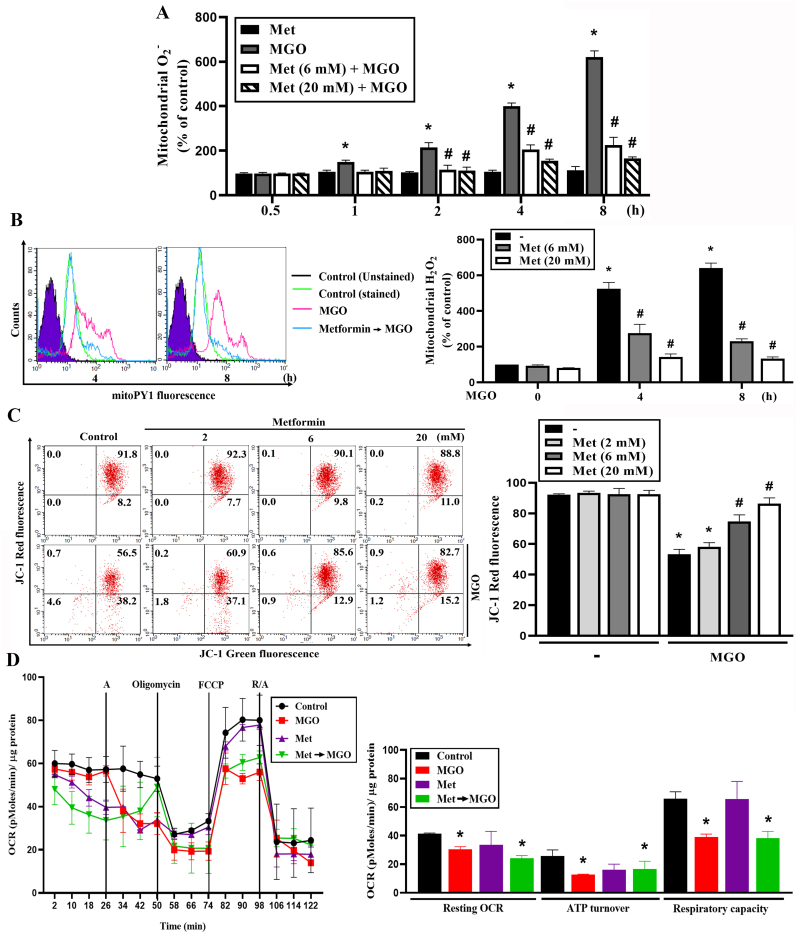
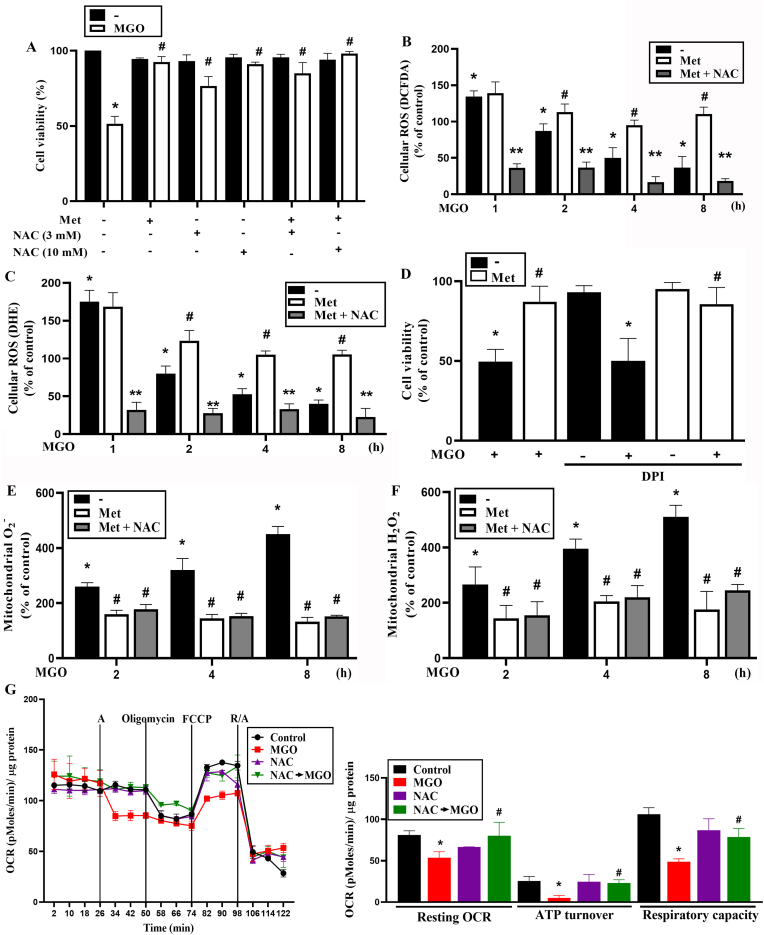
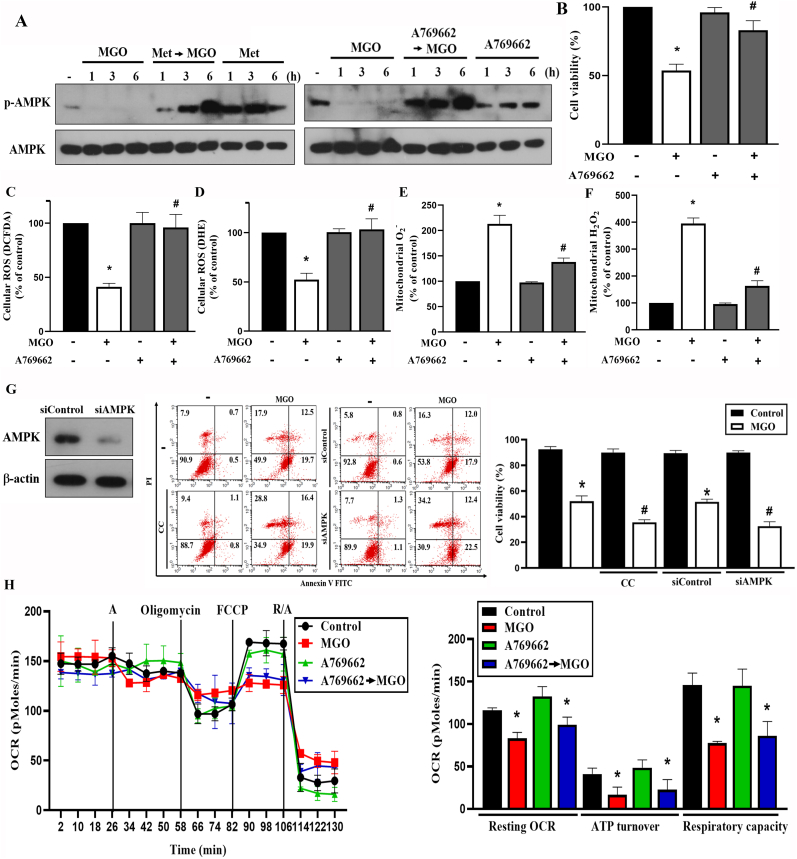
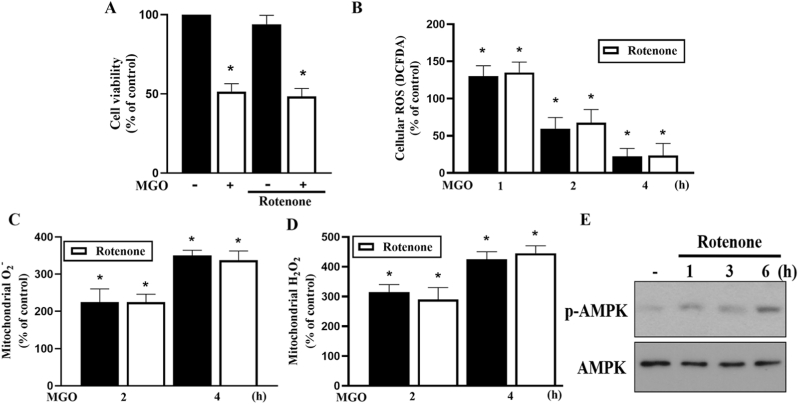
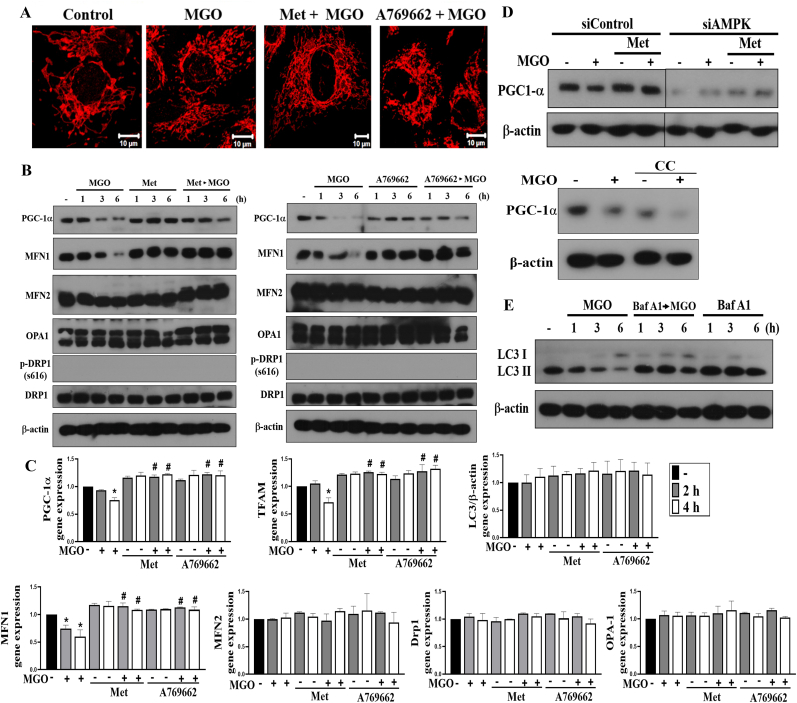
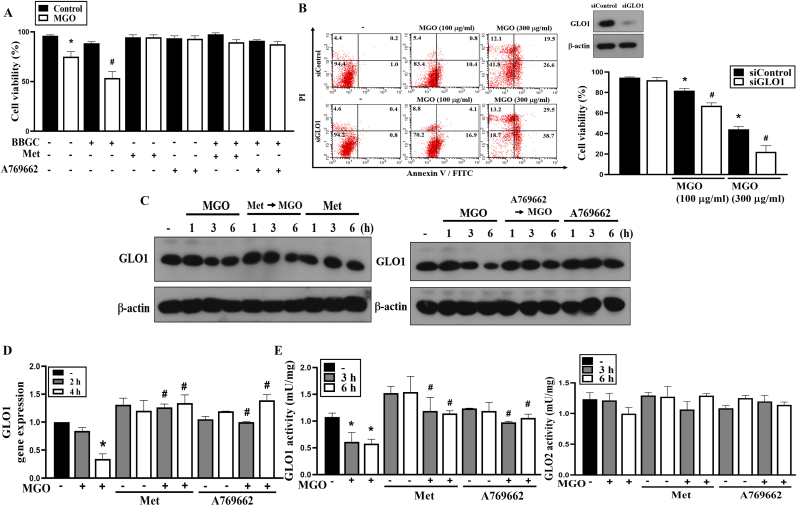
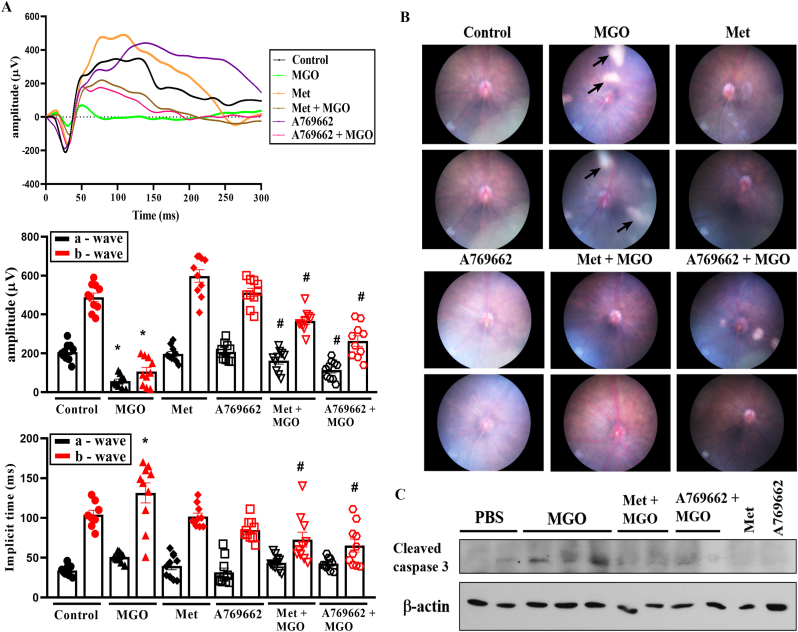
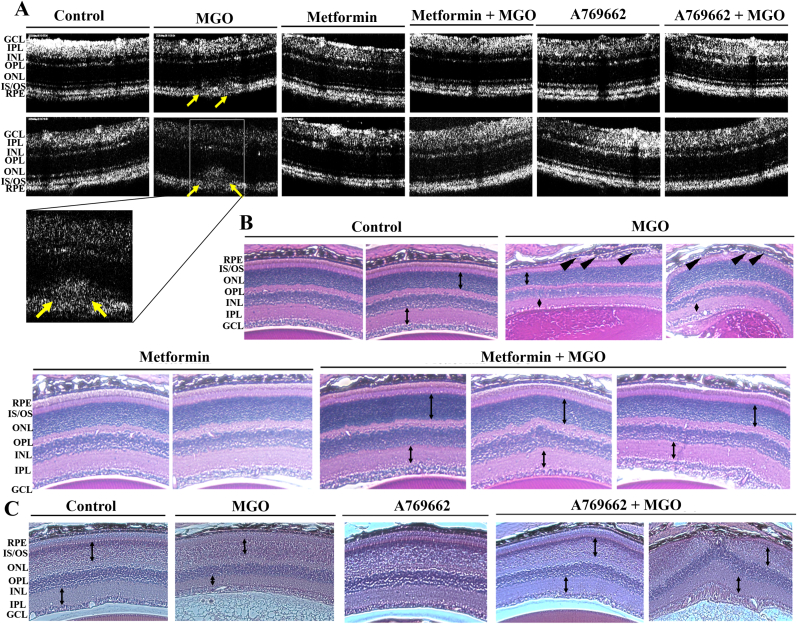
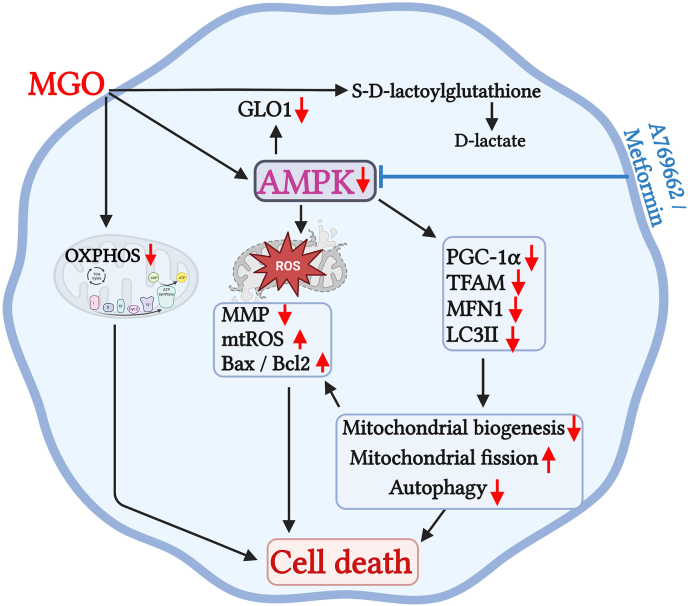
Diabetic retinopathy (DR) is a major cause of blindness in adult, and the accumulation of advanced glycation end products (AGEs) is a major pathologic event in DR. Methylglyoxal (MGO), a highly reactive dicarbonyl compound, is a precursor of AGEs. Although the therapeutic potential of metformin for retinopathy disorders has recently been elucidated, possibly through AMPK activation, it remains unknown how metformin directly affects the MGO-induced stress response in retinal pigment epithelial cells. Therefore, in this study, we compared the effects of metformin and the AMPK activator A769662 on MGO-induced DR in mice, as well as evaluated cytotoxicity, mitochondrial dynamic changes and dysfunction in ARPE-19 cells. We found MGO can induce mitochondrial ROS production and mitochondrial membrane potential loss, but reduce cytosolic ROS level in ARPE-19 cells. Although these effects of MGO can be reversed by both metformin and A769662, we demonstrated that reduction of mitochondrial ROS production rather than restoration of cytosolic ROS level contributes to cell protective effects of metformin and A769662. Moreover, MGO inhibits AMPK activity, reduces LC3II accumulation, and suppresses protein and gene expressions of MFN1, PGC-1α and TFAM, leading to mitochondrial fission, inhibition of mitochondrial biogenesis and autophagy. In contrast, these events of MGO were reversed by metformin in an AMPK-dependent manner as evidenced by the effects of compound C and AMPK silencing. In addition, we observed an AMPK-dependent upregulation of glyoxalase 1, a ubiquitous cellular enzyme that participates in the detoxification of MGO. In intravitreal drug-treated mice, we found that AMPK activators can reverse the MGO-induced cotton wool spots, macular edema and retinal damage. Functional, histological and optical coherence tomography analysis support the protective actions of both agents against MGO-elicited retinal damage. Metformin and A769662 via AMPK activation exert a strong protection against MGO-induced retinal pigment epithelial cell death and retinopathy. Therefore, metformin and AMPK activator can be therapeutic agents for DR.

Keywords: AMPK; Diabetic retinopathy; Glyoxalase 1; Metformin; Methylglyoxal; Mitochondria; Retinal pigment epithelial cells.


Conflict of interest statement

Declaration of competing interest The authors declare that they have no known competing financial interests or personal relationships that could have appeared to influence the work reported in this paper.

Figures

Fig. 1
Fig. 1
Metformin protects RPE cells against MGO-induced cytotoxicity. (A) ARPE-19 cells were stimulated with MGO (300 μg/ml) for indicated time points. Cell viability was determined by Annexin V-FITC/PI staining using FACScalibur. (B) Cells were pretreated with metformin (2, 6 and 20 mM) 30 min prior to MGO (300 μg/ml) treatment for 6 h. Cell viability was determined by Annexin V-FITC/PI staining. (C) Metformin (6 or 20 mM) was administered at 30 min pre-treatment before MGO, co-treatment with MGO, or post-treatment at 0.5, 1, 2, or 4 h after MGO (300 μg/ml). After 6 h of MGO treatment, cell viability was determined by Annexin V-FITC/PI staining. Data were the mean ± S.E.M. from at least 3 independent experiments. *p < 0.05, indicating the significant effect of MGO; #p < 0.05, indicating the blockade effect of metformin. (D) Cells were pretreated with 6 mM metformin for 30 min followed by MGO (300 μg/ml) treatment for 3 or 6 h. Cell lysates were prepared for immunoblotting. Data were representative of 3 independent experiments.
Fig. 2
Fig. 2
Metformin can restore cellular ROS in MGO-stimulated cells. (A, C) Cells were 30 min pretreated with metformin (6 mM) followed by MGO (300 μg/ml) treatment for 0.5, 1, 2 or 4 h. (B, D) Cells were pretreated with metformin (2, 6 or 20 mM) 30 min prior to MGO (300 μg/ml) incubation for 4 h. After treatment of MGO for indicated times, cellular ROS level was determined by using DCFDA (A, B) or DHE (C, D). Data were the mean ± S.E.M. from at least 3 independent experiments. *p < 0.05, indicating the significant effect of MGO; #p < 0.05, indicating the significant reversal effect of metformin on MGO-induced cellular responses.
Fig. 3
Fig. 3
Metformin attenuates MGO-induced mitochondrial ROS production and mitochondrial membrane potential loss. (A, B) Cells were 30 min pretreated with metformin (6 mM or 20 mM) followed by MGO (300 μg/ml) stimulation for indicated time points. Mitochondrial superoxide anion and mitochondrial H2O2 were measured using mitoSOX (A) and mitoPY1 (B) respectively. (C) Cells were pretreated with metformin (2, 6 or 20 mM) 30 min prior to MGO (300 μg/ml) treatment. Four hours later JC-1 was used to measure the mitochondrial membrane potential by FACScalibur. (D) Cells were treated with metformin (6 mM) and immediately subjected into Seahorse XFe24 analyzer. After 26 min MGO was injected through port A. Cells were subsequently treated with oligomycin (2.5 μM), FCCP (1 μM) and antimycin A (2.5 μM)/rotenone (2.5 μM) through parts B, C and D at 50 min, 74 min and 98 min, respectively. Intracellular OCR was measured by seahorse XF24 analyzer. Data were the mean ± S.E.M. from at least 3 independent experiments. *p < 0.05, indicating the significant effect of MGO. #p < 0.05, indicating the reversal effects of metformin.
Fig. 4
Fig. 4
Increase of mitoROS but not reduction of cytosolic ROS involves in MGO-induced cell death in ARPE-19 cells. (A) Cells were 30 min pretreated with NAC (3 and 10 mM) prior to MGO (300 μg/ml) treatment for 6 h. Then Cell viability was determined. (B, C, E, F) Cells were 30 min pretreated with metformin (6 mM) and/or NAC (3 mM) followed by MGO (300 μg/ml) treatment for 4 h. DCFDA (B), DHE (C), mitoSOX (E), and mitoPY1 (F) were used to measure ROS. (D) Cells were 30 min pretreated with DPI (3 μM) and/or metformin (6 mM) prior to MGO (300 μg/ml) treatment for 6 h. Cell viability was measured. (G) Cells were treated with NAC (5 mM) and immediately subjected into Seahorse XFe24 analyzer for measurement of OCR as described in Fig. 3D. Data were the mean ± S.E.M. of at least 3 independent experiments. *p < 0.05, indicating the significant effect of MGO; #p < 0.05, indicating the reversal effects of metformin and NAC. **p < 0.05, indicating the significant reduction of ROS by NAC.
Fig. 5
Fig. 5
AMPK activator A769662 mimics the effect of metformin in MGO-stimulated cells (A) Cells were pretreated with metformin (6 mM) or A769662 (25 μM) 30 min prior to MGO (300 μg/ml) treatment for indicated time points. AMPK phosphorylation was measured by immunoblotting. (B) Cells were 30 min pretreated with A769662 (25 μM) prior to MGO (300 μg/ml) for 6 h. Cell viability was measured by Annexin V-FITC/PI using FACS. (C, D, E, F) Cells were pretreated with A769662 (25 μM) for 30 min followed by MGO (300 μg/ml) treatment for 4 h. DCFDA (C), DHE (D), mitoSOX (E), and mitoPY1 (F) were used to measure cellular ROS. (G) Cells were 30 min pretreated with compound C (10 μM) followed by MGO (300 μg/ml) stimulation for 6 h. In some experiments, ARPE-19 cells were treated with siRNA followed by stimulation with MGO (300 μg/ml) for 6 h. Cell viability was measured by Annexin V-FITC/PI using FACS. AMPK expression after siRNA treatment was determined by immunoblotting. (H) Immediately after treatment with A769662 (25 μM), cells were subjected into SFe24 analyzer for OCR measurement, as described in Fig. 3D. Data were the mean ± S.E.M. from at least 3 independent experiments. *p < 0.05, indicating the significant effect of MGO; #p < 0.05, indicating the significant effects of A769662, compound C and AMPK silencing on MGO-induced responses.
Fig. 6
Fig. 6
Rotenone fails to affect the MGO-induced cellular responses. (A) Cells were pretreated with rotenone (10 μM) 30 min prior to MGO (300 μg/ml) stimulation for 6 h. Cell viability was measured by Annexin V-FITC/PI using FACS. (BD) Cells were pretreated with rotenone (10 μM) 30 min prior to MGO (300 μg/ml) stimulation for indicated times. DCFDA (B) mitoSOX (C) mitoPY1 (D) were used to measure cellular ROS. (E) Cells were treated with 25 μM rotenone for 1, 3 or 6 h. AMPK phosphorylation was determined by immunoblotting. Data were the mean ± S.E.M. from at least 3 independent experiments. *p < 0.05, indicating the significant effect of MGO.
Fig. 7
Fig. 7
Metformin and A769662 reverse MGO-induced mitochondrial fission and downregulation of mitochondrial biogenesis genes expression. (A, B, C) Cells were pretreated with metformin (6 mM) and/or A769662 (25 μM) 30 min prior to MGO (300 μg/ml) stimulation. After 2 h, Tom20 staining was conducted and imaged (A). Scale bars indicated 10 μm. After 1, 3, or 6 h, cell lysates were prepared for immunoblotting (B). After 2 or 4 h, PGC-1α, TFAM, MFN1, MFN2, OPA1, Drp-1 and LC3 gene expressions were measured (C). (D) In some experiments, AMPK was silenced or was 30 min pretreated with compound C (10 μM) before MGO (300 μg/ml). After 3 h, PGC-1α protein expression was determined. (E) Cells were co-treated with bafilomycin A1 (100 nM) and/or MGO (300 μg/ml) for 1, 3, or 6 h, and then LC3 protein level was determined. *p < 0.05, indicating the significant effect of MGO. #p < 0.05, indicating the blockade effects of metformin and A769662.
Fig. 8
Fig. 8
Metformin and A769662 reverse MGO-induced GLO1 downregulation. (A) Cells were pretreated with BBGC (10 μM), metformin (6 mM) and/or A769662 (25 μM) 30 min before MGO (100 μg/ml) stimulation. After 4 h, cell viability was determined by Annexin V-FITC/PI staining using FACS. (B) Cells were treated with siRNA to silence GLO1, then treated with MGO (100 or 300 μg/ml) for 6 h. Cell viability was determined by Annexin V-FITC/PI staining using FACS. (CE) Cells were pretreated with metformin (6 mM) and/or A769662 (25 μM) 30 min prior to MGO (300 μg/ml) stimulation. (C) After incubation for 1, 3, or 6 h, cell lysates were prepared for immunoblotting. (D) After incubation for 2 or 4 h, GLO1 gene expression was measured using PCR analysis. (E) After incubation for 3 or 6 h, GLO1 and GLO2 activities were determined by commercial kits according to the manufacturer's instructions. Data were the mean ± S.E.M. from at least 3 independent experiments. *p < 0.05, indicating the significant effect of MGO. #p < 0.05, indicating the blockade effects of metformin and A769662.
Fig. 9
Fig. 9
Metformin and A769662 protect mice from MGO-induced retinopathy. Aestheticized mice were intravitreally injected with PBS (n = 10), MGO (1.5 nmol) (n = 10), metformin (5 μg) (n = 10), metformin (5 μg) + MGO (1.5 nmol) (n = 10), A769662 (20 pmol) (n = 10), or A769662 (20 pmol) + MGO (1.5 nmol) (n = 10). At day 3 post injection, ERG waves (A) and fundus images (B) were recorded. The arrows indicate the cotton wool spots. Retina were euthanized from indicated mice groups and immunoblotting of lysates was conducted (C). Data were the mean ± S.E.M. from 10 mice. *p < 0.05, indicating the significant effect of MGO; #p < 0.05, indicating the reversal effects of metformin and A769662.
Fig. 10
Fig. 10
Metformin and A769662 reverse MGO-induced changes of retinal morphology. Aestheticized mice were intravitreally injected with PBS (n = 10), MGO (1.5 nmol) (n = 10), metformin (5 μg) (n = 10), metformin (5 μg) + MGO (1.5 nmol) (n = 10), A769662 (20 pmol) (n = 10), or A769662 (20 pmol) + MGO (1.5 nmol) (n = 10). At day 3 post injection, optical coherence tomographical images (A) and H&E staining images (B) were determined. The yellow arrows in (A) indicate subretinal deposits. The black bidirectional arrows in (B) indicate the thickness of IPL and ONL. The black arrowheads in (B) indicate the broken of RPE lining. (For interpretation of the references to color in this figure legend, the reader is referred to the Web version of this article.)
Fig. 11
Fig. 11
Schematic summary of the cell protective actions of metformin and A769662 in MGO-treated ARPE-19 cells via AMPK activation. MGO can inhibit AMPK, leading to downregulation of MFN1, PGC-1α and TFAM gene expression and inhibition of LC3II/I ratio. These events cause mitochondrial fission, inhibit mitochondrial biogenesis and autophagy, which are accompanied by the mitochondrial dysfunction, ROS production, mitochondrial membrane potential loss, and caspase 3 activation. MGO can also downregulate GLO1 gene expression and inhibition of GLO1 activity leads to delay intracellular MGO metabolism and prolong its cytotoxicity. Metformin and A769662 can reverse above death pathway events of MGO through AMPK activation and protect RPE cells against MGO insult.

References

    1. Hanus J., Anderson C., Wang S. RPE necroptosis in response to oxidative stress and in AMD. Ageing Res. Rev. 2015;24(Pt B):286–298. - PMC - PubMed
    1. Lakkaraju A., Umapathy A., Tan L.X., et al. The cell biology of the retinal pigment epithelium. Prog. Retin. Eye Res. 2020 - PMC - PubMed
    1. Stitt A.W. AGEs and diabetic retinopathy. Invest. Ophthalmol. Vis. Sci. 2010;51(10):4867–4874. - PubMed
    1. Vlassara H., Uribarri J. Advanced glycation end products (AGE) and diabetes: cause, effect, or both? Curr. Diabetes Rep. 2014;14(1):453. - PMC - PubMed
    1. Schalkwijk C.G., Stehouwer C.D.A. Methylglyoxal, a highly reactive dicarbonyl compound, in diabetes, its vascular complications, and other age-related diseases. Physiol. Rev. 2020;100(1):407–461. - PubMed

Publication types

MeSH terms

Substances