. 2023 Aug:64:102783.
doi: 10.1016/j.redox.2023.102783. Epub 2023 Jun 15.

Development of KEAP1-targeting PROTAC and its antioxidant properties: In vitro and in vivo

Affiliations

Development of KEAP1-targeting PROTAC and its antioxidant properties: In vitro and in vivo

Se Yong Park et al. Redox Biol. 2023 Aug.

Abstract

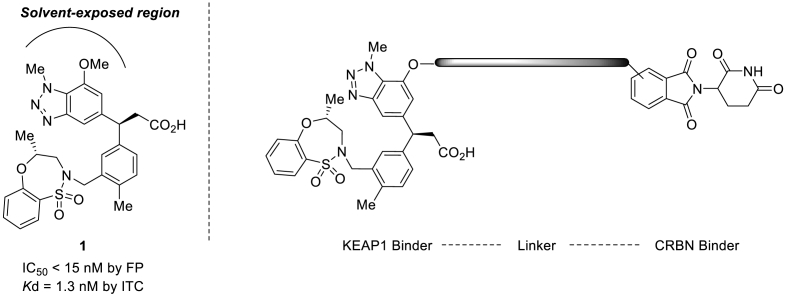
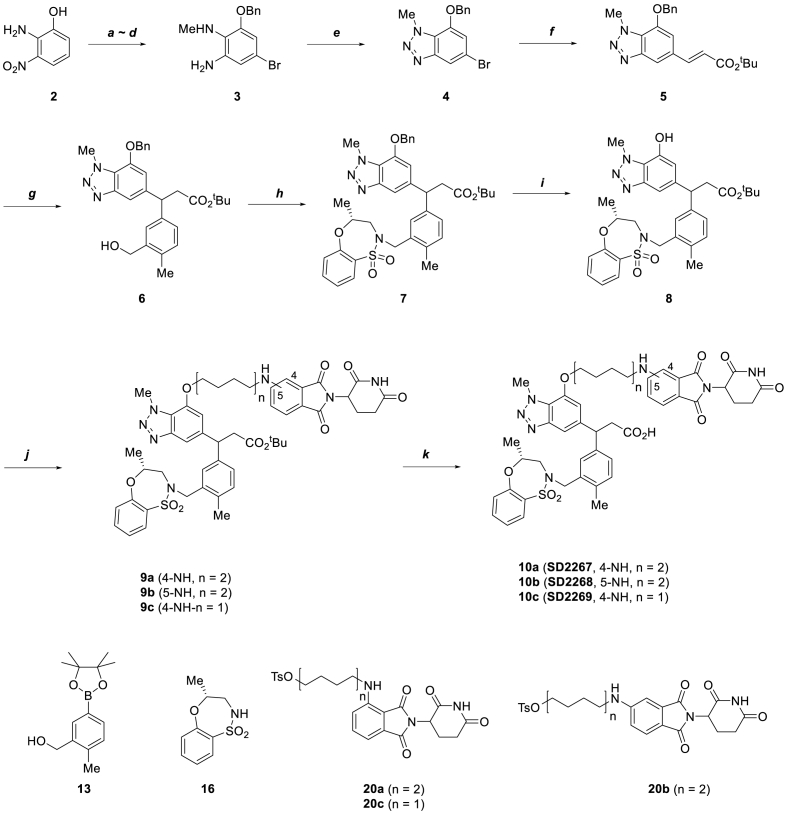
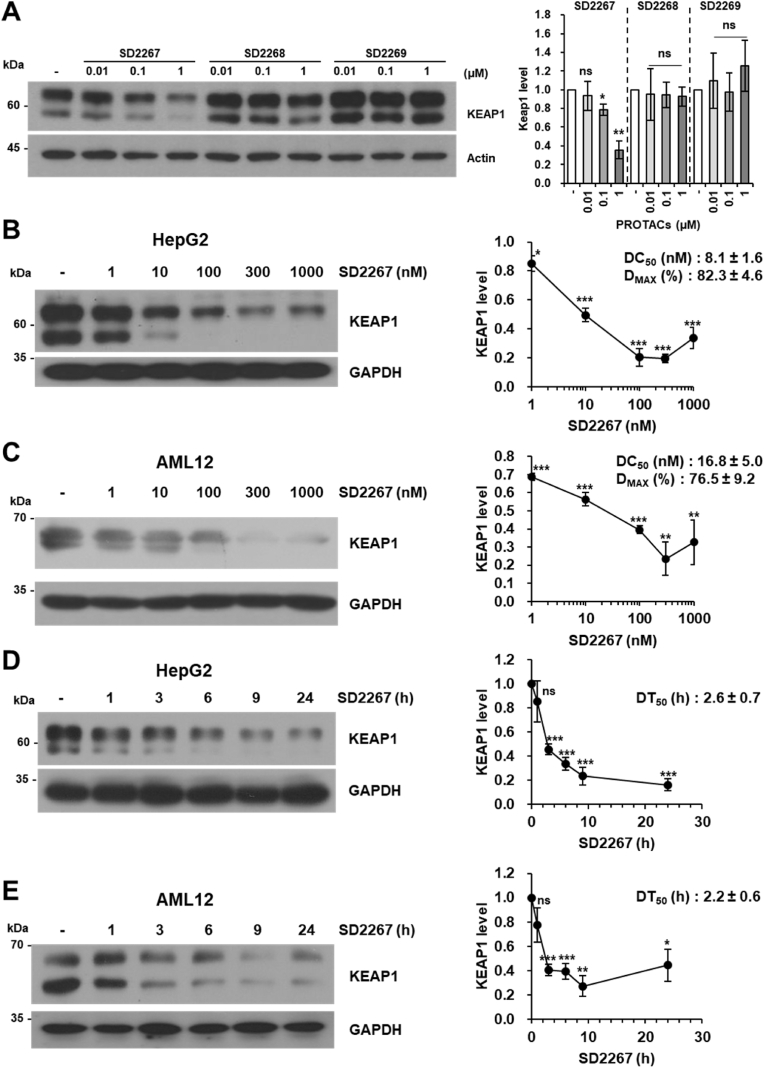
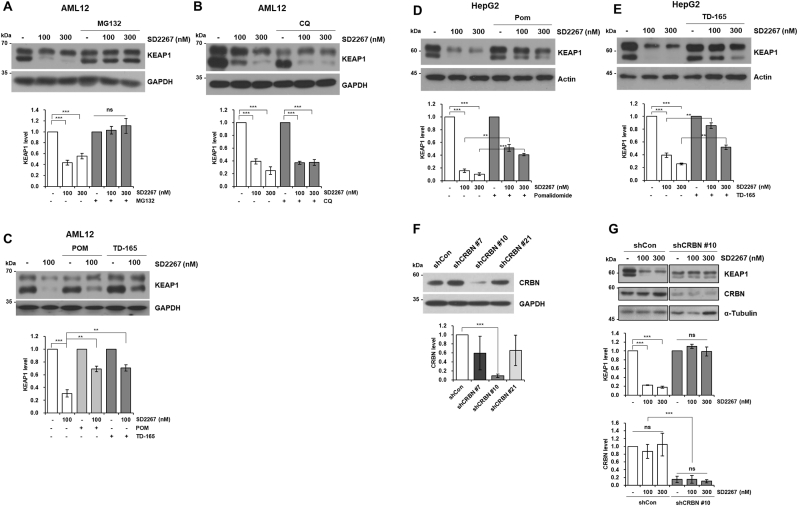
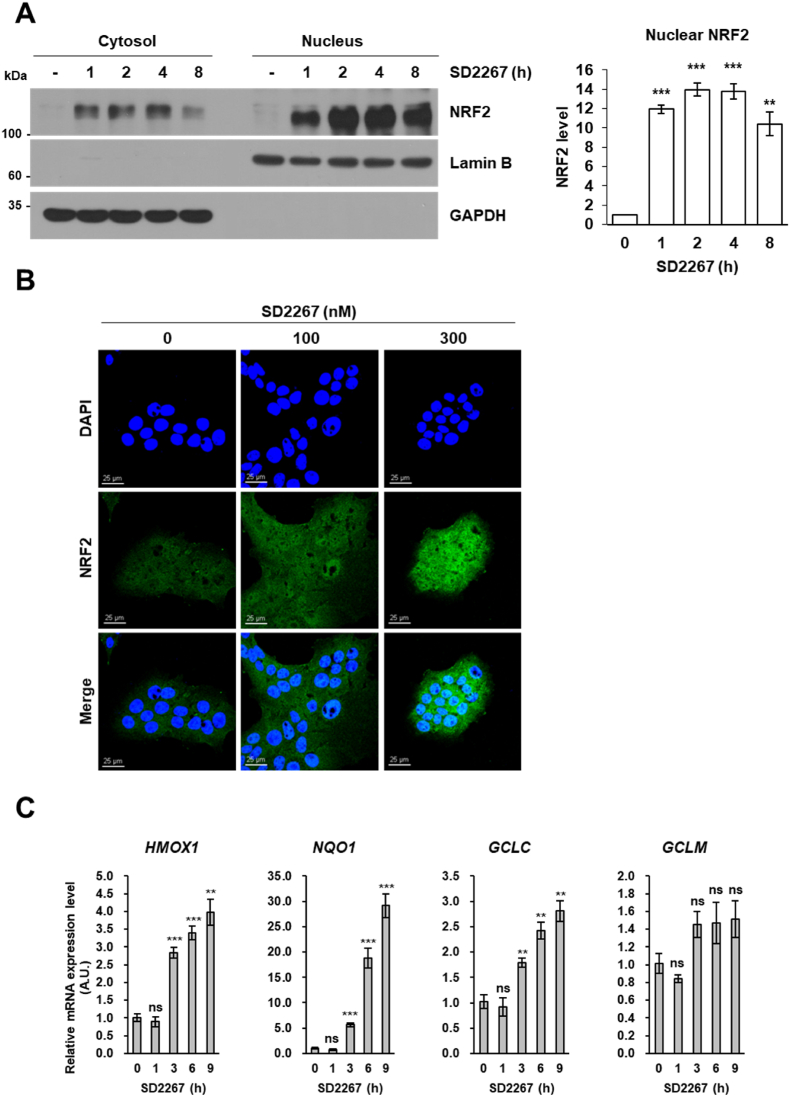
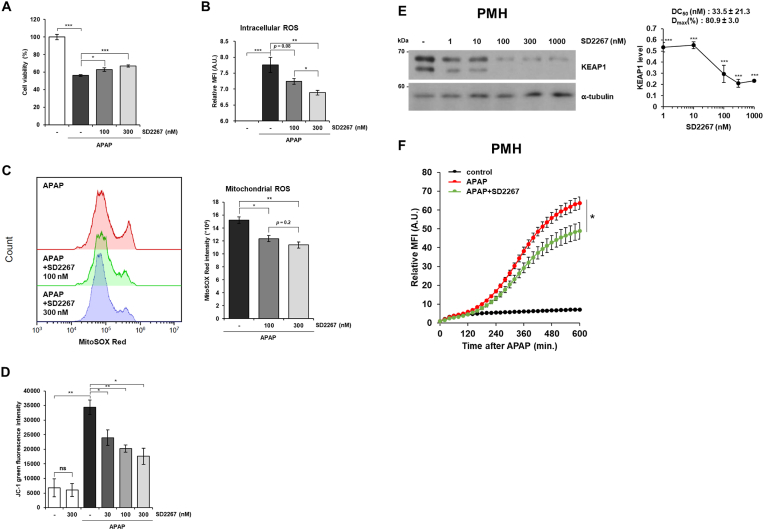
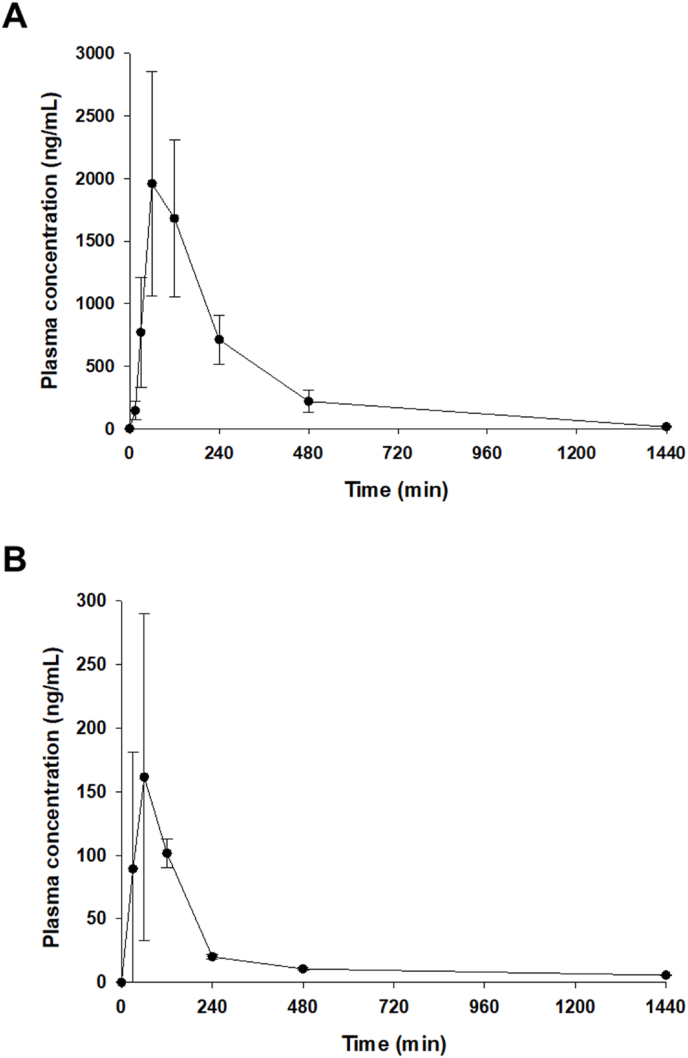
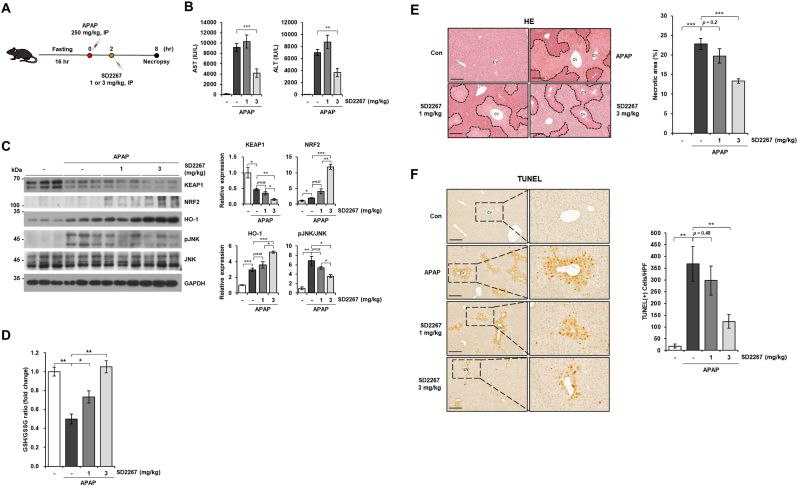
Oxidative stress due to abnormal accumulation of reactive oxygen species (ROS) is an initiator of a large number of human diseases, and thus, the elimination and prevention of excessive ROS are important aspects of preventing the development of such diseases. Nuclear factor erythroid 2-related factor 2 (NRF2) is an essential transcription factor that defends against oxidative stress, and its function is negatively controlled by Kelch-like ECH-associated protein 1 (KEAP1). Therefore, activating NRF2 by inhibiting KEAP1 is viewed as a strategy for combating oxidative stress-related diseases. Here, we generated a cereblon (CRBN)-based proteolysis-targeting chimera (PROTAC), which we named SD2267, that induces the proteasomal degradation of KEAP1 and leads to NRF2 activation. As was intended, SD2267 bound to KEAP1, recruited CRBN, and induced the degradation of KEAP1. Furthermore, the KEAP1 degradation efficacy of SD2267 was diminished by MG132 (a proteasomal degradation inhibitor) but not by chloroquine (an autophagy inhibitor), which suggested that KEAP1 degradation by SD2267 was proteasomal degradation-dependent and autophagy-independent. Following KEAP1 degradation, SD2267 induced the nuclear translocation of NRF2, which led to the expression of NRF2 target genes and attenuated ROS accumulation induced by acetaminophen (APAP) in hepatocytes. Based on in vivo pharmacokinetic study, SD2267 was injected intraperitoneally at 1 or 3 mg/kg in APAP-induced liver injury mouse model. We observed that SD2267 degraded hepatic KEAP1 and attenuated APAP-induced liver damage. Summarizing, we described the synthesis of a KEAP1-targeting PROTAC (SD2267) and its efficacy and mode of action in vitro and in vivo. The results obtained suggest that SD2267 could be used to treat hepatic diseases related to oxidative stress.

Keywords: KEAP1; Liver; NRF2; Oxidative stress; Proteolysis-targeting chimera (PROTAC).


Conflict of interest statement

Declaration of competing interest The authors declare no competing interests.

Figures

Fig. 1
Fig. 1
Design of KEAP1-targeting PROTAC Compound 1 is a reported inhibitor of KEAP1 (IC50 < 15 nM, Kd = 1.3 nM) and was used to synthesize of KEAP1-targeting PROTAC with a flexible linking vector and CRBN ligand.
Scheme 1
Scheme 1
Synthesis of KEAP1-targeting PROTAC. Reagent and conditions: (a) BnBr, K2CO3, EtOH, 70 °C, 81%; (b) Br2, AcONa, AcOH, r.t, 96%; (c) MeI, NaH, DMF, 0 °C to r.t, 79%; (d) Zn dust, AcOH, 0 °C–45 °C, 59%; (e) NaNO2, 10% H2SO4 (aq.), 87%; (f) tert-Butyl acrylate, Pd(PPh3)4, P(O-Tol)3, DMF, 95 °C, 79%; (g) 13, [RhCl(Cod)]2, Et3N, Dioxane/H2O (2:1), 95 °C, 53%; (h) 16, DIAD, PPh3, anhydrous THF, r.t, 75%; (i) H2, Pd/C, MeOH, r.t, 98%; (j) 20a-c, K2CO3, DMF, 90 °C, 21–39%; (k) 4 N HCl/Dioxane, r.t, 53–88%.
Fig. 2
Fig. 2
Selection of a KEAP1-targeting PROTAC and its efficacy in hepatocytes (A-E) Representative image of KEAP1 protein expression in HepG2 and AML12 cells (left) and graphs of the relative mean expression of KEAP1 (right). (A) HepG2 cells were incubated with SD2267, SD2268, or SD2269 at indicated doses for 6 h. (B–E) HepG2 or AML12 cells were treated with SD2267 at different concentrations for 24 h (B and C, respectively) or at different times at 100 nM (D and E, respectively). DC50, DMAX, and DT50 value are included in the related graphs. Densitometries were performed using three independent experiments. ns; no significance, *p < 0.05, **p < 0.01, ***p < 0.001 versus untreated cells.
Fig. 3
Fig. 3
SD2267 degraded KEAP1 through CRBN-mediated proteasomal degradation (A) AML12 cells were treated with SD2267 (100 or 300 nM) and MG132 (5 μM) for 4 h. (B) AML12 cells were treated with chloroquine (CQ; 20 μM) for 18 h prior to SD2267 (100 or 300 nM) treatment for 6 h. (C) AML12 cells were treated with pomalidome (POM; 1 μM) or TD-165 (1 μM) for 3 h prior to SD2267 (100 nM) treatment for 6 h. (D, E) HepG2 cells were treated with pomalidome (POM; 1 μM) or TD-165 (1 μM) for 14 h prior to SD2267 (100 or 300 nM) for 6 h. (F) Clonal selection of cereblon (CRBN)-knockdown HepG2 cells. (G) HepG2 control cells (shCon) and CRBN knockdown cells (shCRBN #10) were treated with SD2267 (100 or 300 nM) for 24 h. Protein levels were determined by western blotting, and densitometries were performed using three independent experiments. ns; no significance, **p < 0.01, ***p < 0.001.
Fig. 4
Fig. 4
SD2267 promoted the nuclear translocation of NRF2 and activated NRF2 target genes in AML12 cells (A) AML12 cells were incubated with 300 nM of SD2267 for the indicated times, and subjected to nuclear fractionation. GAPDH was used as a loading control for cytosolic proteins, and Lamin B was used as a loading control for nuclear proteins. Protein expression levels were determined by western blotting, and densitometry was performed using three independent experiments. **p < 0.01, ***p < 0.001. (B) AML12 cells were incubated with 100 or 300 nM of SD2267 for 3 h, and subjected to NRF2 immunofluorescence staining (green). DAPI was used to stain nuclei (blue). In merged NRF2 and DAPI images, nuclear NRF2 stained blue-green (Scale bar = 25 μm). (C) AML12 cells were incubated with 100 nM of SD2267 for the indicated times. Gene expression levels of HMOX1, NQO1, GCLC, and GCLM were measured by qRT-PCR. Relative expression levels are presented as mean ± SEM (n = 3 per group). **p < 0.01, ***p < 0.001, ns; not significant versus the control. (For interpretation of the references to colour in this figure legend, the reader is referred to the Web version of this article.)
Fig. 5
Fig. 5
SD2267 reduced APAP-induced ROS generation in hepatocytes (A) AML12 cells were treated with 15 mM of APAP in the absence or presence of SD2267 for 24 h, and the cell viability was measured by MTT assay. Data are presented as means ± SEMs (n = 5 per group). (B) AML12 cells were treated with 5 mM of APAP in the absence or presence of SD2267, and then DCF-DA fluorescence intensities were measured at 4 h after APAP treatment. (C) AML12 cells were treated with 5 mM of APAP in the absence or presence of SD2267 for 8 h, and then stained with MitoSOX Red. The intensities of MitoSOX Red were measured by flow cytometry, and presented as means ± SEMs (n = 3 per group). (D) AML12 cells were treated with 5 mM of APAP in the absence or presence of SD2267 for 8 h, and then stained with JC-1. The green fluorescence intensities of JC-1 were measured by flow cytometry, and presented as means ± SEMs (n = 3 per group). (E) Primary mouse hepatocytes (PMHs) were treated with SD2267 at various concentrations for 24 h, and KEAP1 expressions were determined by western blotting. Densitometry was performed using three independent experiments and presented as a graph with DC50 and Dmax value. (F) PMHs were treated with 100 nM of SD2267 for 6 h before APAP treatment at 20 mM, and then DCF-DA fluorescence intensities were measured every 20 min for 10 h. Data are presented as means ± SEMs (n = 4 per group). *p < 0.05, **p < 0.01, ***p < 0.001. (For interpretation of the references to colour in this figure legend, the reader is referred to the Web version of this article.)
Fig. 6
Fig. 6
In vivo pharmacokinetics of SD2267 in mice Average plasma drug concentration-time profile of SD-2267 obtained after intraperitoneal injection (A) or oral administration (B) to mice at a dose of 3 mg/kg. Data are presented as means ± SDs (n = 3 per group).
Fig. 7
Fig. 7
SD2267 attenuated acetaminophen (APAP)-induced liver injury in mice (A) Experimental schedule of the APAP-induced liver injury mouse model. After 16 h of fasting, mice were injected with APAP (250 mg/kg, IP) and 2 h later treated with SD2267 (1 or 3 mg/kg, IP) for another 6 h. (B) Serum AST and ALT levels are presented as means ± SEMs. (C) Protein expression levels of liver tissues were determined by western blotting, and densitometry results of each protein levels are presented as means ± SEMs (n = 3 per group). (D) GSH to GSSG ratio was detected from liver tissues, and presented as means ± SEMs (n = 3 per group). (E) Representative images of hematoxylin and eosin (HE) stained liver tissues (left) with measured areas of necrosis (presented as means ± SEMs) (right). Necrotic areas are marked with dashed lines in HE images. (F) Representative images of terminal deoxynucleotidyl transferase dUTP nick end labeling (TUNEL) stained liver tissues (left) and the number of TUNEL positive cells per high power field (HPF; x400) (presented as means ± SEMs) (right). cv; central vein. Scale bar = 100 μm *p < 0.05, **p < 0.01, ***p < 0.001.

References

    1. Snezhkina A.V., Kudryavtseva A.V., Kardymon O.L., Savvateeva M.V., Melnikova N.V., Krasnov G.S., et al. ROS generation and antioxidant defense systems in normal and malignant cells. Oxid. Med. Cell. Longev. 2019;2019 - PMC - PubMed
    1. Pisoschi A.M., Pop A., Iordache F., Stanca L., Predoi G., Serban A.I. Oxidative stress mitigation by antioxidants - an overview on their chemistry and influences on health status. Eur. J. Med. Chem. 2021;209 - PubMed
    1. Schieber M., Chandel N.S. ROS function in redox signaling and oxidative stress. Curr. Biol. 2014;24(10):R453–R462. - PMC - PubMed
    1. Xu D., Xu M., Jeong S., Qian Y., Wu H., Xia Q., et al. The role of Nrf2 in liver disease: novel molecular mechanisms and therapeutic approaches. Front. Pharmacol. 2018;9:1428. - PMC - PubMed
    1. Wu S., Lu H., Bai Y. Nrf2 in cancers: a double-edged sword. Cancer Med. 2019;8(5):2252–2267. - PMC - PubMed

Publication types