. 2023 Jul:93:104669.
doi: 10.1016/j.ebiom.2023.104669. Epub 2023 Jun 20.

Comparative subgenomic mRNA profiles of SARS-CoV-2 Alpha, Delta and Omicron BA.1, BA.2 and BA.5 sub-lineages using Danish COVID-19 genomic surveillance data

Affiliations

Comparative subgenomic mRNA profiles of SARS-CoV-2 Alpha, Delta and Omicron BA.1, BA.2 and BA.5 sub-lineages using Danish COVID-19 genomic surveillance data

Man-Hung Eric Tang et al. EBioMedicine. 2023 Jul.

Abstract

Background: Severe acute respiratory syndrome coronavirus-2 (SARS-CoV-2) has rapidly spread worldwide in the population since it was first detected in late 2019. The transcription and replication of coronaviruses, although not fully understood, is characterised by the production of genomic length RNA and shorter subgenomic RNAs to make viral proteins and ultimately progeny virions. Observed levels of subgenomic RNAs differ between sub-lineages and open reading frames but their biological significance is presently unclear.

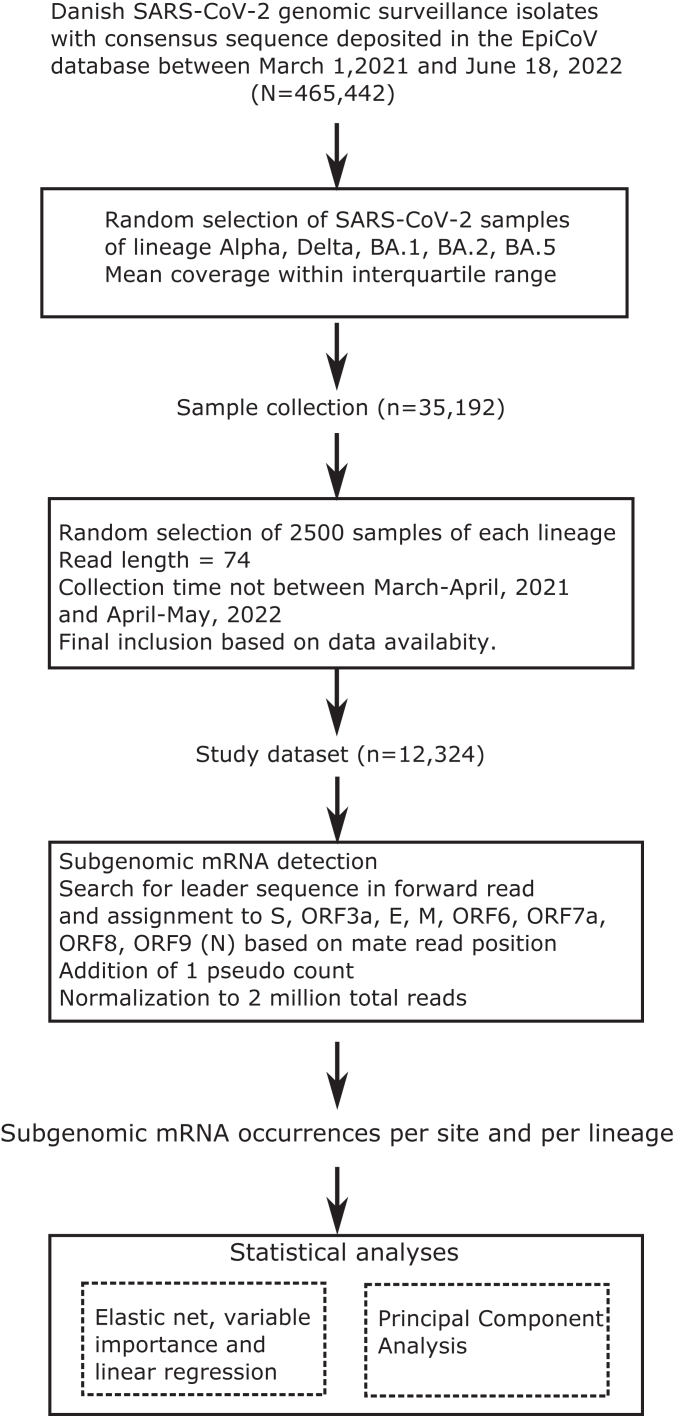
Methods: Using a large and diverse panel of virus sequencing data produced as part of the Danish COVID-19 routine surveillance together with information in electronic health registries, we assessed the association of subgenomic RNA levels with demographic and clinical variables of the infected individuals.

Findings: Our findings suggest no significant statistical relationship between levels of subgenomic RNAs and host-related factors.

Interpretation: Differences between lineages and subgenomic ORFs may be related to differences in target cell tropism, early virus replication/transcription kinetics or sequence features.

Funding: The author(s) received no specific funding for this work.

Keywords: Alpha; Association analysis; Delta; Omicron; SARS-CoV-2; Subgenomic RNA.


Conflict of interest statement

Declaration of interests The authors declare no competing or conflict of interest.

Figures

Fig. 1
Fig. 1
Subgenomic mRNA abundance across Alpha, Delta and Omicron SARS-CoV-2 lineages. A) From top to bottom: Schematic of the SARS-CoV-2 genome, discontinuous negative-strand RNA synthesis and detection of subgenomic RNA is performed by identifying read pairs spanning across the leader and the 5′-end of a subgenomic open reading frame. B) Subgenomic RNA abundance with one added pseudo count and normalised per two million total reads are shown for Alpha, Delta, and Omicron BA.1, BA.2, and BA.5 samples (n = 12,324) collected from the Danish genomic surveillance of COVID-19 in the period March, 2021–June, 2022. ‘Late Delta’ correspond to Delta samples contemporary to Omicron (November 2021–January 2022) while Delta corresponds to samples contemporary to Alpha (May–September, 2021).
Fig. 2
Fig. 2
Sample inclusion and analysis workflow. SARS-CoV-2 genome alignments were collected from routine Danish COVID-19 genomic surveillance sample collection. Included samples were randomly selected among those sequenced with Illumina and lengths of 74 nucleotides and having a mean coverage within normal range.
Fig. 3
Fig. 3
Principal component analysis of the subgenomic RNA levels across the different sites. The biplot shows the loadings of the two leading components, colored by lineage. The explained variance of PC1 and PC2 represent 89.52%.
Fig. 4
Fig. 4
Variable importance plot of the most significant factors associated with subgenomic mRNA count per 2 million. Variables selected by 10-fold cross-validated elastic-net for association with subgenomic mRNA levels are shown in their order of importance, repeated 50 times. The analysis was performed on a population subset of n = 3995 with all the available host-associated data. Definitions of all clinical variables are available in Supplementary Table S2.
Fig. 5
Fig. 5
Density pattern of subgenomic RNA abundance vs. Ct values in groups of samples with low counts. Density of abundance vs. Ct value are shown for four groups with a high missingness compared to other lineages: A) Alpha lineage, Orf9 (35% of samples with no observations) B) BA.5, M (60%) C) BA.2, M (69%), and D) BA.1 (71%). Cut off between sample groups with low (yellow) and high (blue) subgenomic RNA levels are defined dynamically based on the density profile of observations. A non-parametric test is performed between the groups with high and low abundance and standard significance cut-offs are applied: ∗∗: 0.01, ∗∗∗: 0.001, ∗∗∗∗: 0.0001).

References

    1. Sethuraman N., Jeremiah S.S., Ryo A. Interpreting diagnostic tests for SARS-CoV-2. JAMA. 2020;323:2249. - PubMed
    1. Wölfel R., Corman V.M., Guggemos W., et al. Virological assessment of hospitalized patients with COVID-2019. Nature. 2020;581:465–469. - PubMed
    1. Bullard J., Dust K., Funk D., et al. Predicting infectious severe acute respiratory syndrome coronavirus 2 from diagnostic samples. Clin Infect Dis. 2020;71:2663–2666. - PMC - PubMed
    1. van Kampen J.J.A., van de Vijver D.A.M.C., Fraaij P.L.A., et al. Duration and key determinants of infectious virus shedding in hospitalized patients with coronavirus disease-2019 (COVID-19) Nat Commun. 2021;12:267. - PMC - PubMed
    1. Immergluck K., Gonzalez M.D., Frediani J.K., et al. Correlation of SARS-CoV-2 subgenomic RNA with antigen detection in nasal midturbinate swab specimens. Emerg Infect Dis. 2021;27:2887–2891. - PMC - PubMed