. 2023 Jun 21;14(6):464-481.e7.
doi: 10.1016/j.cels.2023.05.003.

Positional influence on cellular transcriptional identity revealed through spatially segmented single-cell transcriptomics

Affiliations

Positional influence on cellular transcriptional identity revealed through spatially segmented single-cell transcriptomics

David B Morse et al. Cell Syst. .

Abstract

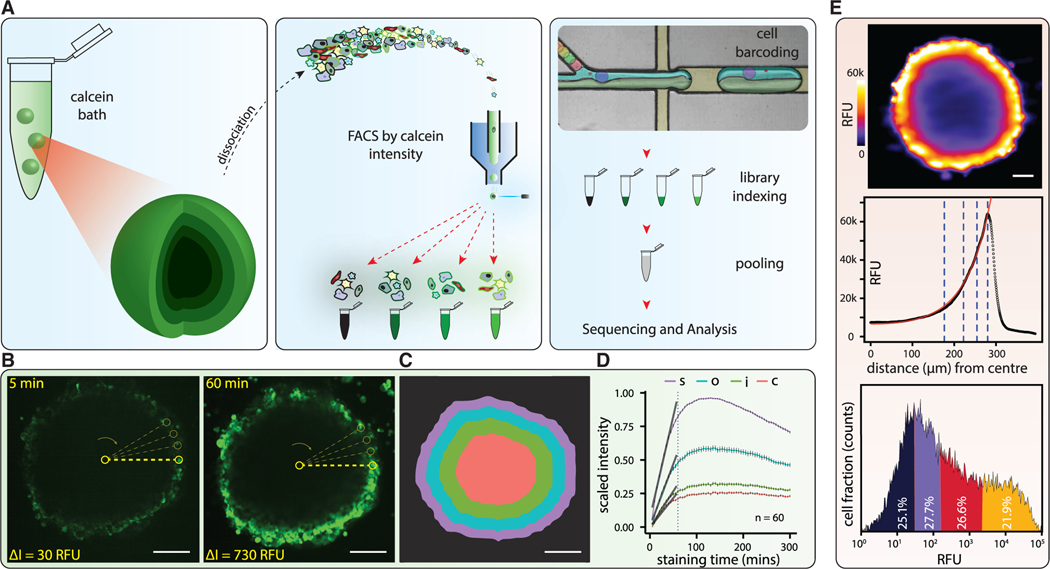
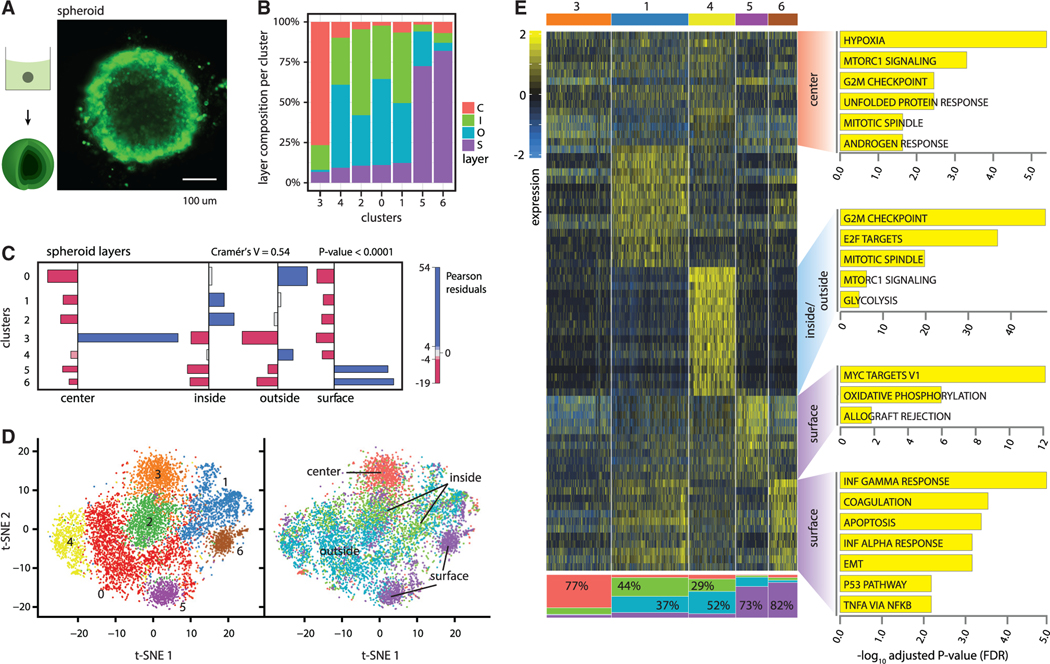
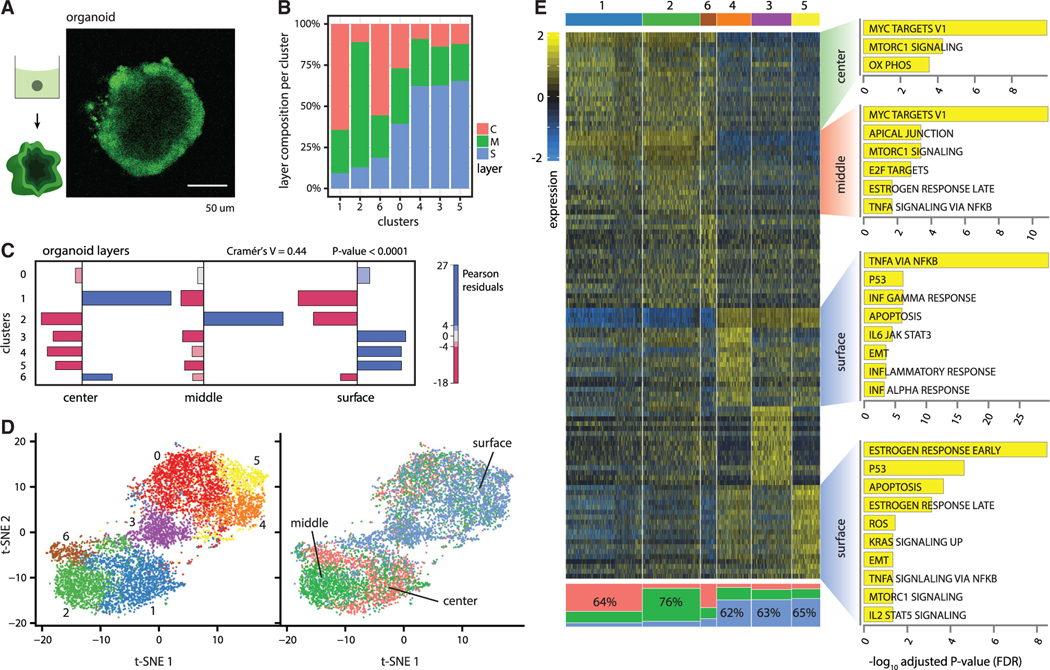
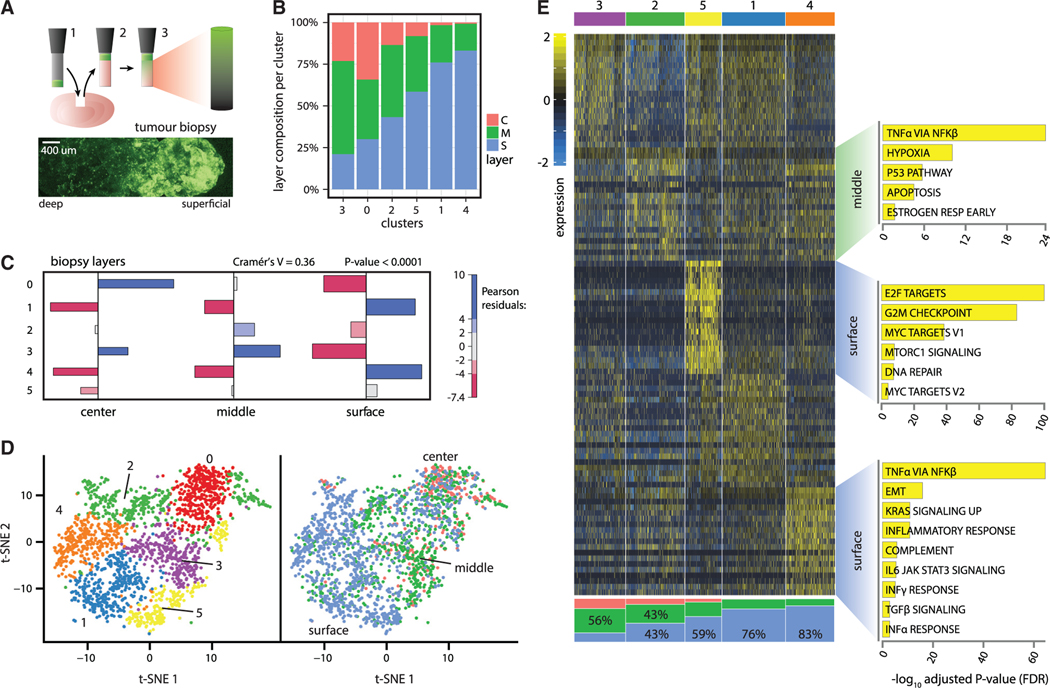
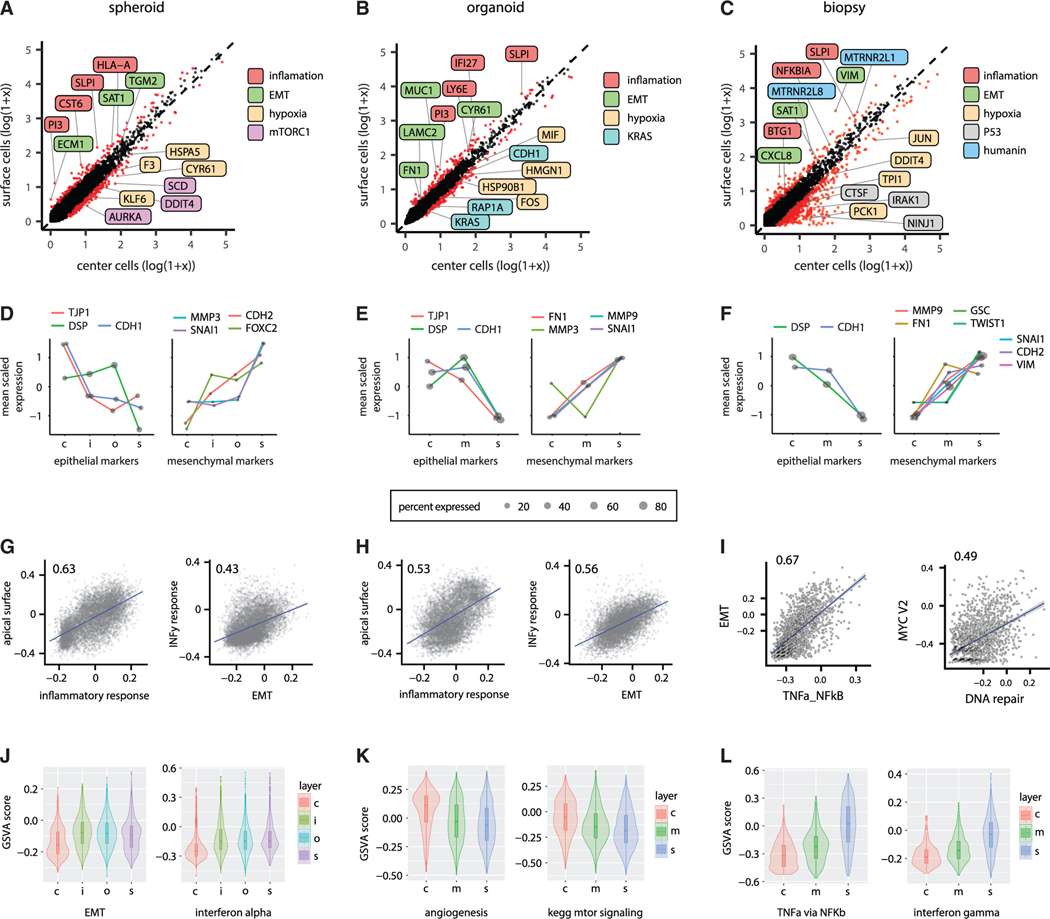
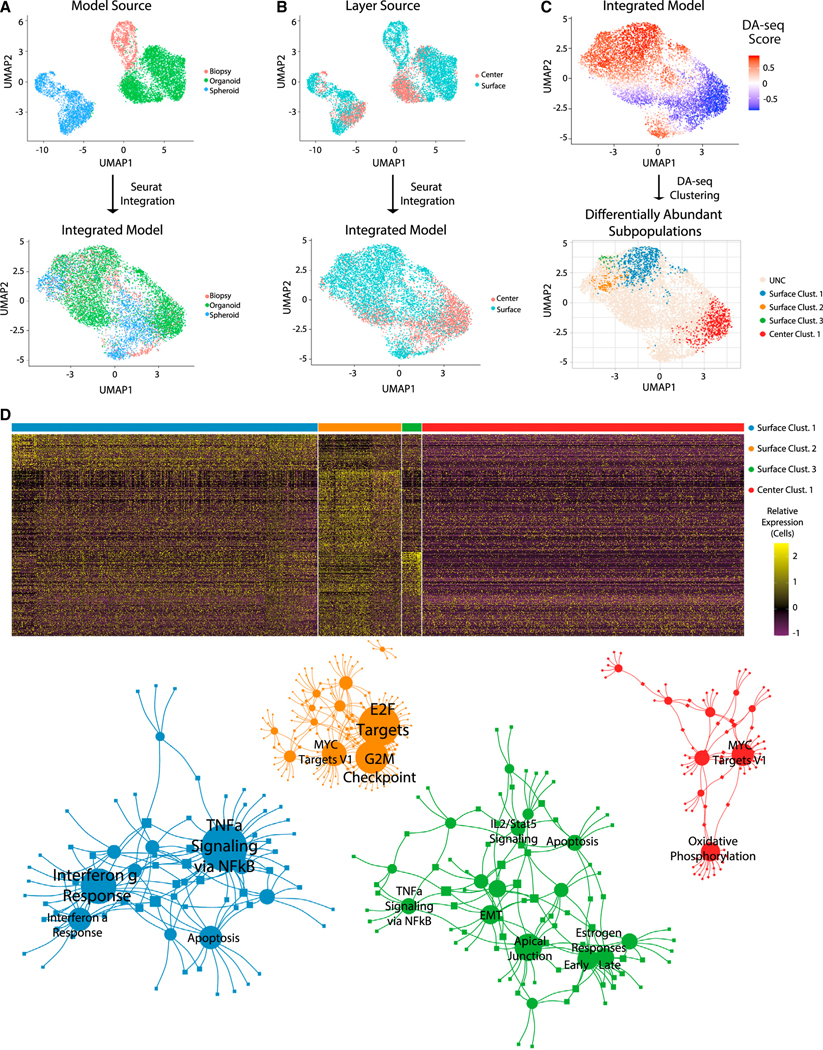
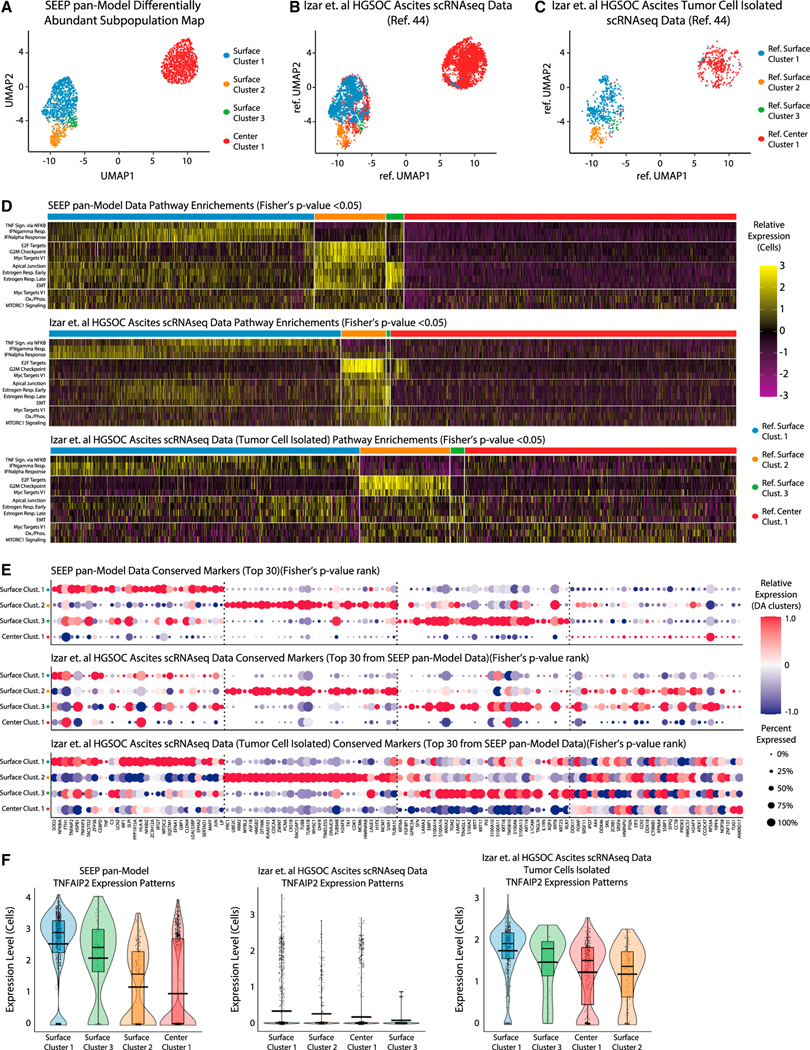
Single-cell RNA sequencing (scRNA-seq) is a powerful technique for describing cell states. Identifying the spatial arrangement of these states in tissues remains challenging, with the existing methods requiring niche methodologies and expertise. Here, we describe segmentation by exogenous perfusion (SEEP), a rapid and integrated method to link surface proximity and environment accessibility to transcriptional identity within three-dimensional (3D) disease models. The method utilizes the steady-state diffusion kinetics of a fluorescent dye to establish a gradient along the radial axis of disease models. Classification of sample layers based on dye accessibility enables dissociated and sorted cells to be characterized by transcriptomic and regional identities. Using SEEP, we analyze spheroid, organoid, and in vivo tumor models of high-grade serous ovarian cancer (HGSOC). The results validate long-standing beliefs about the relationship between cell state and position while revealing new concepts regarding how spatially unique microenvironments influence the identity of individual cells within tumors.

Keywords: RNA sequencing; genomics; oncology; ovarian cancer; scRNA-seq; single-cell transcriptomics; spatial transcriptomics; spatially resolved transcriptomics.


Conflict of interest statement

Declaration of interests The authors declare no competing interests.

Figures

Figure 1.
Figure 1.. Segmentation by exogenous perfusion overview
(A) Cartoon schematic of the SEEP workflow for spheroid cultures. Visualized steps include calcein AM bathing, dissociation, sorting, binning, sequencing, andanalysis. (B) Example image showing the difference in fluorescent intensity of a representative HGSOC spheroid across a time course (5 and 60 min) resolved usingconfocal microscopy. At t = 60 min, cells on the surface are over 700 relative fluorescent units (RFU) brighter than core cells. (C) At t = 60 min, spheroids were segmented into four concentric shells using a convoluted neural network. (D) The fluorescence intensity of each layer (n = 60 spheroids) was monitored in time. At t = 60 min, each layers’ mean fluorescence differed by over 5% and remained stable for over 100 min. Linear fits from 050min (gray, R2 values ≥ 0.97) show a linear accumulation of calcein as predicted by the integrated form of Equation (3) CfAt+B where A=k1C. A=(0.015,0.0093,0.0054,0.0044) and B=(0.053,0.0012,0.0046,0.0034) for the surface, outer, inner, and center layers of the spheroids respectively. (E) Example image showing the fluorescent intensity of a representative HGSOC spheroid at t = 60 min resolved using confocal microscopy (top). An intensityprofile of an individual spheroid (middle) and a FACS profile of 192 dissociated spheroids (bottom) show the distribution of fluorescence intensities across individual cells and the thresholds (dashed blue lines) used for segmentation. A hyperbolic sine fit to the middle panel (red, R2>0.99) shows a fluorescence distribution profile predicted by Equation (2). The fit corresponds to the equation, C=ACRRsinh(φ1r/R)rsinh(φ1)+B where A and B are the scaling factors 119501 RFU and 4150 RFU respectively. Scale bars, (B and C) 150 μm, (E) 100 μm.
Figure 2.
Figure 2.. Positional analysis of HGSOC cultured PEO1 spheroids
(A) Cartoon schematic of the dye perfusion of a solitary spheroid in a calcein AM bath and a confocal image of a spatially segmented HGSOC spheroid. (B) Composition chart showing the seven transcriptionally defined cell clusters and the retrospective, layer-specific composition of each resolved cluster. Red, core; green, inside; blue, outside; purple, surface. (C) Bar-chart visualization of chi-square test of independence defined associations between gene expression clusters and spheroid layers. Blue, over-representation; red, under-representation; gray, null hypothesis in the cross tabulation. Bar width illustrates relative cluster size (n = 1,178 center cells, n = 2,471 inside cells, n = 2,736 outside cells, and n = 2,667 surface cells). (D) t-SNE visualization of gene expression clusters (left) and radial cell position (right) (n = 37,908 cells). (E) Heatmap visualization of selected gene expression clusters and their layer-specific composition (by %). Significant transcriptional Hallmark gene signaturesfrom gene ontology (GO) are highlighted for clusters #3 (77% core cells), #4 (29% inside, 52% outside cells), #5 (73% surface cells), and #6 (82% surface cells). Color scale is linear. (Full accounting of Hallmark GO signatures can be found in Tables S3A–S3G, and Hallmark signatures from GSEA can be found in Figure S3 and Tables S3H–S3N.) Scale bar, (A) 100 μm. GEO: GSE157299.
Figure 3.
Figure 3.. Positional analysis of HGSOC cultured organoids derived from patient ascites
(A) Cartoon schematic of the dye perfusion of a solitary organoid in a calcein AM bath and a confocal image of a spatially segmented HGSOC organoid. (B) Composition chart showing the seven transcriptionally defined cell clusters and the retrospective, layer-specific composition of each resolved cluster. Red, core; green, middle; blue, surface. (C) Bar-chart visualization of chi-square test of independence defined associations between gene expression clusters and organoid layers. Blue, over-representation; red, under-representation; gray, null hypothesis in the cross tabulation. Bar width illustrates relative cluster size (n = 2,285 center cells, n = 2,819 middle cells, and n = 2,667 surface cells). (D) t-SNE visualization of gene expression clusters (left) and radial cell position (right) (n = 7,771 cells). (E) Heatmap visualization of selected gene expression clusters and their layer-specific composition (by %). Significant transcriptional Hallmark gene signaturesfrom GO are highlighted for clusters #1 (64% core cells), #2 (76% middle cells), #4 (62% surface cells), and #5 (65% surface cells). Color scale is linear. (Full accounting of Hallmark GO signatures can be found in Tables S5A–S5G, and Hallmark signatures from GSEA can be found in Figure S4 and Tables S5H–S5N.) Scale bar, (A) 50 μm. GEO: GSE157299.
Figure 4.
Figure 4.. Positional analysis of HGSOC PDX-derived biopsy samples
(A) Cartoon schematic of the dye perfusion of a punch biopsy in a calcein AM bath and a confocal image of a spatially segmented HGSOC biopsy sample. (B) Composition chart showing the six transcriptionally defined cell clusters and the retrospective, layer-specific composition of each resolved cluster. Red, core;green, middle; blue, surface. (C) Bar-chart visualization of chi-square test of independence defined associations between gene expression clusters and biopsy layers. Blue, over-representation; red, under-representation; gray, null hypothesis in the cross tabulation. Bar width illustrates relative cluster size (n = 280 center cells, n = 677 middle cells, and n = 1,010 surface cells). (D) t-SNE visualization of gene expression clusters (left) and radial cell position (right) (n = 1,967 cells). (E) Heatmap visualization of selected gene expression clusters and their layer-specific composition (by %). Significant transcriptional Hallmark gene signatures from GO are highlighted for clusters #2 (43% middle cells), #5 (59% surface cells), and #4 (83% surface cells). Color scale is linear. (Full accounting of Hallmark GO signatures can be found in Tables S6A–S6G and Hallmark signatures from GSEA can be found in Figure S5 and Tables S6H–S6N.) Scale bar, (A) 400 μm. GEO: GSE157299.
Figure 5.
Figure 5.. Consistency in regional transcriptomics profiles across HGSOC models
(A) Correlation of log-normalized gene expression traits between surface and core cells in HGSOC spheroid models. (B) Correlation of log-normalized gene expression traits between surface and core cells in HGSOC organoid models. (C) Correlation of log-normalized gene expression traits between surface and core cells in biopsy of HGSOC PDX models. (D) Expression trends for epithelial and mesenchymal marker genes across 3D layers in HGSOC spheroid models. (E) Expression trends for epithelial and mesenchymal marker genes across 3D layers in HGSOC organoid models. (F) Expression trends for epithelial and mesenchymal marker genes across 3D layers in biopsy of HGSOC PDX models. (G) Correlation of key gene expression signatures across all cells using GSVA in HGSOC spheroid models (n = 7,908 cells). (H) Correlation of key gene expression signatures across all cells using GSVA in HGSOC organoid models (n = 7,771 cells). (I) Correlation of key gene expression signatures across all cells using GSVA in biopsy of HGSOC PDX models (n = 1,967 cells). (J) Violin plots highlighting the distribution of all cells binned by 3D layer using GSVA signatures for EMT and IFNα response in HGSOC spheroid models (n = 1,178 center cells, n = 2,471 inside cells, n = 2,736 outside cells, and n = 2,667 surface cells). (K) Violin plots highlighting the distribution of all cells binned by 3D layer using GSVA signatures for angiogenesis and mTOR signaling in HGSOC organoid models(n = 2,285 center cells, n = 2,819 middle cells, and n = 2,667 surface cells). (L) Violin plots highlighting the distribution of all cells binned by 3D layer using GSVA signatures for TNFα signaling via NFκB and IFNγ response in biopsy of HGSOC PDX models (n = 280 center cells, n = 677 middle cells, and n = 1,010 surface cells).
Figure 6.
Figure 6.. Conservation of positional transcriptomics profiles across HGSOC models
(A and B) UMAP projections of cultured PEO1 spheroids, patient-derived organoids, and PDX-derived biopsy samples before (top) and after (bottom) scRNA-seq integration by data source. Cell embeddings were color coded by data source (A) and spatial segmentation (B). Total cells from all models (center and surface): n = 8,805. (C) DA cell subpopulations identified in the integrated HGSOC model. Top: UMAP embeddings of cells were colored by DA-seq score; small/large values indicate a high abundance of cells from the center/surface layers, respectively. Bottom: layer-specific DA subpopulations were detected by clustering cells with absolute DA-seq score greater than 0.8. Total cells from all models in DA regions: n = 2,105 (n = 1,019 center cells and n = 1,086 surface cells). Color scale is linear. (D) Heatmap of layer-specific genes conserved across the three HGSOC models. The markers were selected using the FindConservedMarkers method and gene functional over-representation in the MSigDB Hallmark collection (statistical test results are included in Table S8). Heatmap dimension: 364 genes × 2,002 cells. Color scale is linear.Total cells from all models (center and (E) Gene-pathway network of Hallmark gene sets enriched in the integrated model (adjusted p value < 0.05). Size of the nodes depends on the number of conserved markers overlapping a pathway. Gene set nodes are labeled circles, and gene nodes are squares without label. Nodes and edges are colored according to the DA subpopulation clusters: blue, surface cluster 1; orange, surface cluster 2; green, surface cluster 3; red, center cluster 1. Details of the enrichment analysis are included in Table S8.
Figure 7.
Figure 7.. Conservation of integrated HGSOC spatial models in primary HGSOC ascites samples
(A–C) Reference-based transfer was used to map subpopulations from our integrated HGSOC model (n = 2,083; 812 surface cluster 1, 218 surface cluster 2, 42 surface cluster 3, 1,011 center cluster) (A) to primary single-cell data from total ascites collections (n = 7,144; 1,878 surface cluster 1, 247 surface cluster 2, 20 (legend continued on next page) surface cluster 3, 4,999 center cluster) (B) and malignant-enriched ascites collections (n = 1,015; 463 surface cluster 1, 128 surface cluster 2, 20 surface cluster 3, 404 center cluster) (C) from HGSOC patients. From each data source, top 99% cells with the strongest contribution to the first UMAP dimension were used. In addition, the ascites cells with maximal transfer score greater than 0.5, and a difference from the next largest score of at least 0.25 were selected. Data were embedded and visualized across two UMAP dimensions, and the top 99% of cells with the highest contribution to the first UMAP dimension were used. (D) Signature scores (69) calculated for the top Hallmark gene sets enriched in the integrated HGSOC model (p value rank ≤ 3). Up to 2,000 top cells from each cluster were used (the top 95% of cells with the strongest contribution to the first UMAP dimension). The signature scores displayed are scaled and centered to zero mean and one SD across cells. Color scale is linear. (E) Dot plot showing the relative expression of the top 30 markers (p value rank) from the DA-seq pan-model SEEP signatures. Expression is shown across the integrated SEEP data, the total ascites data, and the malignant ascites data. Color scale is linear. (F) Violin plots overlaid with boxplots and averages (horizontal segments) of TNFAIP2 normalized expression from the integrated SEEP data, the total ascites data, and the malignant ascites data.

Similar articles

Cited by

References

    1. Macosko EZ, Basu A, Satija R, Nemesh J, Shekhar K, Goldman M,Tirosh I, Bialas AR, Kamitaki N, Martersteck EM, et al. (2015). Highly parallel genome-wide expression profiling of individual cells using nanoliter droplets. Cell 161, 1202–1214. 10.1016/j.cell.2015.05.002. - DOI - PMC - PubMed
    1. Zheng GXY, Terry JM, Belgrader P, Ryvkin P, Bent ZW, Wilson R, Ziraldo SB, Wheeler TD, McDermott GP, Zhu J, et al. (2017). Massively parallel digital transcriptional profiling of single cells. Nat. Commun. 8, 14049. 10.1038/ncomms14049. - DOI - PMC - PubMed
    1. Klein AM, Mazutis L, Akartuna I, Tallapragada N, Veres A, Li V,Peshkin L, Weitz DA, and Kirschner MW (2015). Droplet barcoding for single-cell transcriptomics applied to embryonic stem cells. Cell 161, 1187–1201. 10.1016/j.cell.2015.04.044. - DOI - PMC - PubMed
    1. Gerlinger M, Rowan AJ, Horswell S, Math M, Larkin J, Endesfelder D, Gronroos E, Martinez P, Matthews N, Stewart A, et al. (2012). Intratumor heterogeneity and branched evolution revealed by multiregion sequencing. N. Engl. J. Med. 366, 883–892. 10.1056/NEJMoa1113205. - DOI - PMC - PubMed
    1. Bissell MJ, Kenny PA, and Radisky DC (2005). Microenvironmentalregulators of tissue structure and function also regulate tumor induction and progression: the role of extracellular matrix and its degrading enzymes. Cold Spring Harb. Symp. Quant. Biol. 70, 343–356. 10.1101/sqb.2005.70.013. - DOI - PMC - PubMed

Publication types

LinkOut - more resources