. 2023 Jul 18;4(7):101092.
doi: 10.1016/j.xcrm.2023.101092. Epub 2023 Jun 21.

Tumor and local lymphoid tissue interaction determines prognosis in high-grade serous ovarian cancer

Affiliations

Tumor and local lymphoid tissue interaction determines prognosis in high-grade serous ovarian cancer

Haonan Lu et al. Cell Rep Med. .

Abstract

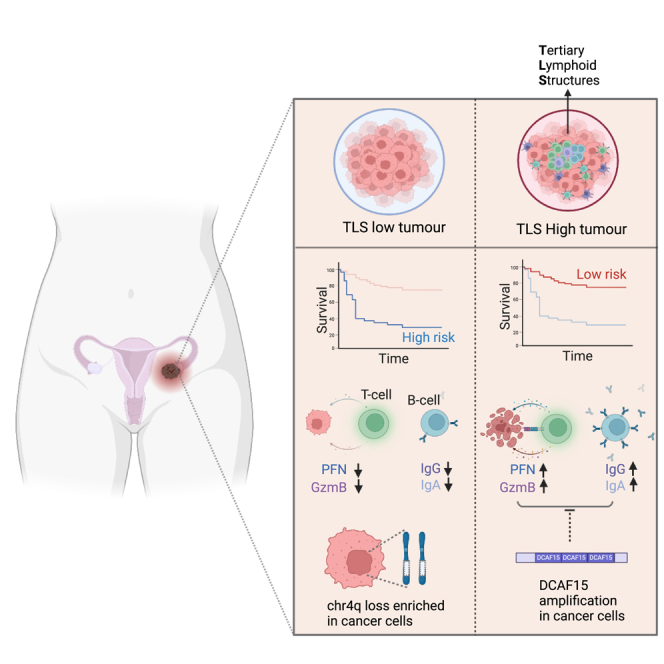
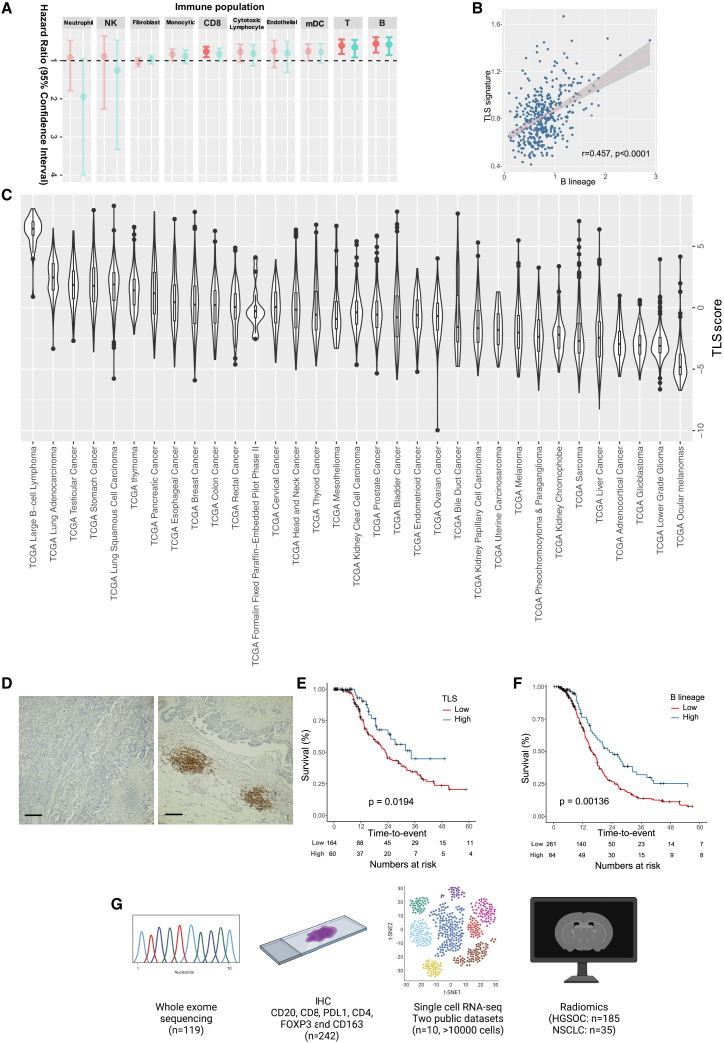
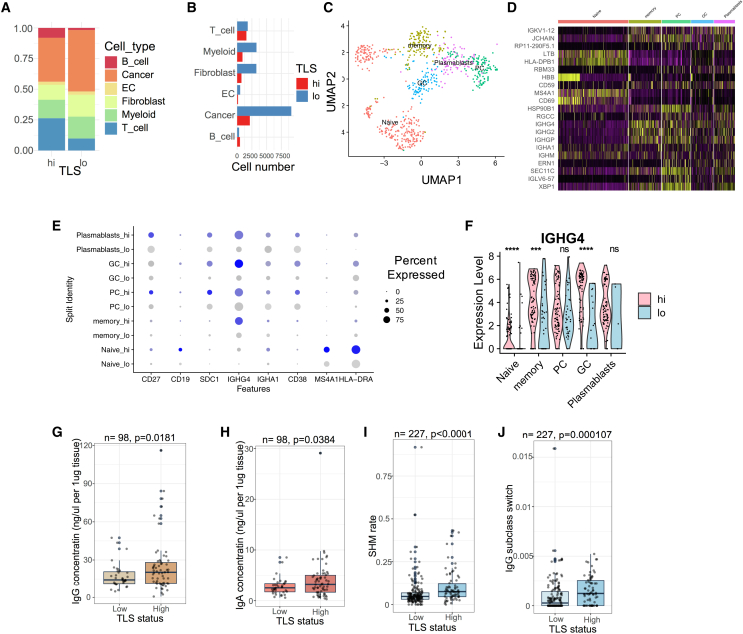
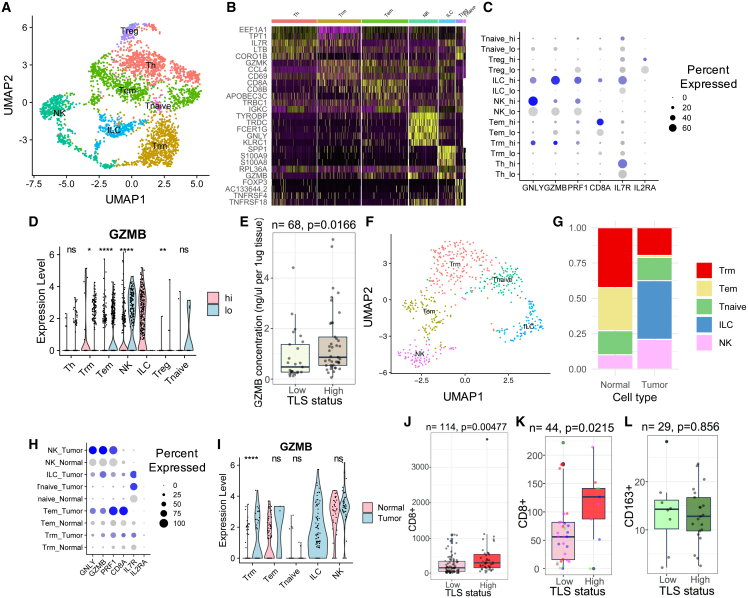
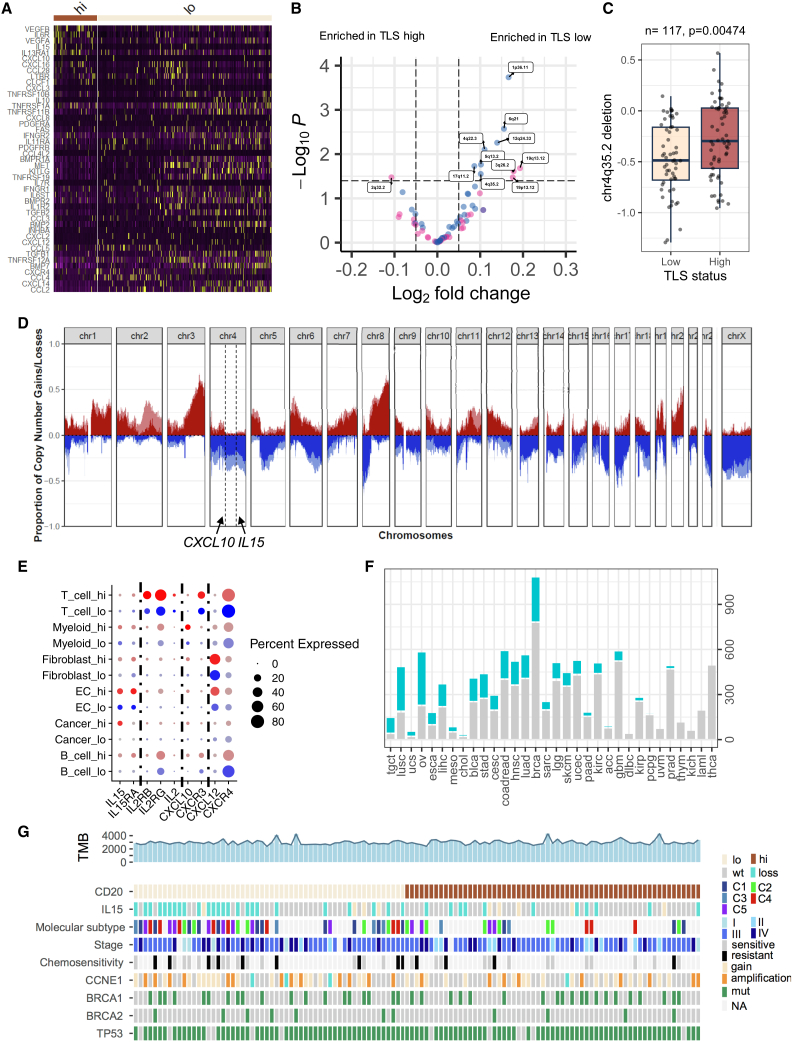
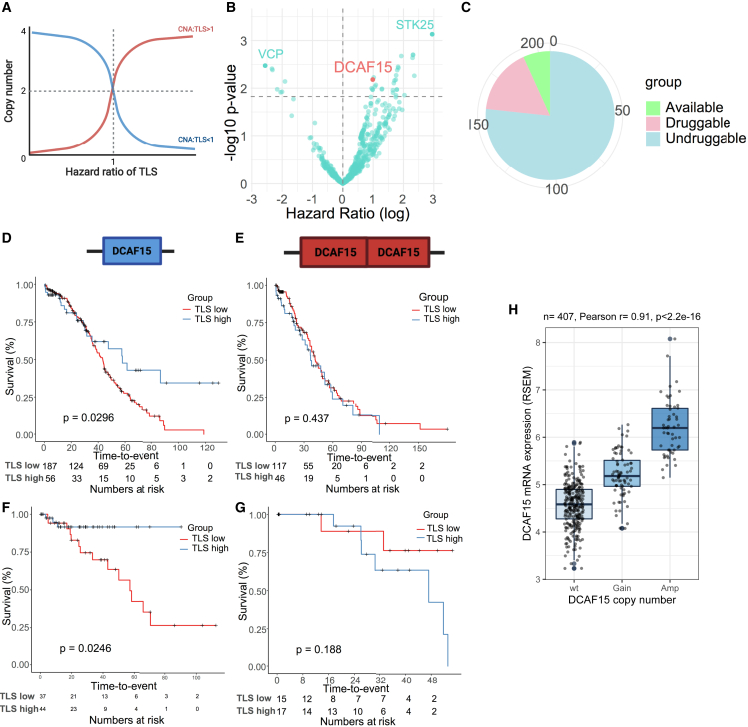
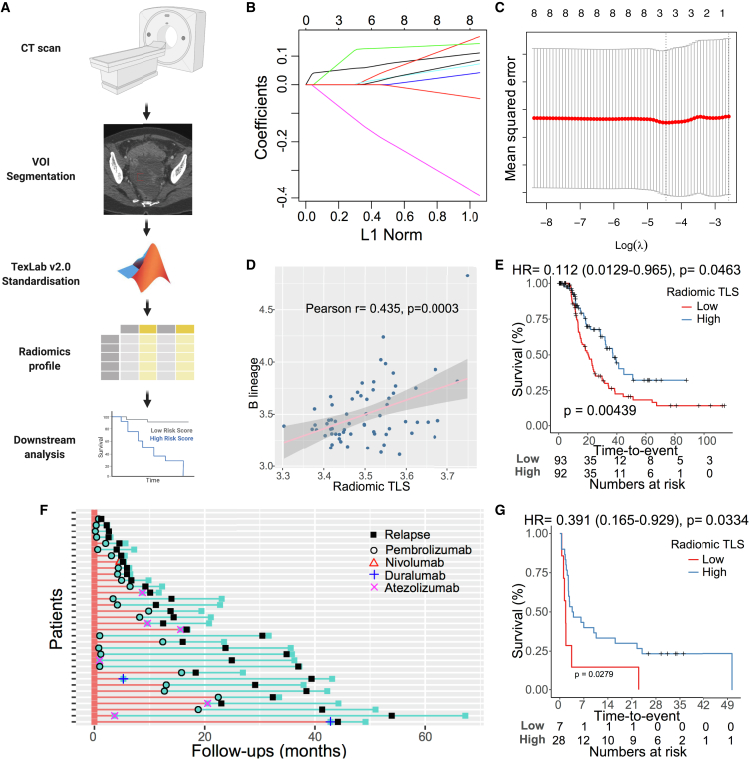
Tertiary lymphoid structure (TLS) is associated with prognosis in copy-number-driven tumors, including high-grade serous ovarian cancer (HGSOC), although the function of TLS and its interaction with copy-number alterations in HGSOC are not fully understood. In the current study, we confirm that TLS-high HGSOC patients show significantly better progression-free survival (PFS). We show that the presence of TLS in HGSOC tumors is associated with B cell maturation and cytotoxic tumor-specific T cell activation and proliferation. In addition, the copy-number loss of IL15 and CXCL10 may limit TLS formation in HGSOC; a list of genes that may dysregulate TLS function is also proposed. Last, a radiomics-based signature is developed to predict the presence of TLS, which independently predicts PFS in both HGSOC patients and immune checkpoint inhibitor (ICI)-treated non-small cell lung cancer (NSCLC) patients. Overall, we reveal that TLS coordinates intratumoral B cell and T cell response to HGSOC tumor, while the cancer genome evolves to counteract TLS formation and function.

Keywords: CNA; ovarian cancer; radiomics; tertiary lymphoid structures.


Conflict of interest statement

Declaration of interests D.J.P. has received lecture fees from ViiV Healthcare, Bayer Healthcare, BMS, Roche, EISAI, and Falk Foundation; travel expenses from BMS and Bayer Healthcare; consulting fees from Mina Therapeutics, EISAI, Roche, Avamune, Exact Sciences, Mursla, DaVolterra, and Astra Zeneca; and research funding (to institution) from MSD and BMS.

Figures

None
Graphical abstract
Figure 1
Figure 1
Prognostic impact of tertiary lymphoid structures in ovarian cancer (A) Summary of prognostic potential of immune cell subpopulations in TCGA ovarian cancer cohort. Hazard ratio of progression-free survival is plotted on the x axis, in a univariate Cox regression model (light blue) and multivariable Cox regression model (red); n = 345. Statistically significant association is shown in darker colors. (B) Correlation between B cells and TLS markers in TCGA cohort. (C) TLS abundance across cancer types in TCGA cohort. (D) Immunohistochemistry staining of CD20 in TLS-low (left) and TLS-high (right) ovarian tumor tissues. Scale bar indicates 200 μm. (E and F) Kaplan-Meier plots of TLS and progression-free survival in (E) HH cohort and (F) TCGA cohort. (G) Overview of the study. Whole-exome sequencing to define mutational and copy-number profiles; immunohistochemistry for immune markers and radiomics profile are collected from HH cohort; two public single-cell RNA-sequencing datasets are reanalyzed. The TLS signature is derived from the B lineage from MCPcounter.
Figure 2
Figure 2
Function of B cells within tertiary lymphoid structures in ovarian cancer (A and B) (A) Proportions and (B) cell numbers of cell subtypes in TLS-low (n = 3; 18,354 cells) ovarian tumors compared with TLS-high (n = 2; 5,996 cells) ovarian tumors. (C) UMAP showing five B cell subtypes in ovarian tumors. Cell cluster annotation for (C–F): naive cells, memory cells, plasma cells (PCs), germinal center (GC), and plasmablasts. (D) Marker genes in the five B cell subtypes. Yellow indicates high expression and purple indicates low expression. (E) Dot plot showing marker genes in five B cell subtypes comparing TLS-high with TLS-low tumors. Blue represents cells from the TLS-high group, gray represents cells from the TLS-low group. (F) IGHG4 expression across B cell subtypes. The p-values are given by Wilcoxon rank-sum test. ∗∗∗∗p < 0.0001; ∗∗∗p < 0.001; ns, p > 0.05. (G and H) Concentrations of ovarian tumor-derived (G) IgG and (H) IgA comparing TLS-high (n = 63) with TLS-low tumors (n = 35) from the HH cohort. (I and J) (I) Somatic hypermutation of CDR3 sequences and (J) IgG3-to-IgG1 subclass switching rate comparing TLS-high (n = 57) with TLS-low tumors (n = 170) in the TCGA ovarian cancer cohort. For (G)–(J), the p values are given by two-tailed t test. For boxplot, elements are defined as follows: the center line indicates median value, box limits indicate upper and lower quartiles, whiskers extend to 1.5× the interquartile range, and points beyond the whiskers are outliers.
Figure 3
Figure 3
Function of T cells within tertiary lymphoid structures in ovarian cancer (A) UMAP showing seven T cell subpopulations in ovarian tumors. Cell cluster annotation for (A–D): CD4+ T helper cells (Th), CD8+ T resident memory (Trm), effector memory T cells (Tem), NK cells (NK), CD4+ GZMB+ (ILC), regulatory T cells (Treg), and CD4+ IL-7R+ naive T cells (Tnaive). (B) Marker genes in the seven T cell subpopulations. (C) Dot plot showing marker genes in T cell subpopulations comparing TLS-high with TLS-low tumors. (D) GZMB expression in T cell subpopulations comparing TLS-high with TLS-low tumors. The p-values are given by Wilcoxon rank-sum test. (E) GZMB concentration comparing TLS-high (n = 44) with TLS-low tumors (n = 24) from HH cohort. (F) UMAP showing five T cell subpopulations in ovarian tumors and adjacent non-malignant tissues. Cell cluster annotation for (F–I): CD8+ T resident memory (Trm), effector memory T cells (Tem), NK cells (NK), CD4+ GZMB+ (ILC), and CD4+ IL-7R+ naive T cells (Tnaive). (G) Proportions of T cell subpopulations comparing ovarian tumors with adjacent non-malignant tissues. (H) Dot plot showing marker gene expression in tumor and non-malignant tissues. (I) GZMB expression in T cell subpopulations comparing tumor with non-malignant tissues. The p-values are given by Wilcoxon rank-sum test. (J) Numbers of CD8+ T cells that infiltrated TLS-high ovarian tumors (n = 41) compared with TLS-low ovarian tumors (n = 73) in the HH cohort. Non-TLS CD8+ T cells were measured. (K) Numbers of CD8+ T cells in TLS-high (n = 10) sections compared with paired TLS-low (n = 34) sections from the same ovarian cancer cases. (L) Numbers of CD163+ cells in TLS-high tumors (n = 21) compared with TLS-low tumors (n = 8) in the HH cohort. For (J)–(L), the p values are given by two-tailed t test. ∗∗∗∗p < 0.0001; ∗∗p < 0.01; ∗p < 0.05; ns, p > 0.05. For boxplot elements are defined as follows: the center line indicates median value, box limits indicate upper and lower quartiles, whiskers extend to 1.5× the interquartile range, and points beyond the whiskers are outliers.
Figure 4
Figure 4
Copy-number alterations dysregulate tertiary lymphoid structure formation (A) Heatmap showing differentially expressed genes involved in cytokine signaling comparing cancer cells from TLS-high tumors with those from TLS-low tumors. (B) Volcano plot showing genomic gains and losses associated with TLSs from the TCGA cohort. Significantly enriched genomic regions are labeled (FDR < 0.25). Horizontal line indicates FDR = 0.25. The p-values are given by a moderated t test. Pink, copy number gains; blue, copy number deletions. TLS signature was derived from the B lineage from MCPcounter. (C) Boxplot showing association between chr4q35.2 and TLS status from the HH cohort. The p-value is given by two-tailed t test. TLS low, n = 56; TLS high, n = 61. (D) Proportion of copy-number alterations comparing TLS-high tumors (dark red and dark blue) with TLS-low tumors (light red and light blue) in the HH cohort. The genomic locations of CXCL10 and IL15 are indicated; x axis, chromosome number; y axis, proportion of copy-number gain (red, 0 to 1) and loss (blue, 0 to −1). (E) Dot plot showing cytokines and their receptor expression in cell subtypes. Dot color: red, cells in the TLS-high group; blue, cells in the TLS-low group. Dot size represents percentage of cells expressing the gene. (F) Number of tumors containing IL15 deletion across cancer types; x axis, number of cases; cyan, cases with partial IL15 deletion; gray, cases without IL15 loss. (G) Heatmap showing IL15 deletion and clinical phenotypes associated with TLS in the HH cohort. TMB, tumor mutational burden.
Figure 5
Figure 5
Identification of TLS-interacting CNA targets in ovarian cancer (TICTOC) (A) The association between CNA and hazard ratio of TLS when can/TLS interaction is greater than 1 (red) or less than 1 (blue). (B) Volcano plot showing CNAs that are statistically interacting with TLS in the multivariable Cox regression model for overall survival in the TCGA cohort. (C) Potential druggability of TICTOC targets. (D–G) Kaplan-Meier plots showing association between TLS and overall survival when DCAF15 is not amplified in (D) the TCGA cohort and (F) the HH cohort and when DCAF15 is amplified in (E) the TCGA cohort and (G) the HH cohort. The p-values are given by log rank test. (H) Correlation between DCAF15 expression and its copy-number alterations in the TCGA ovarian cancer cohort. Boxplot elements are defined as follows: the center line indicates median value, box limits indicate upper and lower quartiles, whiskers extend to 1.5× the interquartile range, and points beyond the whiskers are outliers.
Figure 6
Figure 6
Radiomics signature predicts tertiary lymphoid structure (A) Workflow of radiomics analysis. Tumors in standard-of-care CT images are segmented by an experienced radiologist. The segmented images are normalized and used as input for TexLab 2.0. Radiomics profiles are then used to build the predictive model. (B) The coefficients of radiomics features (y axis) and number of features included in each model (upper x axis) are plotted against shrinkage parameter (lambda). (C) Mean-squared error of each model after 10-fold cross-validation is plotted against lambda in log ratio. (D) Correlation between radiomic TLS score and B cells in the TCGA cohort. Pearson’s correlation coefficient and p value are given. (E) Kaplan-Meier plot of radiomic TLS score associated with progression-free survival in the HH cohort. The p-value is given by log rank test. (F) Summary of patient response to immunotherapy in the HH NSCLC cohort. (G) Kaplan-Meier plot of radiomic TLS score associated with progression-free survival in response to immunotherapy in the HH NSCLC cohort. The p-value is given by log rank test.

References

    1. Brahmer J.R., Tykodi S.S., Chow L.Q.M., Hwu W.J., Topalian S.L., Hwu P., Drake C.G., Camacho L.H., Kauh J., Odunsi K., et al. Safety and activity of anti-PD-L1 antibody in patients with advanced cancer. N. Engl. J. Med. 2012;366:2455–2465. doi: 10.1056/NEJMoa1200694. - DOI - PMC - PubMed
    1. Hamanishi J., Mandai M., Ikeda T., Minami M., Kawaguchi A., Murayama T., Kanai M., Mori Y., Matsumoto S., Chikuma S., et al. Safety and antitumor activity of anti-PD-1 antibody, Nivolumab, in patients with platinum-resistant ovarian cancer. J. Clin. Oncol. 2015;33:4015–4022. doi: 10.1200/Jco.2015.62.3397. - DOI - PubMed
    1. Disis M.L., Patel M.R., Pant S., Infante J.R., Lockhart A.C., Kelly K., Beck J.T., Gordon M.S., Weiss G.J., Ejadi S., et al. Avelumab (MSB0010718C), an anti-PD-L1 antibody, in patients with previously treated, recurrent or refractory ovarian cancer: a phase Ib, open-label expansion trial. J. Clin. Oncol. 2015;33:5509. doi: 10.1200/jco.2015.33.15_suppl.5509. - DOI
    1. Varga A., Piha-Paul S.A., Ott P.A., Mehnert J.M., Berton-Rigaud D., Johnson E.A., Cheng J.D., Yuan S., Rubin E.H., Matei D.E. Antitumor activity and safety of pembrolizumab in patients (pts) with PD-L1 positive advanced ovarian cancer: interim results from a phase Ib study. J. Clin. Oncol. 2015;33:5510. doi: 10.1200/jco.2015.33.15_suppl.5510. - DOI
    1. The Cancer Genome Atlas Research Network. Berchuck A., Birrer M., Chien J., Cramer D.W., Dao F., Dhir R., DiSaia P., Gabra H., Glenn P., et al. Integrated genomic analyses of ovarian carcinoma. Nature. 2011;474:609–615. - PMC - PubMed

Publication types