. 2023 Jul 10;33(13):2742-2760.e12.
doi: 10.1016/j.cub.2023.05.064. Epub 2023 Jun 21.

Input density tunes Kenyon cell sensory responses in the Drosophila mushroom body

Affiliations

Input density tunes Kenyon cell sensory responses in the Drosophila mushroom body

Maria Ahmed et al. Curr Biol. .

Abstract

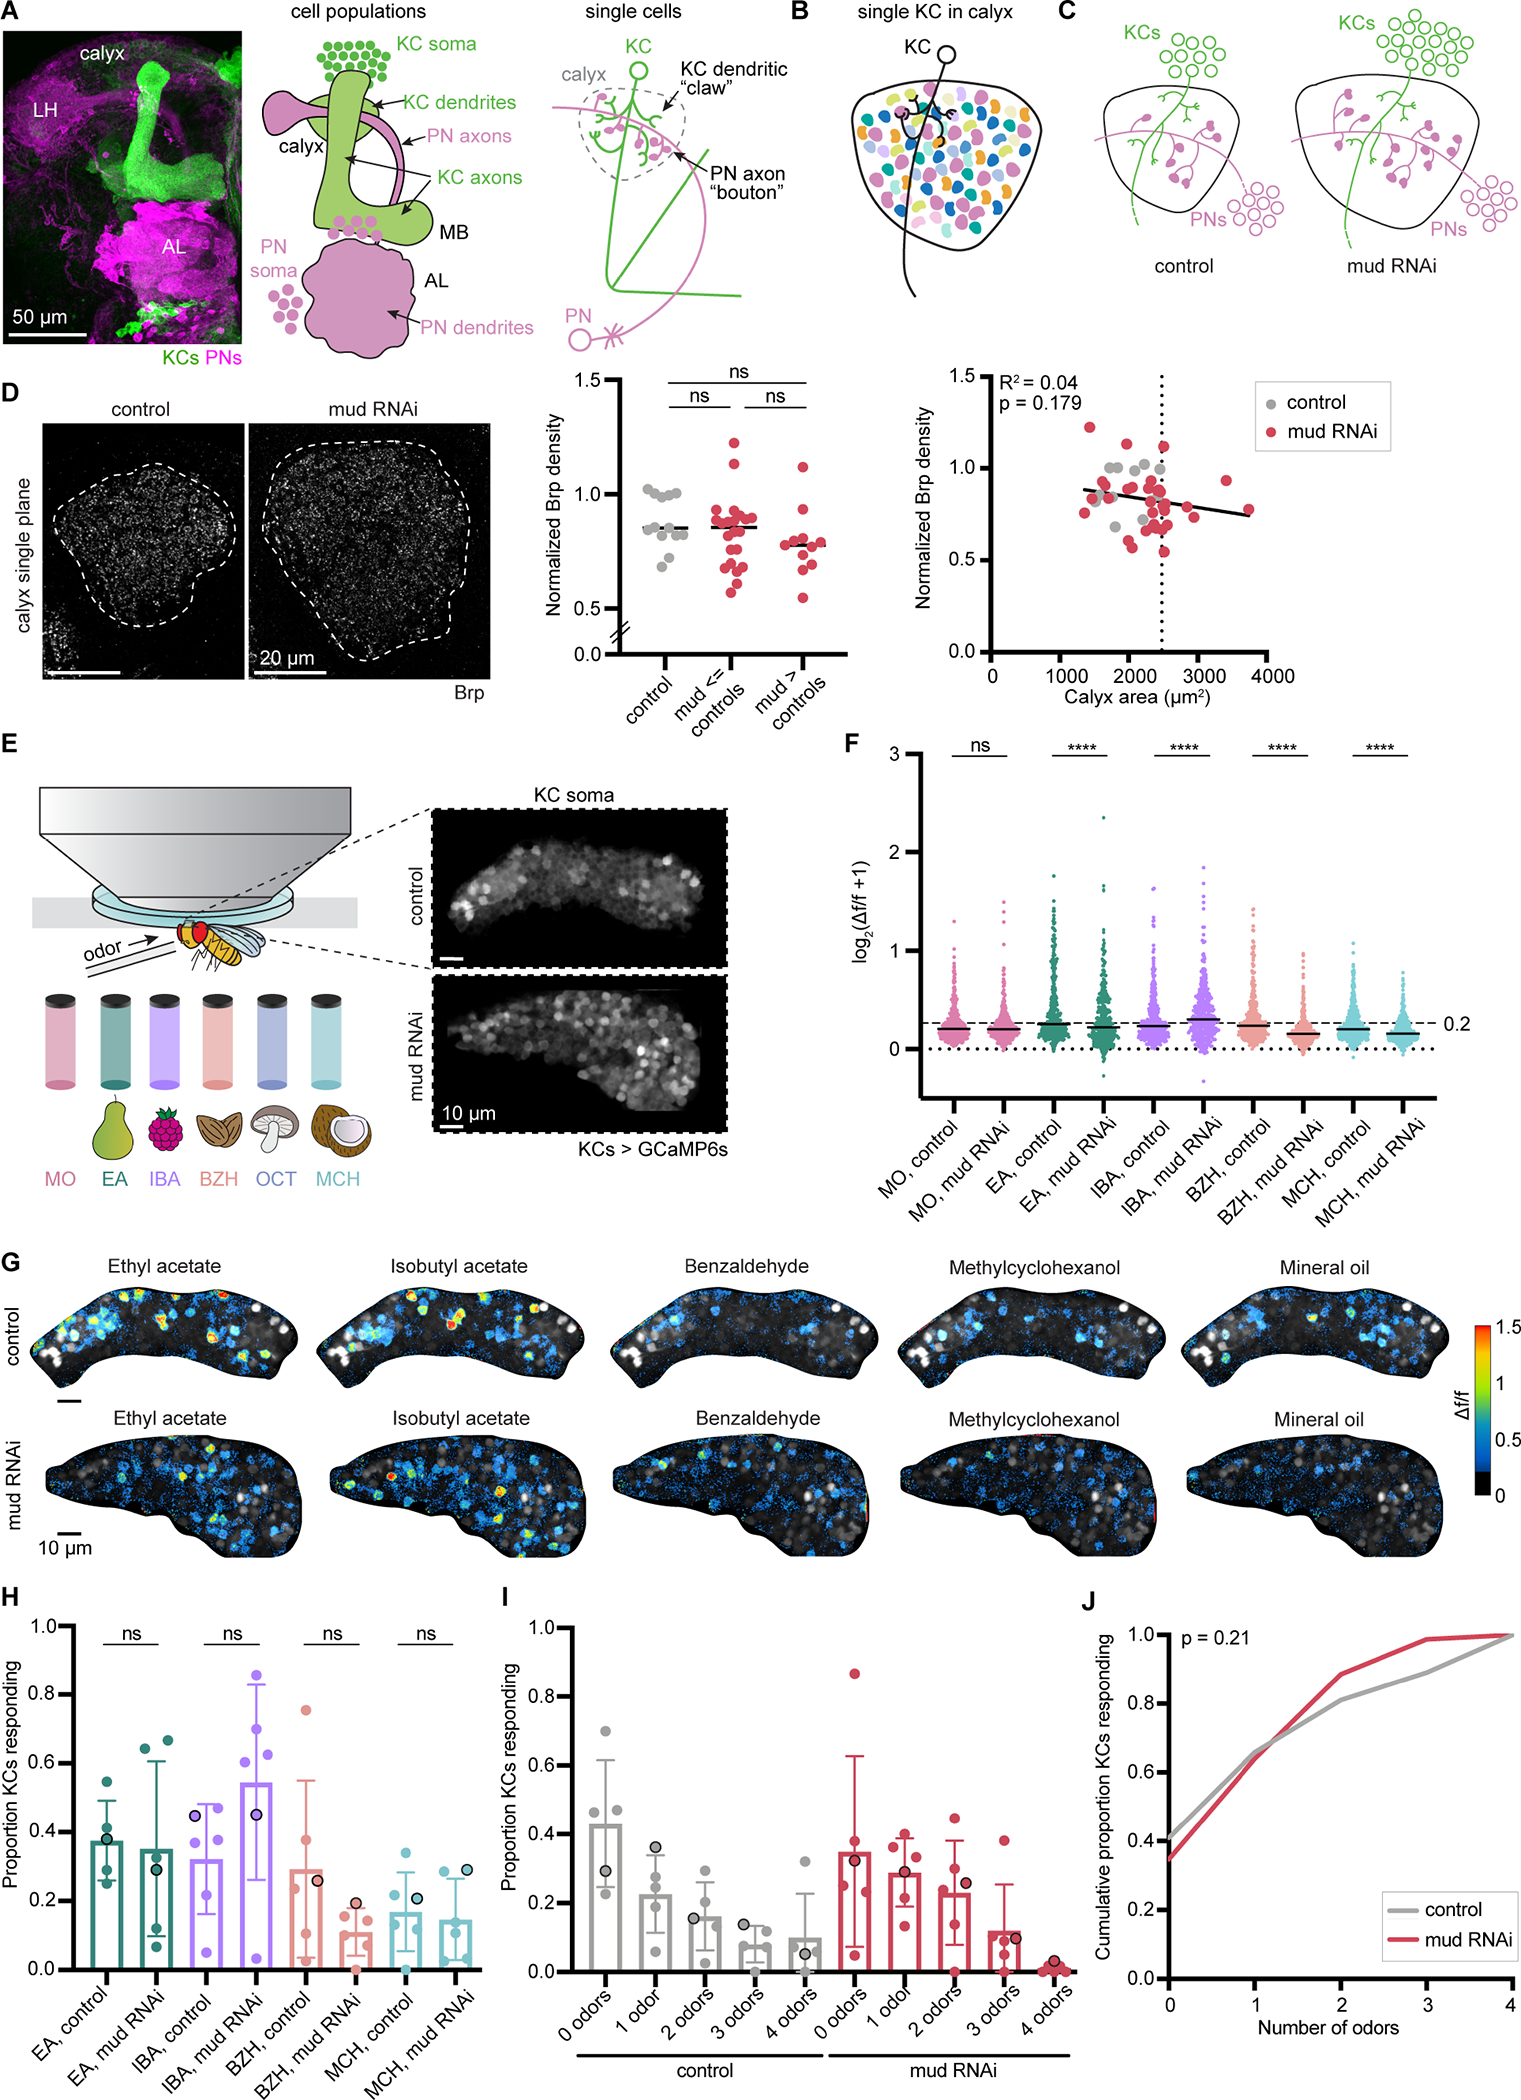
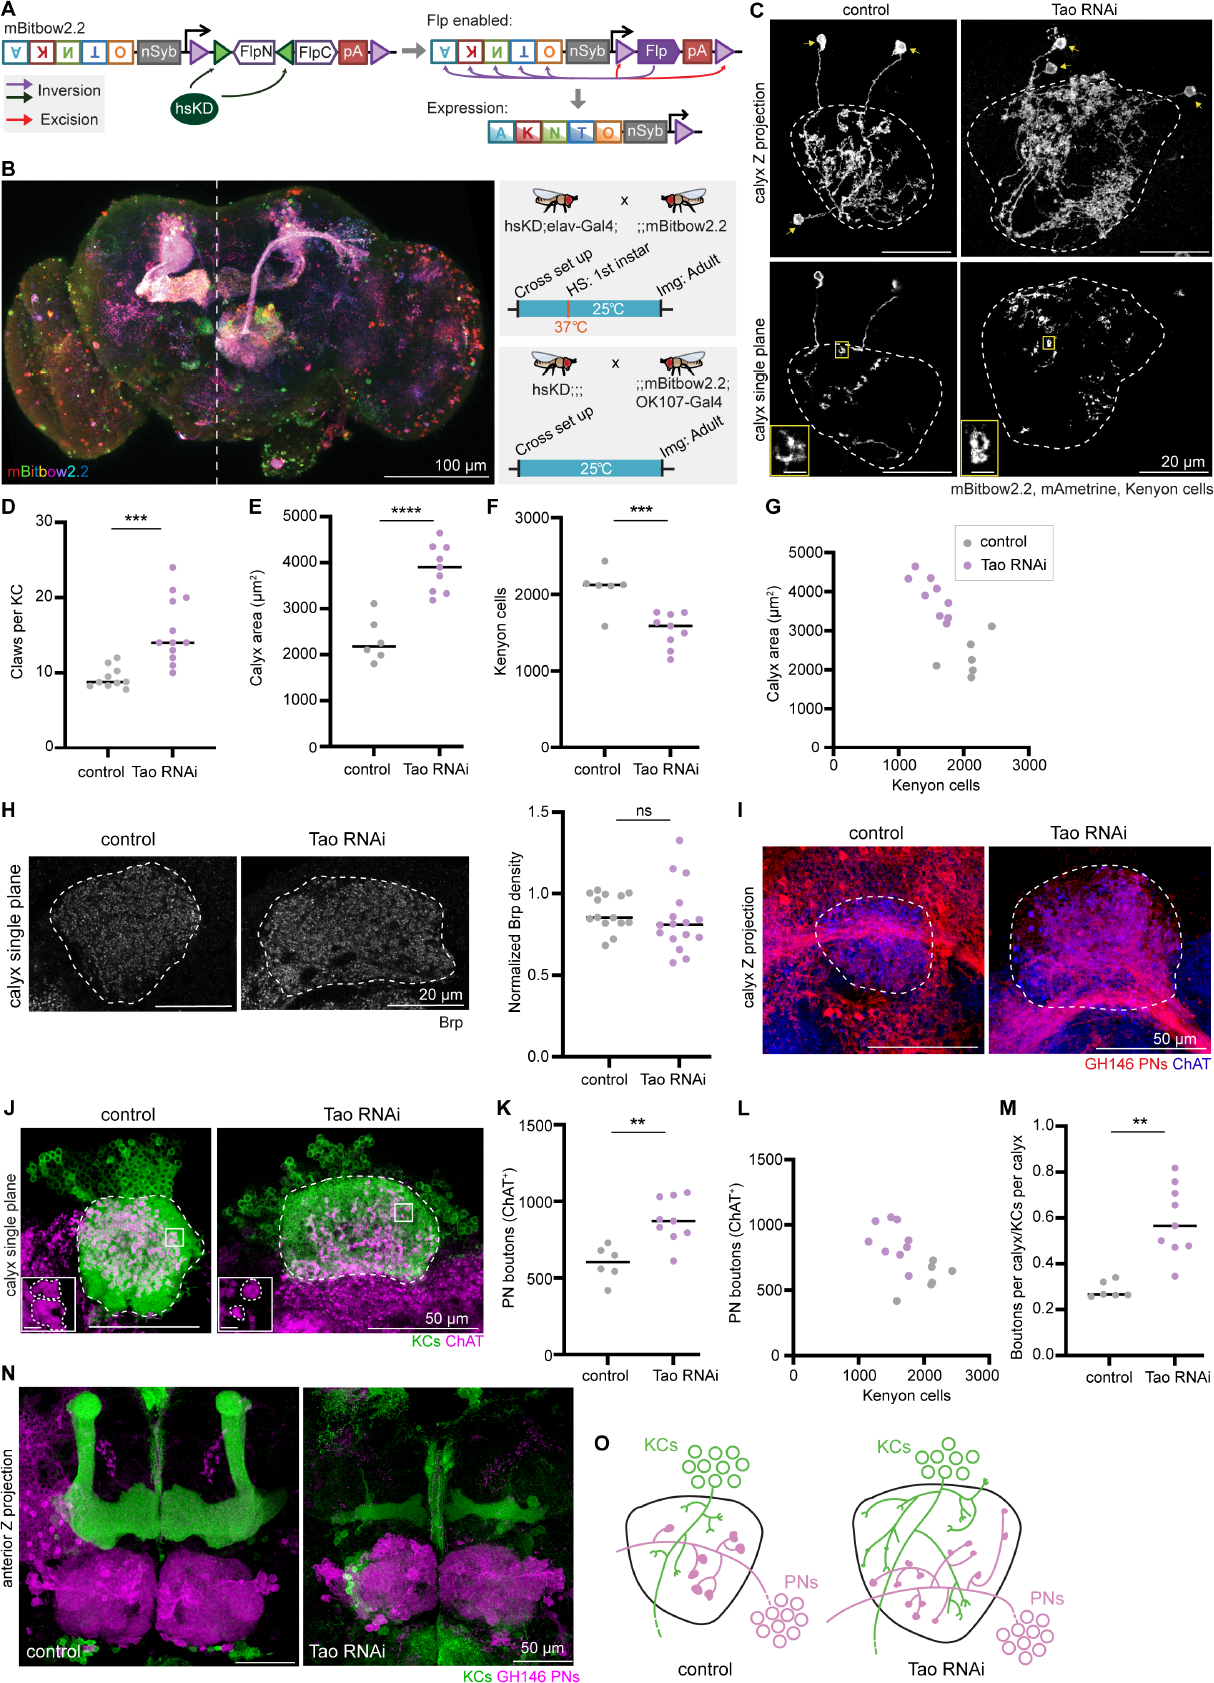
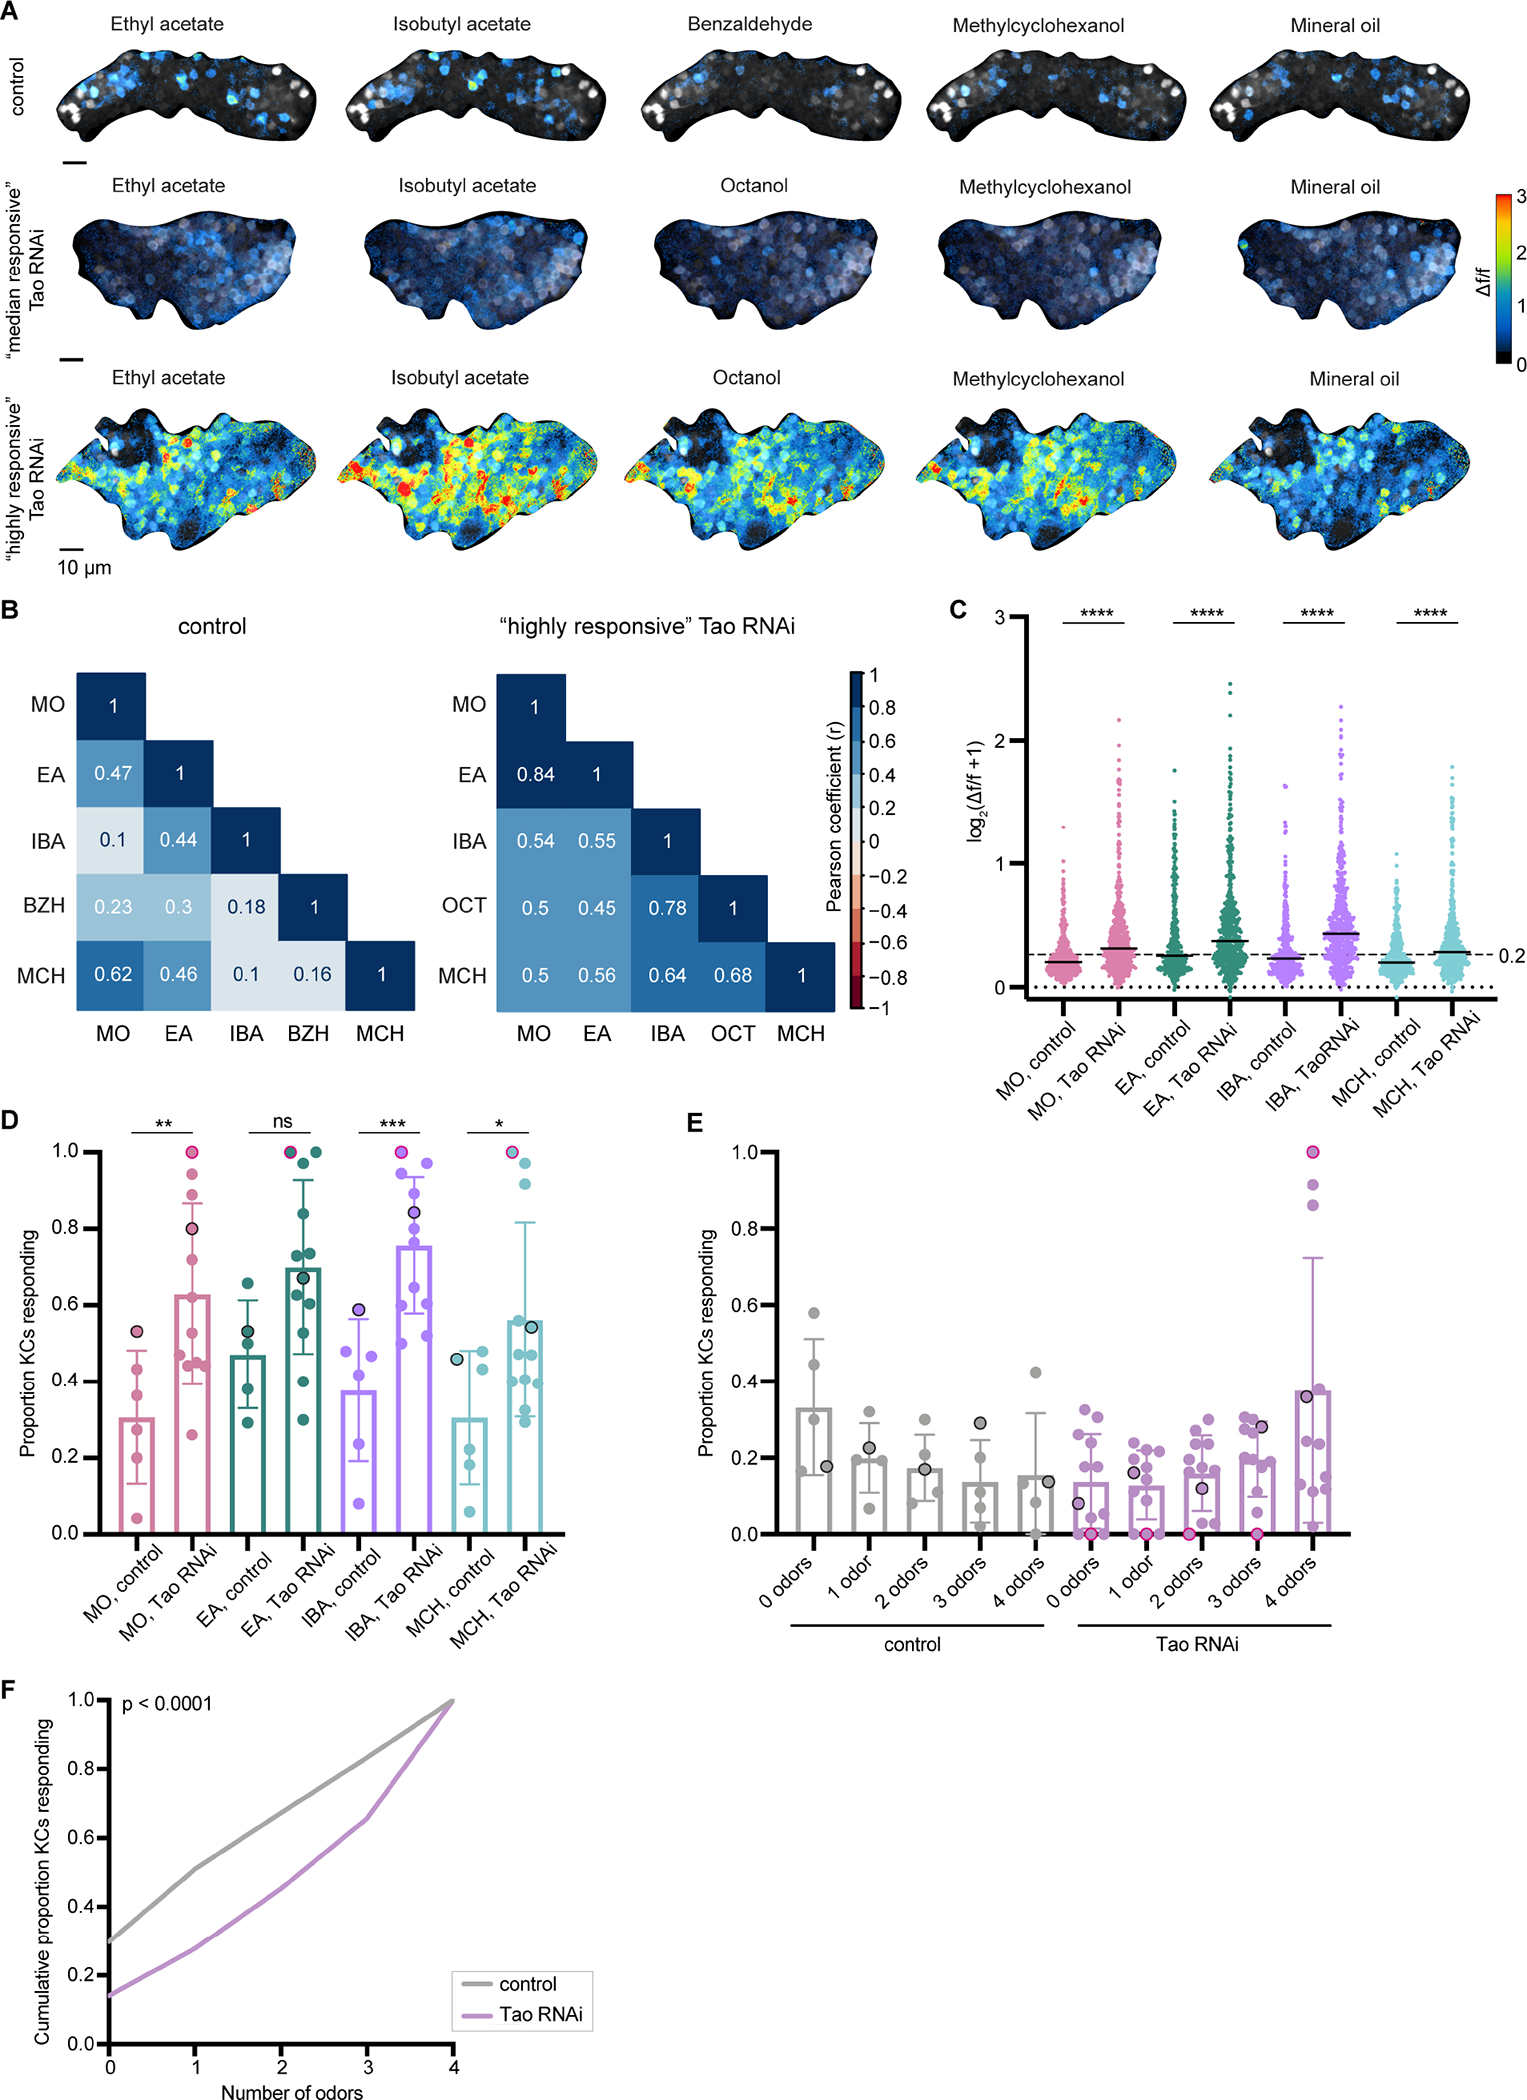
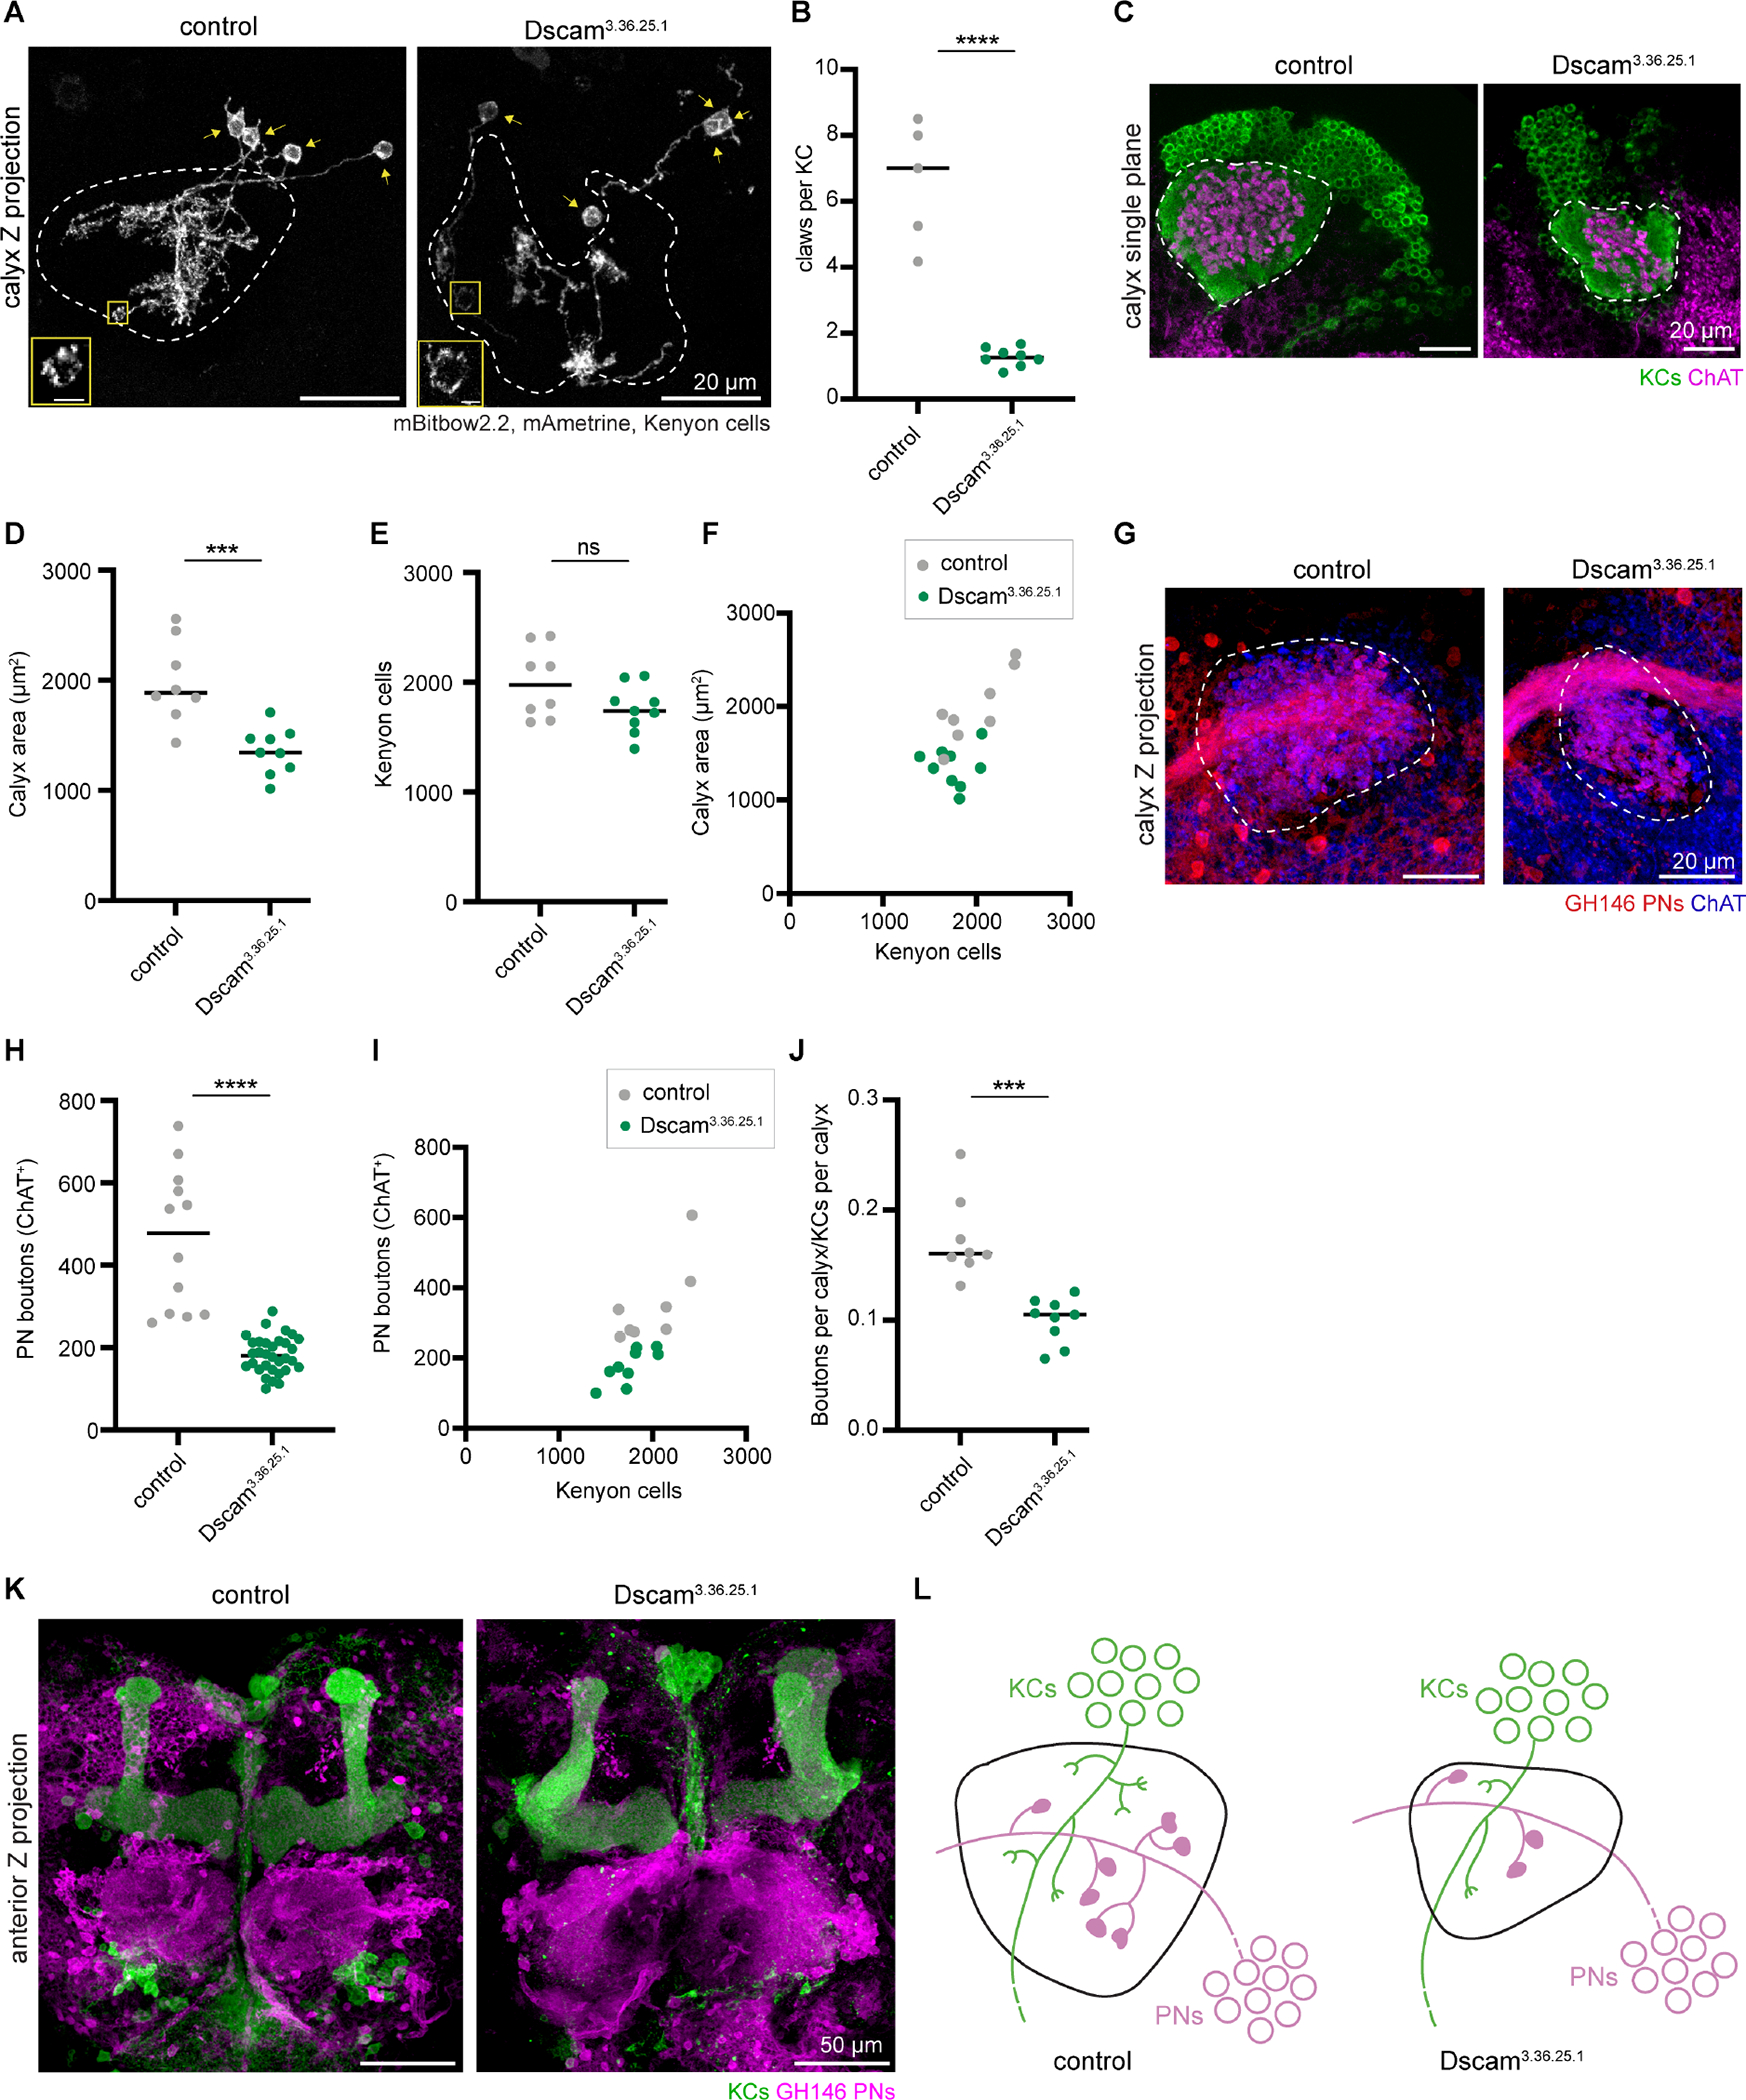
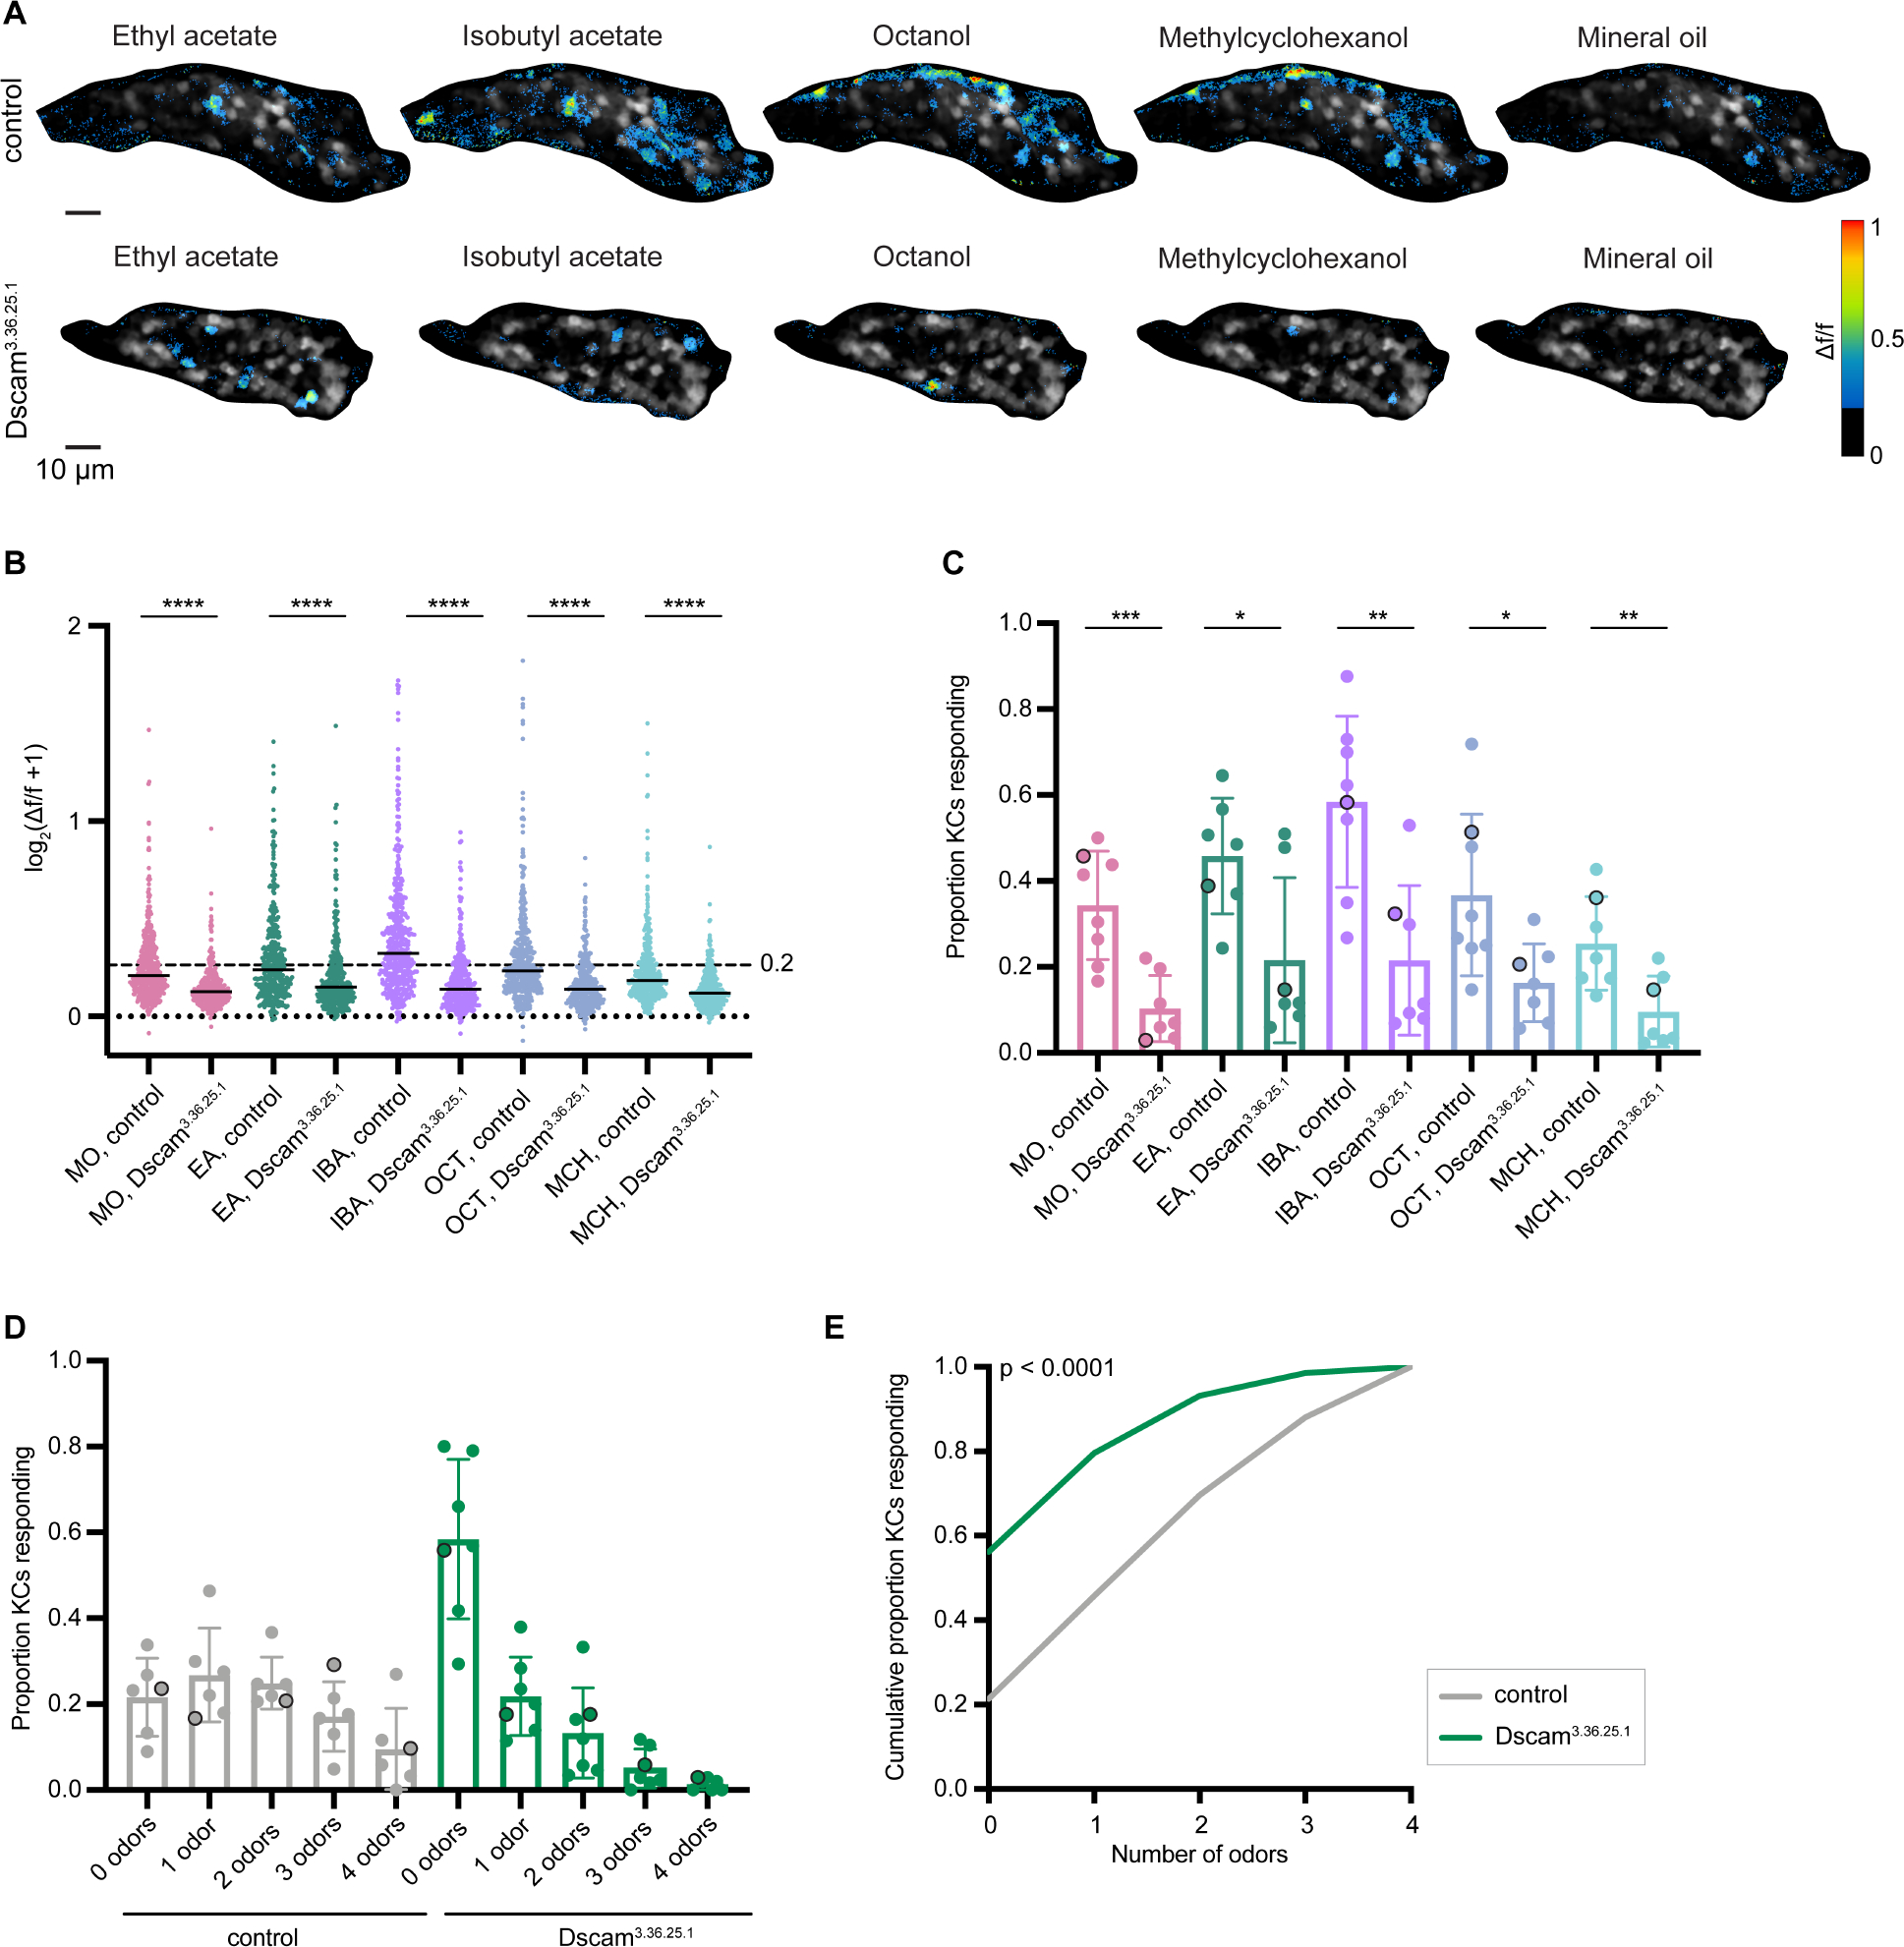
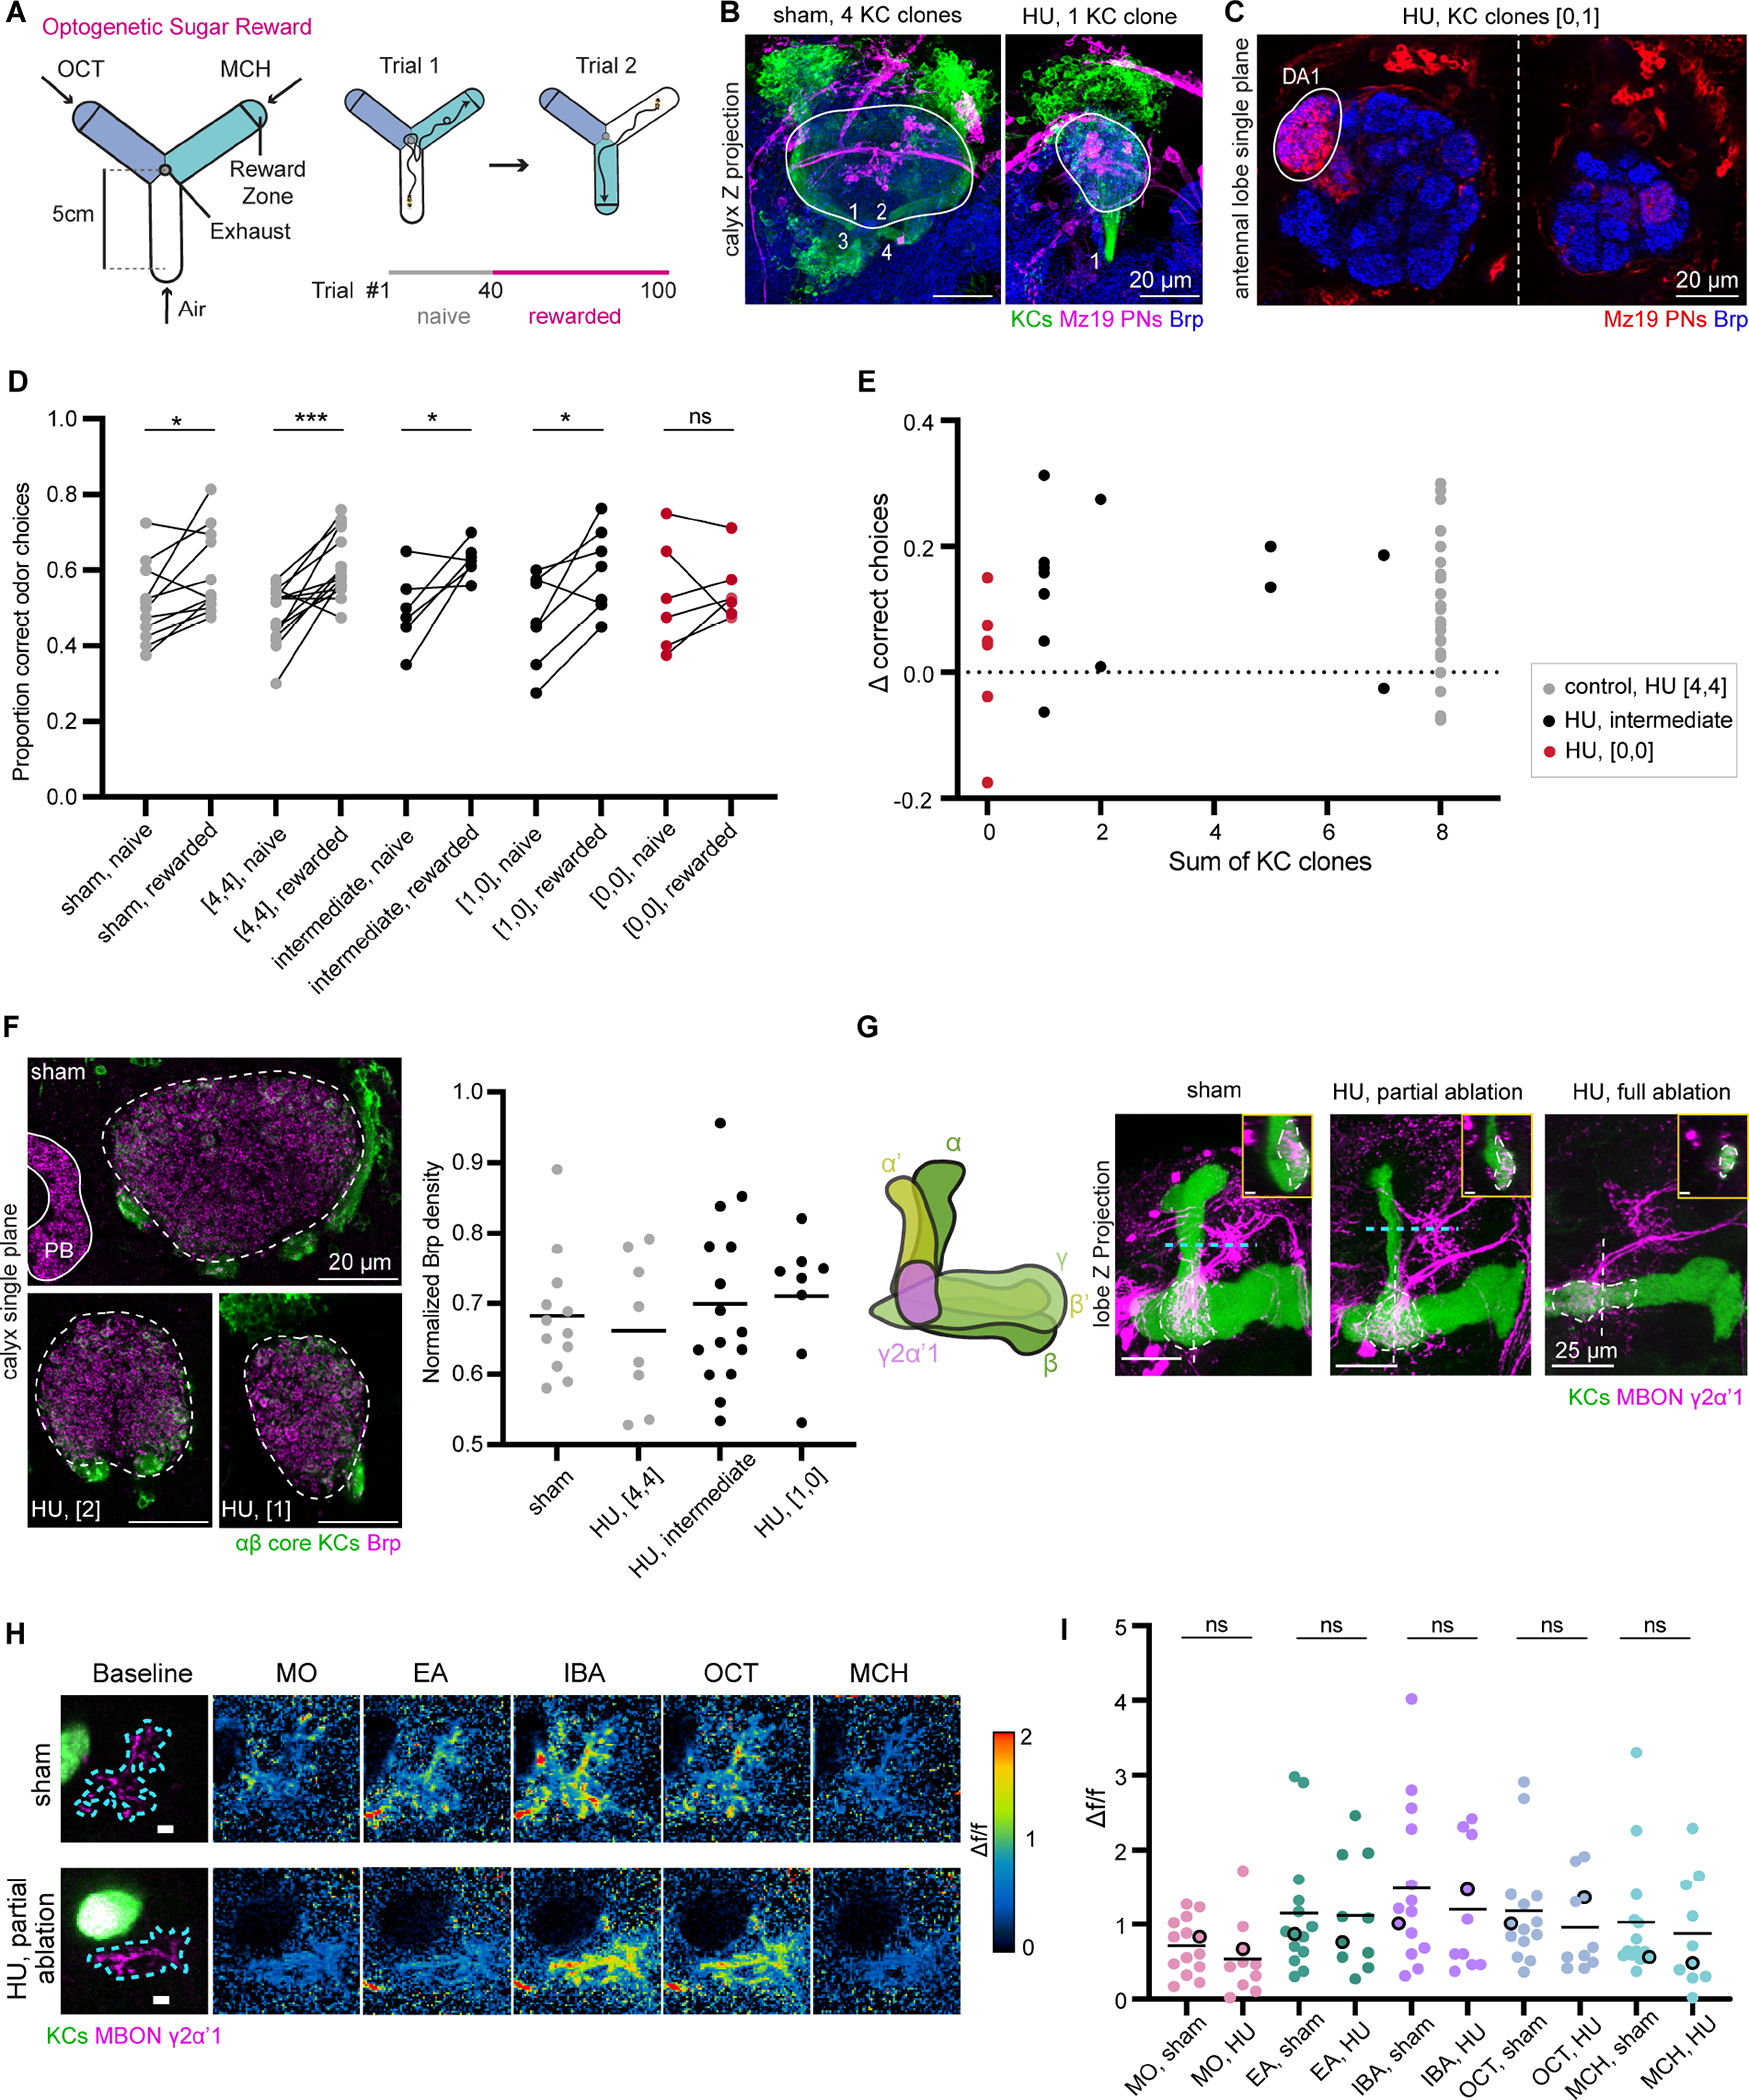
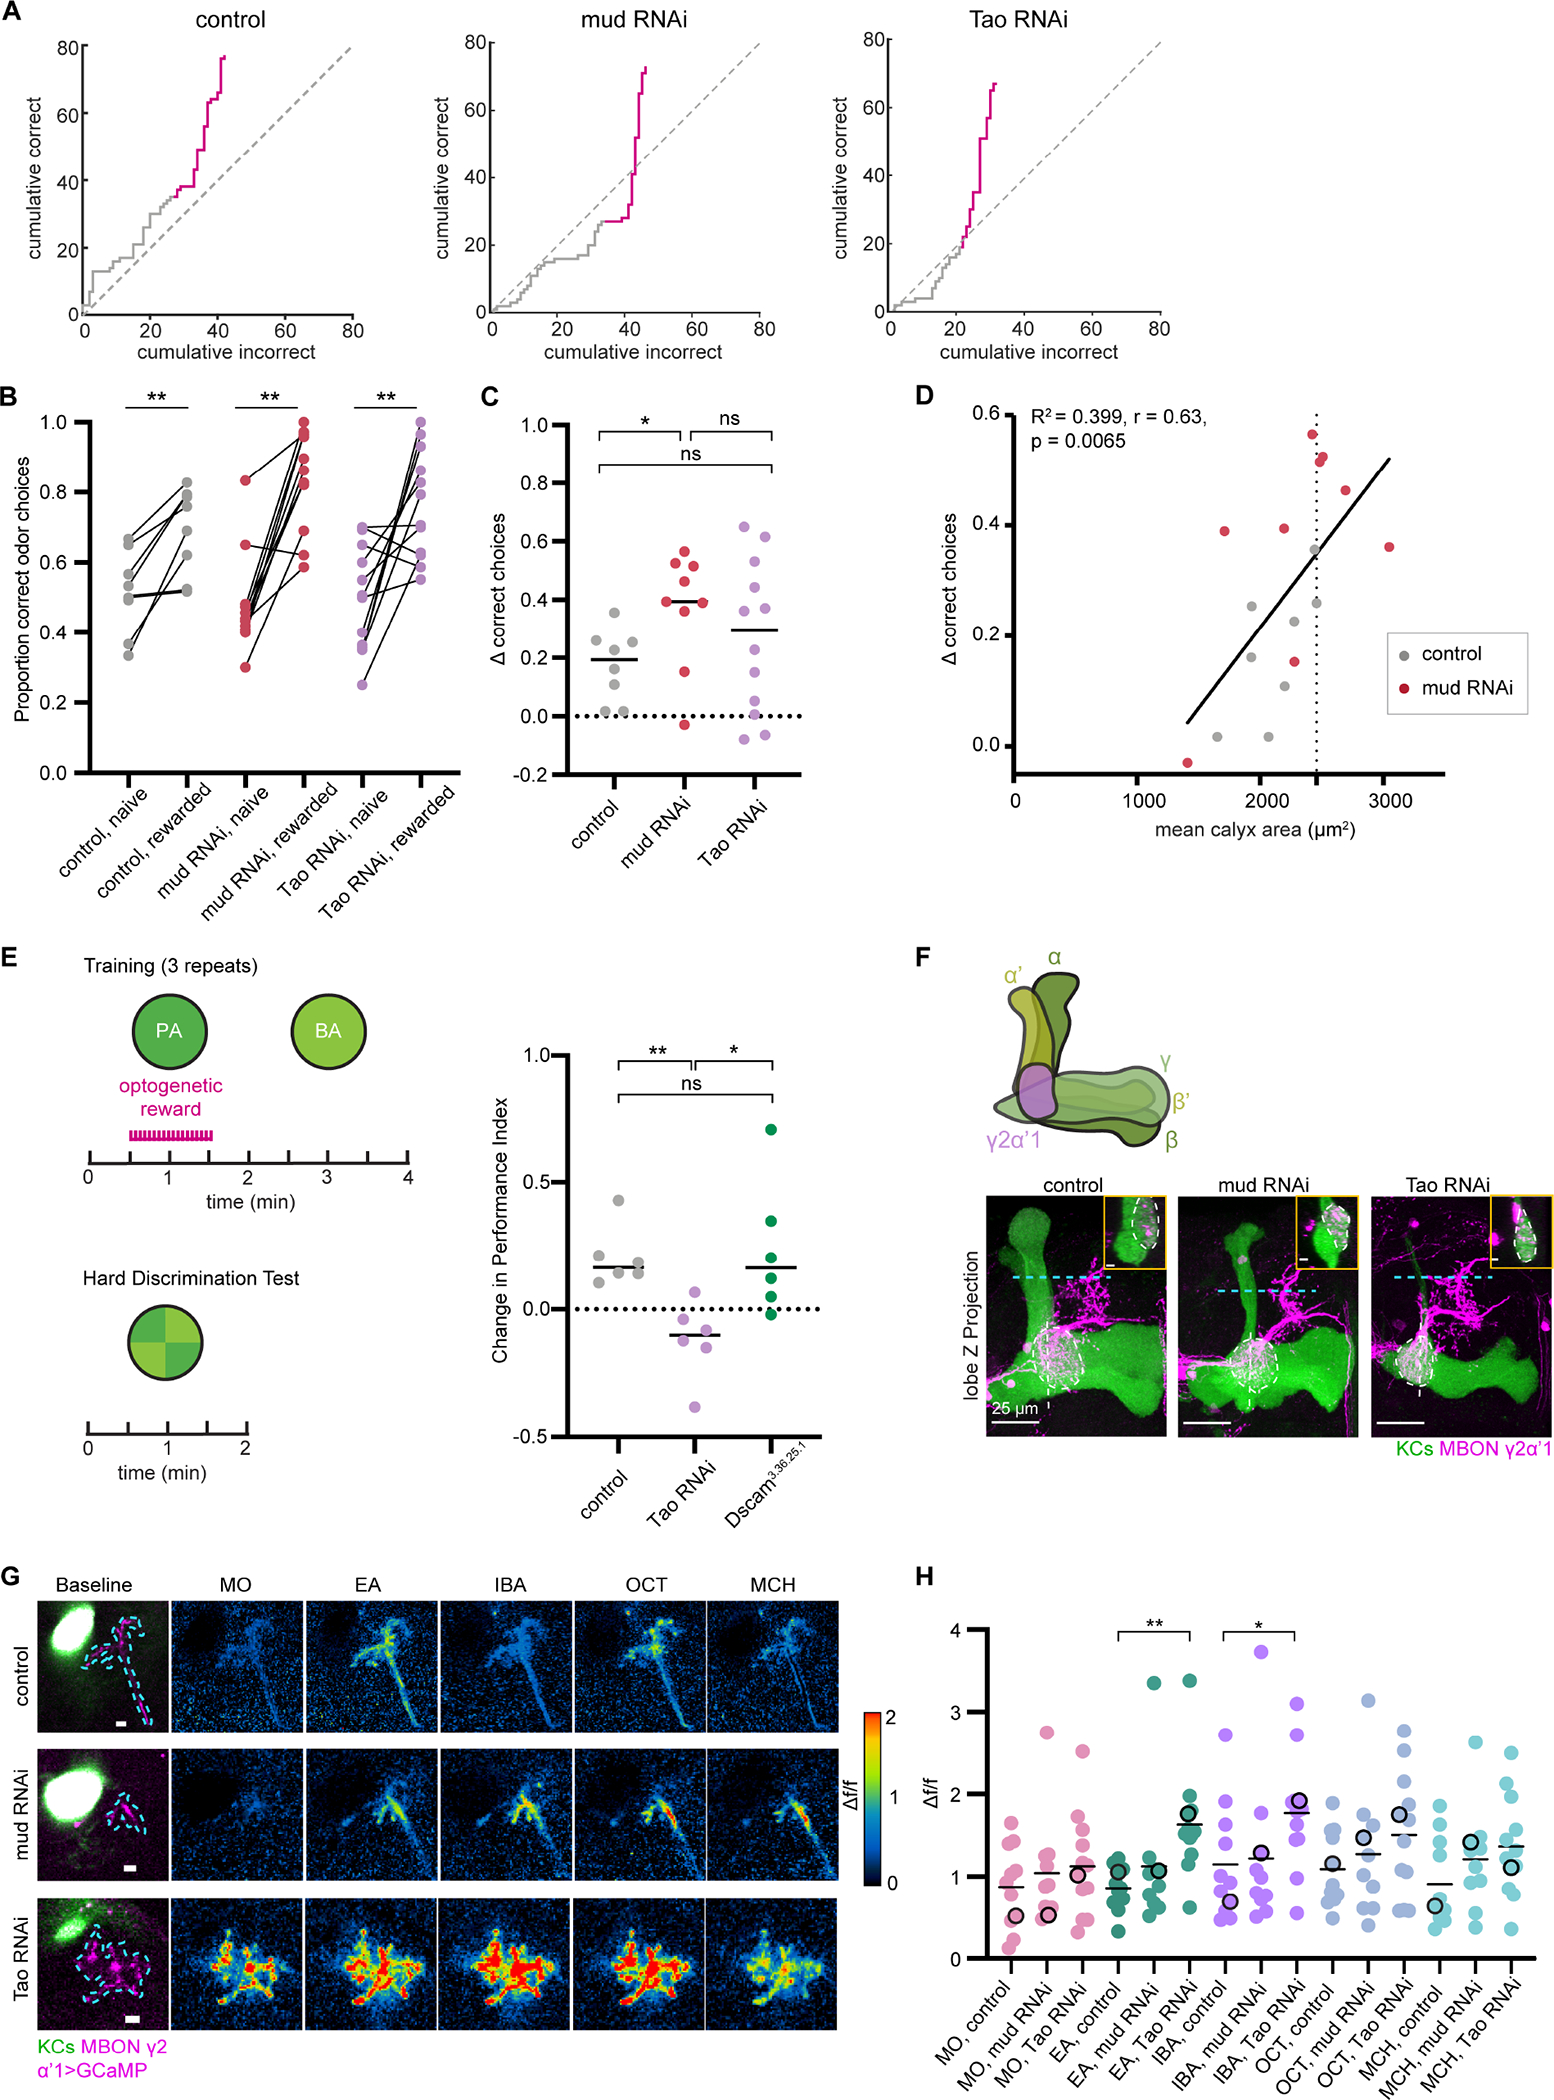
The ability to discriminate sensory stimuli with overlapping features is thought to arise in brain structures called expansion layers, where neurons carrying information about sensory features make combinatorial connections onto a much larger set of cells. For 50 years, expansion coding has been a prime topic of theoretical neuroscience, which seeks to explain how quantitative parameters of the expansion circuit influence sensory sensitivity, discrimination, and generalization. Here, we investigate the developmental events that produce the quantitative parameters of the arthropod expansion layer, called the mushroom body. Using Drosophila melanogaster as a model, we employ genetic and chemical tools to engineer changes to circuit development. These allow us to produce living animals with hypothesis-driven variations on natural expansion layer wiring parameters. We then test the functional and behavioral consequences. By altering the number of expansion layer neurons (Kenyon cells) and their dendritic complexity, we find that input density, but not cell number, tunes neuronal odor selectivity. Simple odor discrimination behavior is maintained when the Kenyon cell number is reduced and augmented by Kenyon cell number expansion. Animals with increased input density to each Kenyon cell show increased overlap in Kenyon cell odor responses and become worse at odor discrimination tasks.

Keywords: Drosophila melangaster; Marr-Albus theory; brain engineering; development; expansion layer; mushroom body; neural network; olfaction; pattern separation.


Conflict of interest statement

Declaration of interests The authors declare no competing interests.

Figures

Figure 1.
Figure 1.. Sparse odor coding is preserved when Kenyon cell numbers are increased.
(A) PNs receive input from olfactory sensory neurons in the antennal lobe (AL) and project to the mushroom body calyx and the lateral horn (LH). In the calyx, KC dendritic “claws” grab PN presynaptic “boutons.” (B) An individual KC receives ~5–6 inputs from PNs innervating diverse AL glomeruli (different colors). (C) Model of the effect of increasing KCs on calyx development, from. (D) Left: Confocal slice of Brp in control and OK107>mud RNAi calyces; circle: maximum cross-sectional area. Middle: Brp density, normalized to protocerebral bridge. Significance: unpaired t-tests. Right: Relation of normalized Brp density to maximum calyx area. Dotted line: cut-off to define Kenyon cell-increased brains (“mud > controls”). Each data point represents a single hemisphere. (E) in vivo functional imaging preparation. Vials contain solvent (mineral oil; MO), ethyl acetate (EA), isobutyl acetate (IBA), benzaldehyde (BZH), octanol (OCT), and methylcyclohexanol (MCH). Responses were imaged from KC soma by GCaMP6s. (F) Peak odor responses of pooled cells across hemispheres. Dashed line: 0.2 Δf/f threshold. Black horizontal bars: medians. Significance: Mann-Whitney test. n = 349–405 cells (control), 341 cells (mud RNAi) for each stimulus. Here and throughout, *: p<0.05; **: p<0.01; ***: p<0.001; ****: p<0.0001; ns: non-significant. (G) Representative images of KC somatic odor responses in control and increased-KC hemisphere. Grayscale backdrop indicates the cells. See also Figure S1A. (H, I) Proportion of cells in each hemisphere responding to each stimulus (Δf/f >0.2) (H), and proportion responding to 0, 1 or multiple odors (I). Significance: unpaired t-test. Bar plots in (H, I) show mean ± SD. Circled points highlight the hemispheres shown in (G). (J) Mean cumulative proportion of cells responding from 0–4 odors, pooled from all control (gray; n = 349), increased-KC mud RNAi (red; n = 341) cells. Significance: Kruskal-Wallis test; K-S distance=0.139. See also Figure S1B, Table S1, S2.
Figure 2.
Figure 2.. Knocking down Tao in Kenyon cells increases dendritic claws per cell and projection neuron bouton production.
(A) mBitbow2.2 design. Transgene contains membrane-labeling mBitbow1.0 and a KD-controlled, self-excising flippase (“KDonFlp”) under control of n-Synaptobrevin (nSyb) promoter. Inducible fluorescent proteins shown are mAmetrine (A), tdKatushka2 (K), mNeonGreen (N), mTFP1 (T), and mKO2 (O). Detailed schematic: Figure S2A; further description provided in the methods. (B) Left: Representative adult brain Z-projection demonstrating stochastic, dense mBitbow2.2 labeling in neurons, produced by heat shock; dashed line: midline. (C) Without heat shock, mBitbow2.2-labels sparse KCs in control and KC>Tao RNAi: maximum Z-projection (top), single confocal slice (bottom). Dashed lines: calyx. Arrows: 3 KC soma labeled by mBitbow2.2 mAmetrine. Insets (yellow box) zoom in on a claw (Scale bar: 2 μm). See Figure S2B. (D-G) Number of dendritic claws per Kenyon cell (D), maximum calyx cross-sectional area (E), number of KCs (F), and relationship between KC number and maximum calyx cross-sectional area (G) in control (gray) and KC>Tao RNAi hemispheres (purple). Throughout this figure, each data point represents a single hemisphere, black bars represent medians, and significance is by unpaired t-test. (H) Left: Confocal slice showing Brp signal and maximum cross-sectional area (circled) of control and KC>Tao RNAi calyces. Right: Quantification of Brp density, normalized to protocerebral bridge. (I) Maximum intensity projection of GH146-labeled PN boutons in the calyx (red) in control and KC>Tao RNAi hemispheres. ChAT immunostaining (blue) indicates calyx extent. (J) Representative confocal slices of control and KC>Tao RNAi calyces. OK107 labels KCs (green) and ChAT labels PN boutons (magenta). Dashed lines: calyx. Insets: bouton morphology (scale bar: 2 μm). (K-M) PN bouton number (K, L), and ratio of ChAT+ boutons per calyx versus KCs per calyx (M). (N) Maximum intensity projections taken from anterior side of control and KC>Tao RNAi brains. KCs (green) show mushroom body lobes, which are diminished in KC>Tao RNAi brains. GH146+ PNs (magenta) show antennal lobe and PN cell bodies. (O) Summary of calyx anatomy. See also Table S2
Figure 3.
Figure 3.. Odor selectivity is reduced in Kenyon cells with increased dendritic claw numbers.
(A) Example KC somatic odor responses in control, median-responsive KC>Tao RNAi, and extremely responsive KC>Tao RNAi hemispheres. Grayscale backdrop indicates the cells. Control dataset throughout this figure is the same data as controls for mud RNAi condition in Figure 1, and the sample shown in (A) is rescaled from Figure 1G. We discuss use of octanol versus benzaldehyde in the methods. (B) Pearson correlation matrix shows the linear relation between each pairwise odor comparison across the cells for the control and “highly responsive” KC>Tao RNAi image shown in A. r can range from −1 to +1, but we did not observe negative correlations. (C) Peak odor responses of aggregated cells. Dashed line: 0.2 Δf/f threshold. Black horizontal bars: medians. Significance: Mann-Whitney test. n=349–404 control cells, 496 Tao RNAi cells for each stimulus. (D) Proportion of cells in each hemisphere responding to each odor above 0.2 Δf/f threshold. Significance: unpaired t-test. (E) Proportion cells responding to 0–4 odors. Bar plots in (D,E) show mean ± SD, black circled points correspond to the control, and “median responsive” Tao RNAi images shown in (A), red circled points correspond to “highly responsive” image in (A). (F) Mean cumulative proportion of cells responding from 0 up to 4 odors, pooled from all control (gray; n = 349) and Tao RNAi cells (purple; n = 496). Significance: Kruskal-Wallis test; K-S distance = 0.2318. Distributions for each hemisphere shown in Figure S3B. See also Table S2
Figure 4.
Figure 4.. Overexpressing dendritically-targeted Dscam1 in Kenyon cells decreases dendritic claws per cell.
(A) Maximum intensity Z-projections of mBitbow2.2-labeled KCs in control and KC>Dscam3.36.25.1 calyces. Dashed lines: calyx. Arrows: KC somata. Insets: claw structure, brightened for visualization (scale bar: 2μm). (B) Quantification of KC claws in control (gray) and KC>Dscam3.36.25.1 (green) hemispheres. (C) Representative confocal slices of control and KC>Dscam3.36.25.1 calyx. OK107 labels KCs (green) and ChAT labels PN boutons (magenta). Dashed lines: calyx. (D-F) Maximum calyx cross-sectional area (D), number of KCs (E), and the relationship between KC number and maximum calyx cross-sectional area (F) in control (gray) and KC>Dscam3.36.25.1 hemispheres (green). (G) Maximum intensity projection of calyx bouton production by GH146+ PNs (red) in control and KC>Dscam3.36.25.1 hemispheres. ChAT immunostaining (blue) highlights calyx extent (circled). (H-J) PN bouton number (H,I), and ratio of ChAT+ boutons per KC (J) in control (gray) and KC>Dscam3.36.25.1 hemispheres (green). (K) Maximum intensity projection of confocal stacks taken from anterior side of control and KC>Dscam3.36.25.1 brains. KCs (green) show the mushroom body lobes, GH146+ PNs (magenta) show the antennal lobe and PN cell bodies. (L) Model of KC>Dscam3.36.25.1 calyx. Throughout this figure, significance: unpaired t-test, black horizontal bars: medians. See also Table S2.
Figure 5.
Figure 5.. Kenyon cells with fewer claws are less responsive to odors.
(A) KC somatic odor responses in control and KC>Dscam3.36.25.1 hemispheres. Grayscale backdrop indicates the cells. (B) Peak odor responses of aggregated cells. Dashed line: 0.2 Δf/f threshold. Black horizontal bars: medians. Significance: Mann-Whitney test. n = 380–428 control cells, 372 Dscam3.36.25.1 cells for each odor. (C) Proportion of cells in each hemisphere responding to each odor above 0.2 Δf/f threshold. Significance: unpaired t-test. (D) Proportion of cells in each hemisphere responding to 0, 1, or multiple odors. Bar plots in (C,D) show mean ± SD, and black circled data points correspond to the images shown in (A). (E) Mean cumulative proportion of cells responding from 0 up to 4 odors from all control (gray; n = 369) and Dscam3.36.25.1 cells (green; n = 338). Significance: Kruskal-Wallis test; K-S distance = 0.348. Distributions for each hemisphere shown in Figure S4B. See also Table S2.
Figure 6.
Figure 6.. Associative learning and feed-forward functional responses in flies with reduced Kenyon cell numbers.
(A) Schematic of Y-arena and 2AFC task. Entering the reward zone is considered a choice; then the two odors are randomly re-assigned to the arms for the next trial. During rewarded trials, entering reward zone for a specific odor triggers a 500ms pulse of red light (optogenetic reward). (B) Maximum intensity Z-projections of calyces from sham- and HU-treated animals. 58F02 labels αβ core KCs (green). Mz19 labels ~16 PNs (magenta). Brp (blue) marks synapses. White outline: calyx. Numbers count 58F02+ neurite bundles (i.e. KC clones) innervating the pedunculus when traced through the stack. (C) Single slice of the antennal lobes from a HU-treated brain with 1 KC clone in the left hemisphere, and no clones in the right hemisphere. Dotted line: midline of the central brain. Mz19 labels the DA1 glomerulus (circled), allowing scoring of the lNB/BAlc PN neuroblast; it is ablated in the right hemisphere and DA1 glomerulus is lost. (D) Proportion of correct odor choices in naïve and rewarded trials. Each data point is one fly. Sham-treated and unaffected, HU-treated animals are displayed in gray, intermediate HU-treated clone numbers in black, and fully ablated “[0,0]” HU-treated animals in red. Jitter added in this plot and (E) to display all the data points. Significance: paired t-test. See also Figure S5B. (E) Relationship between Δ correct choices between rewarded vs naïve trails, and sum of KC clones from both hemispheres (0–8). No correlation was observed. See Figure S5C–D for relation with lNB/BAlc ablation. (F) Left: Confocal slice with maximum calyx cross-sectional area of sham and HU-treated calyces (bottom left: 2 KC clones, bottom right: 1 KC clone). Dashed lines: calyx. Part of the protocerebral bridge is included in the sham image. Right: Quantification of Bruchpilot density, normalized to protocerebral bridge. Black bars: medians. All pairwise comparisons are non-significant by unpaired t-test. See also Figure S5E. (G) Left: Schematic of the mushroom body lobe anatomy with KCs (green) and γ2α’1 MBONs dendrite compartment (magenta). Right: Maximum intensity Z-projections of MB lobe with KCs (green) and γ2α’1 MBON (magenta) in sham and HU-treated animals. MBON compartment is circled with a dashed line. Inset: lateral view of MBON compartment (Scale bar: 5 μm). Corresponding location is indicated by white dashed vertical line. Blue dashed line: focal plane for calcium imaging of MBON axonal terminals in (H, I). See Figure S5A for effect on PAM-DAN arbors. (H) Example γ2α’1 MBON axonal odor responses in sham and HU-treated hemisphere. Left: Focal plane of KC vertical lobe (green) and baseline GCaMP6s signal in MBON axonal terminals (magenta). Blue dashes: ROI used to measure odor responses. Scale bar: 5 μm. Right: Responses to odors. See also Figure S5F. (I) Peak odor responses of all MBON axonal ROIs. Each dot is one hemisphere. Only treated hemispheres with maximum cross-sectional calyx area less than every control (< 2100 μm2) are included (Figure S5G). Black horizontal bars: mean. Significance: unpaired t-test. Black circled points: samples shown in (H). See also Table S2.
Figure 7.
Figure 7.. Effect of increasing Kenyon cell number or claw number on associative learning and feedforward functional responses.
(A) Example learning curves of individual flies are plotted to show cumulative correct and incorrect odor choices across all trials. Grey and pink lines indicate naïve and rewarded trials respectively (40–60 trials each). Dotted line (y=x) displays equal preference. (B) Proportion of correct odor choices made in naïve and rewarded trials, in control (gray), KC>mud RNAi (red), and KC>Tao RNAi (purple) animals. Each data point is an individual fly. Jitter added in this plot and (C) to display all the data points. Significance: paired t-test. (C) Difference (Δ) in correct choices made in rewarded vs naïve trials in control (gray), KC>mud RNAi (red), and KC>Tao RNAi (purple) animals. Black horizontal bars: median. Significance: unpaired t-test. (D) Δ correct choices plotted against inter-hemisphere mean calyx area for each animal in control and KC>mud RNAi conditions. Black line: linear fit. Dotted line: largest control calyx. (E) Left: Schematic of circular arena and hard discrimination task. In training, one of the odors (PA: pentyl acetate or BA: butyl acetate) is paired with an optogenetic reward. During test trials, the positions of all animals (15–20 animals/assay) are recorded before and during odor presentation. Right: Change in performance index is calculated by comparing distribution of animals in rewarded-odor quadrants to their distribution before odor onset, as described,. Each dot is one group assay. Behavior traces over time are provided in Figure S6A. (F) Maximum intensity Z-projections of MB lobe with KCs (green) and MBONs γ2α’1 (magenta) in control, mud RNAi and Tao RNAi animals. Dashed circle: MBON compartment. Inset: lateral view of MBON compartment at the location of the white dashed vertical line (scale bar: 5 μm). Blue dashed line: focal plane for MBON axonal terminals in (G, H). (G) Example MBON axonal odor responses in control, mud RNAi, and Tao RNAi animals. Left: Focal plane of KC vertical lobe (green) and baseline GCaMP6s signal in MBON axonal terminals (magenta). Blue dashes outline the ROI used to measure odor responses. Scale bar: 5 μm. Right: Responses to odors. See also Figure S6B. (H) Peak odor responses of all MBON axonal ROIs; each dot is one hemisphere. For mud RNAi, only hemispheres greater than every control (> 2200 μm2) are included (Figure S6C). Black horizontal bars: mean peak responses. Peak responses of mud RNAi and Tao RNAi are compared with control using unpaired t-tests. Non-significant comparisons are not shown. Black circled points: samples shown in (G). See also Table S2.

Similar articles

Cited by

References

    1. Wong AM, Wang JW, and Axel R (2002). Spatial representation of the glomerular map in the Drosophila protocerebrum. Cell 109, 229–241. - PubMed
    1. Sosulski DL, Lissitsyna Bloom M, Cutforth T, Axel R, and Datta SR (2011). Distinct representations of olfactory information in different cortical centres. Nature 472, 213–216. 10.1038/nature09868. - DOI - PMC - PubMed
    1. Miyamichi K, Amat F, Moussavi F, Wang C, Wickersham I, Wall NR, Taniguchi H, Tasic B, Huang ZJ, He Z, et al. (2011). Cortical representations of olfactory input by trans-synaptic tracing. Nature 472, 191–196. 10.1038/nature09714. - DOI - PMC - PubMed
    1. Marin EC, Jefferis GSXE, Komiyama T, Zhu H, and Luo L (2002). Representation of the glomerular olfactory map in the Drosophila brain. Cell 109, 243–255. - PubMed
    1. Ghosh S, Larson SD, Hefzi H, Marnoy Z, Cutforth T, Dokka K, and Baldwin KK (2011). Sensory maps in the olfactory cortex defined by long-range viral tracing of single neurons. Nature 472, 217–220. 10.1038/nature09945. - DOI - PubMed

Publication types

Substances

LinkOut - more resources