. 2023 Sep 6;111(17):2709-2726.e9.
doi: 10.1016/j.neuron.2023.05.022. Epub 2023 Jun 21.

PD-L1/PD-1 checkpoint pathway regulates hippocampal neuronal excitability and learning and memory behavior

Affiliations

PD-L1/PD-1 checkpoint pathway regulates hippocampal neuronal excitability and learning and memory behavior

Junli Zhao et al. Neuron. .

Abstract

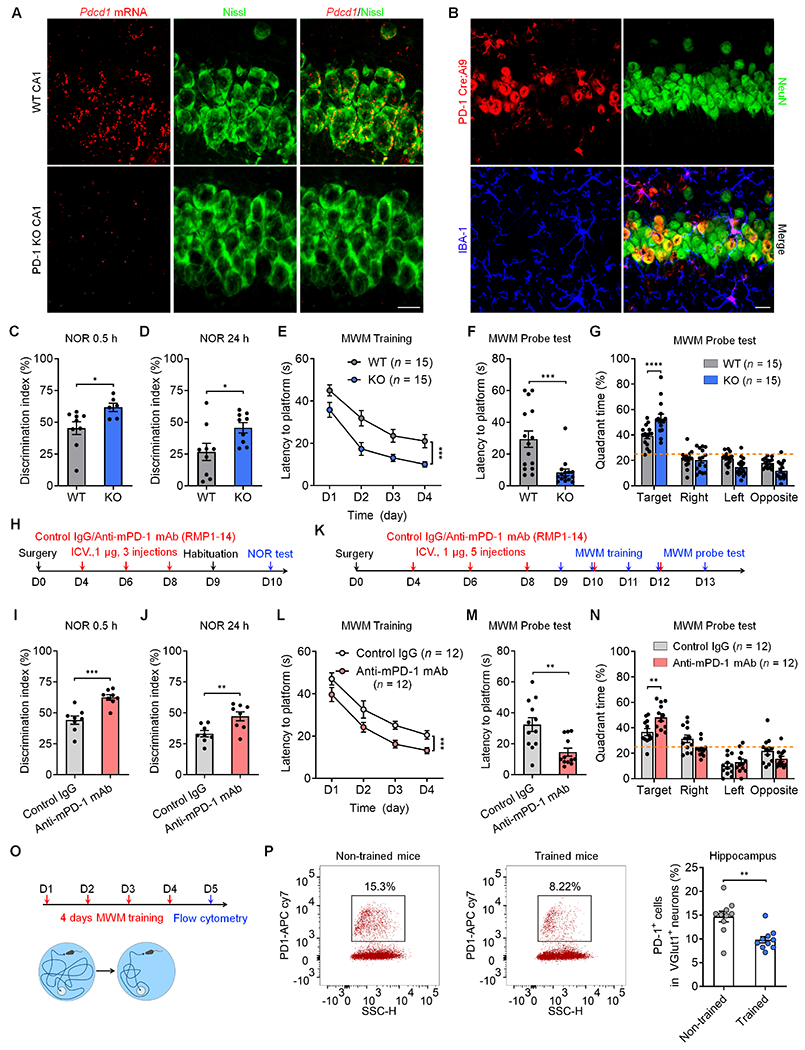
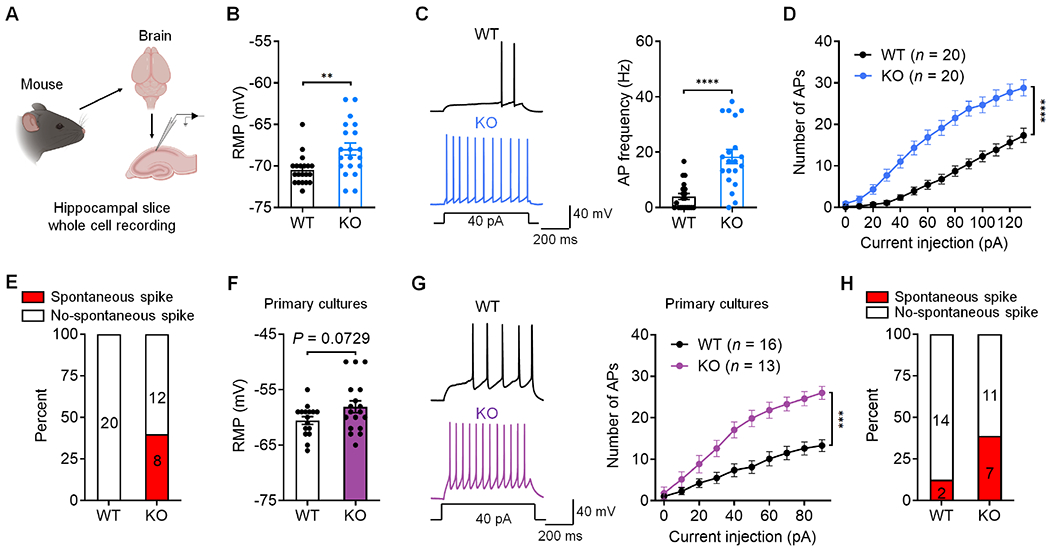
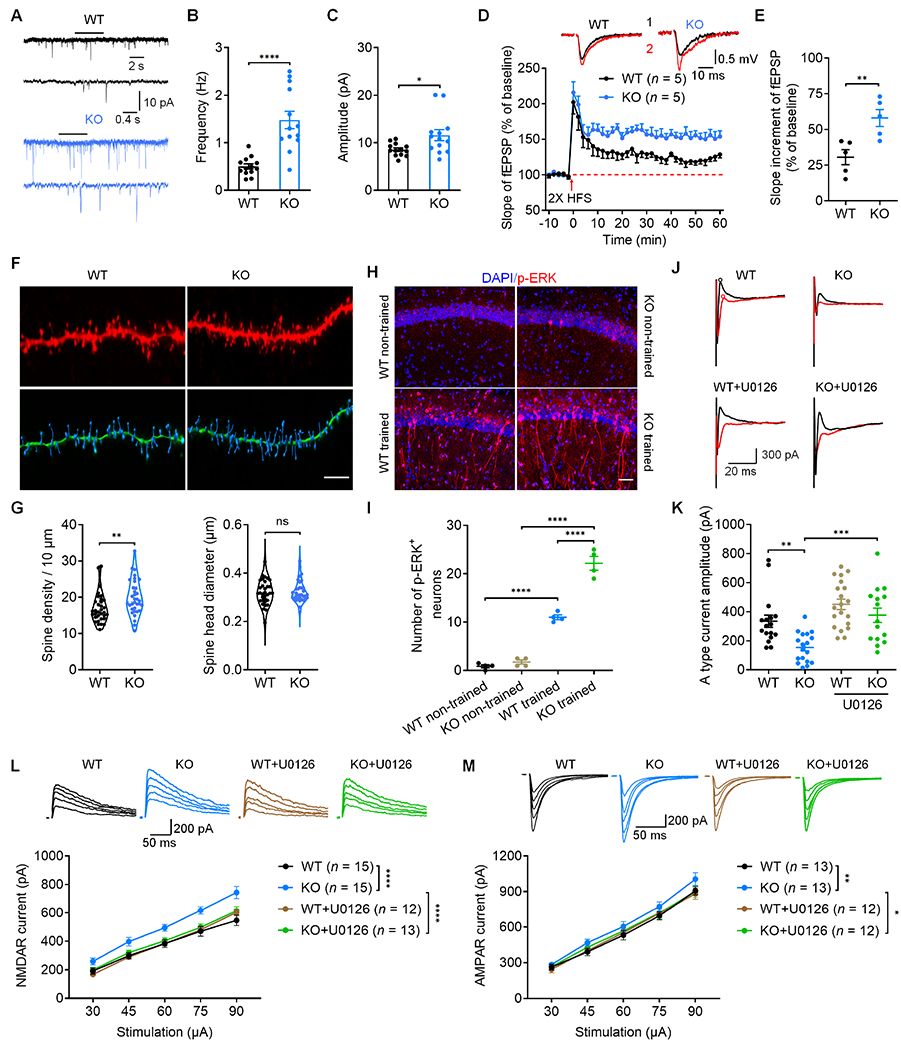
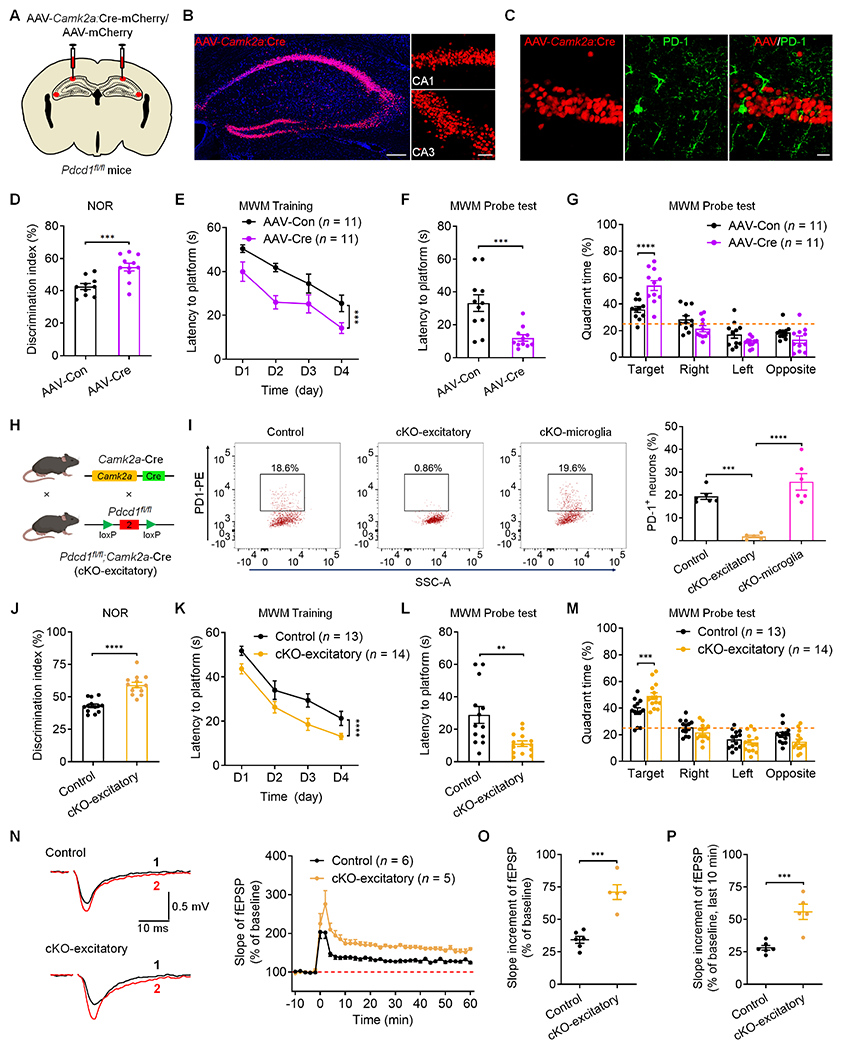
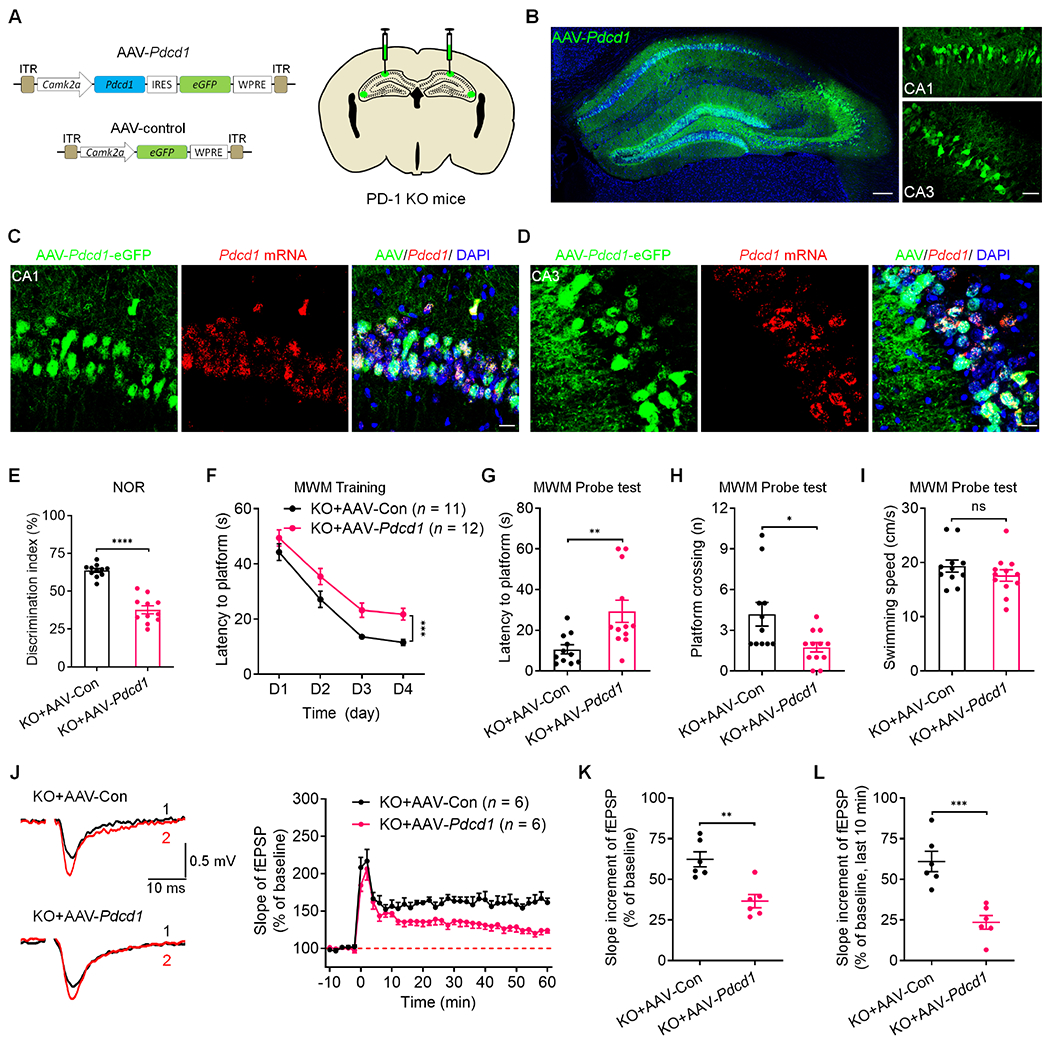
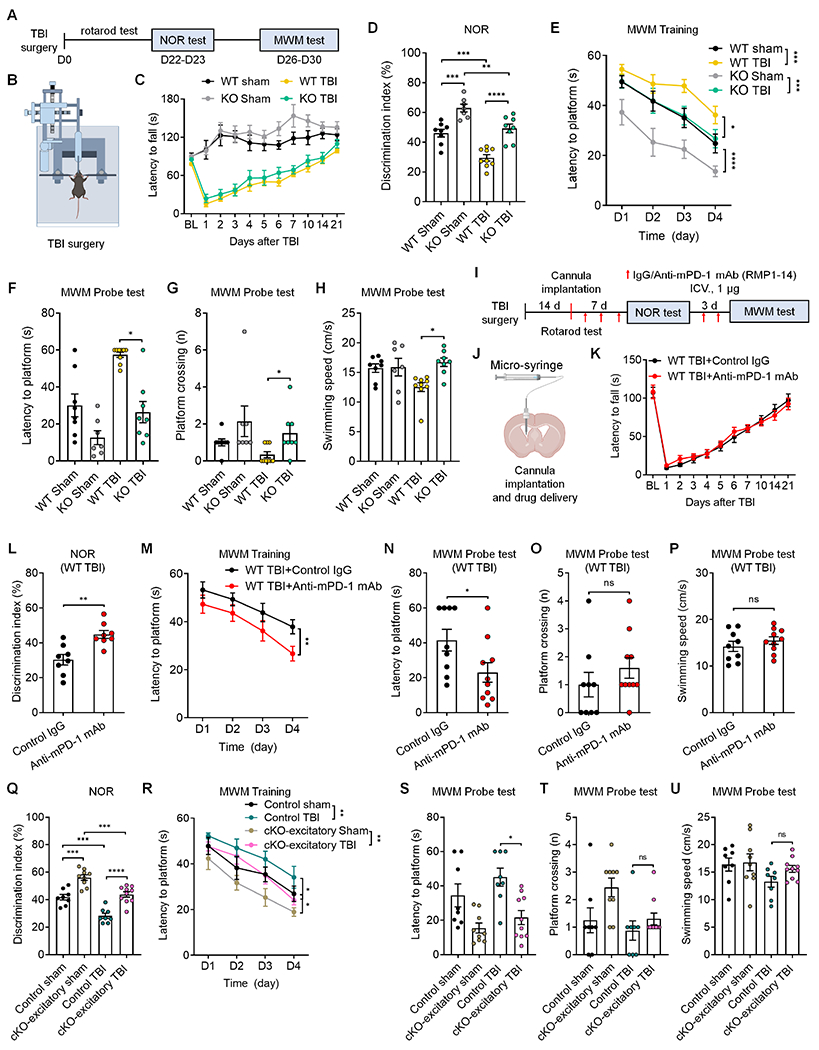
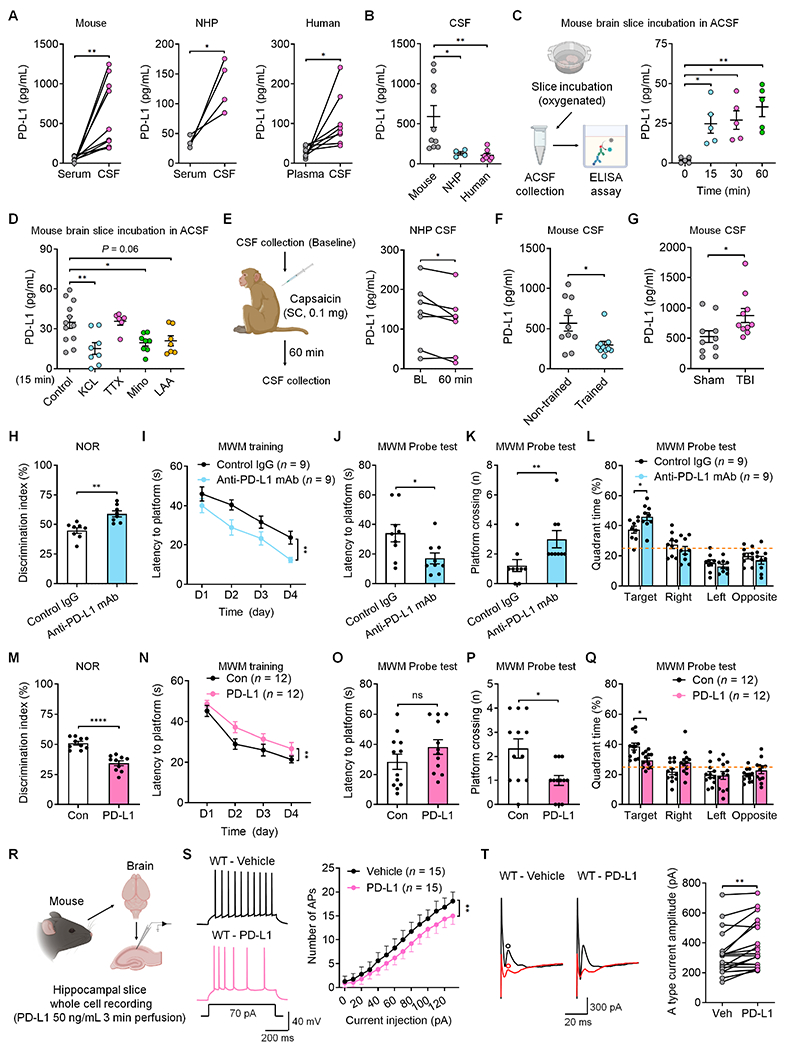
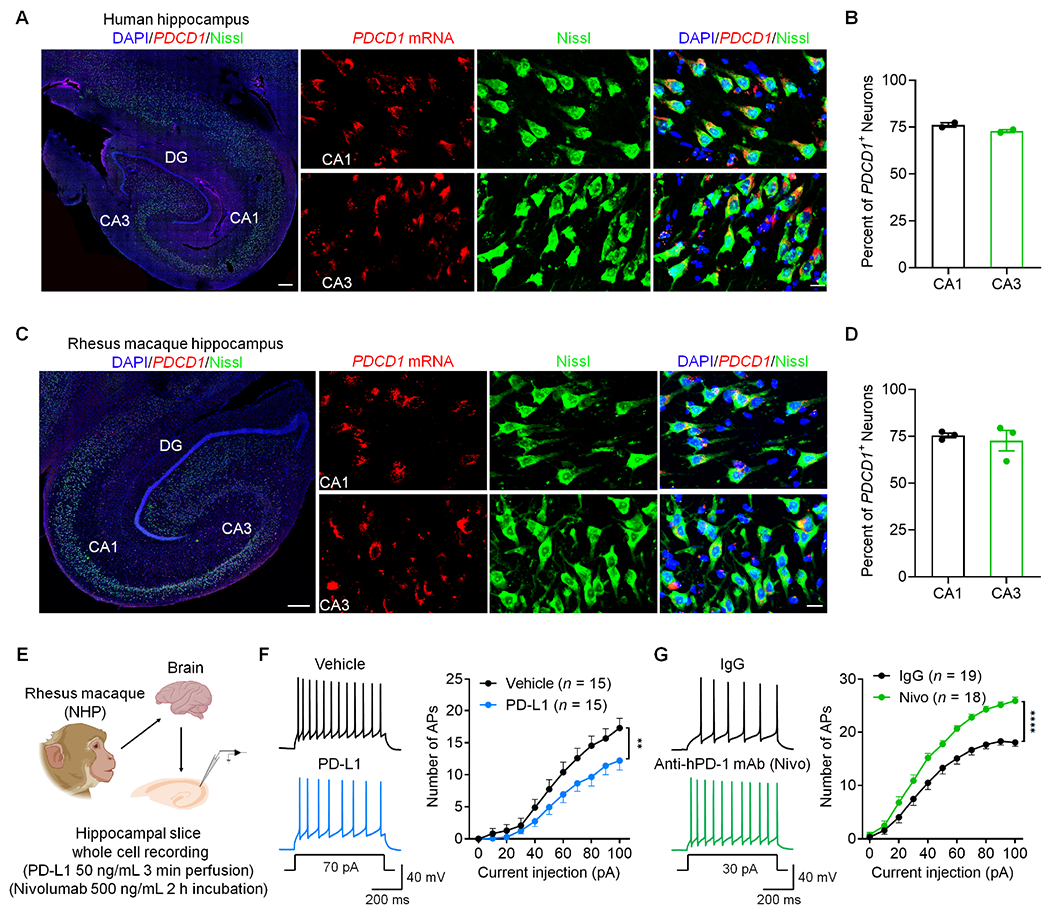
Programmed death protein 1 (PD-1) and its ligand PD-L1 constitute an immune checkpoint pathway. We report that neuronal PD-1 signaling regulates learning/memory in health and disease. Mice lacking PD-1 (encoded by Pdcd1) exhibit enhanced long-term potentiation (LTP) and memory. Intraventricular administration of anti-mouse PD-1 monoclonal antibody (RMP1-14) potentiated learning and memory. Selective deletion of PD-1 in excitatory neurons (but not microglia) also enhances LTP and memory. Traumatic brain injury (TBI) impairs learning and memory, which is rescued by Pdcd1 deletion or intraventricular PD-1 blockade. Conversely, re-expression of Pdcd1 in PD-1-deficient hippocampal neurons suppresses memory and LTP. Exogenous PD-L1 suppresses learning/memory in mice and the excitability of mouse and NHP hippocampal neurons through PD-1. Notably, neuronal activation suppresses PD-L1 secretion, and PD-L1/PD-1 signaling is distinctly regulated by learning and TBI. Thus, conditions that reduce PD-L1 levels or PD-1 signaling could promote memory in both physiological and pathological conditions.

Keywords: hippocampal neurons; immunotherapy; long-term potentiation; mice; microglia; nonhuman primate; programmed cell death ligand 1; programmed cell death protein 1; traumatic brain injury.


Conflict of interest statement

Declaration of interests The authors declare no competing interests.

Figures

Figure 1.
Figure 1.. PD-1 loss or blockade enhances learning and memory.
(A) Representative images of Pdcd1 in situ hybridization showing Pdcd1 mRNA expression in WT neurons (labeled by Nissl staining) but not in PD-1 KO neurons. Scale bar, 20 μm (B) Representative images of NeuN and IBA1 immunostaining in PD-1 Cre;Ai9 reporter mouse. Scale bar, 20 μm. (C,D) NOR testing showing discrimination index of WT and PD-1 KO mice at 0.5 h (C) and 24 h (D). (E) MWM testing for spatial learning curves during training in WT and KO mice, measured as latency to find the hidden platform. (F) MWM probe testing for latency to platform in WT and PD-1 KO mice. (G) MWM probe test showing percent time spent in different quadrants of WT and PD-1 KO mice. (H) Schematic of experimental design for ICV surgery, ICV administration of control IgG and anti-mPD-1 mAb (RMP1-14) and NOR testing. (I, J) NOR test showing discrimination index of control IgG and RMP1-14 treated mice at 0.5 h (I) and 24 h (J). (K) Schematic of experimental design for ICV surgery, ICV administration of control IgG and anti-mPD-1 mAb and MWM testing. (L) MWM testing for spatial learning curves of WT mice treated with control IgG and RMP1-14. (M) MWM probe testing for latency to platform in WT mice treated with control IgG and anti-mPD-1 mAb RMP1-14. (N) MWM probe test showing percent time spent in different quadrants of WT mice treated with control IgG and RMP1-14. (O) Timeline for 4-day MWM training and flow cytometry analysis on Day 5. (P) Flow cytometry images (left) and quantification (right) showing decreased percentage of PD-1+ cells in trained vs. non-trained mice. Data are represented as mean ± SEM. Also see Figure S1 and Figure S2. Sample size and statistical tests are reported in detail in Tables S1 and S5.
Figure 2.
Figure 2.. Loss of PD-1 increases neuronal excitability in mouse hippocampal neurons.
(A) Schematic of experimental design for whole-cell patch clamp recordings in mouse brain slices. (B) RMP recorded from WT and PD-1 KO CA1 neurons. (C) Representative AP traces (left) and frequency (right) in WT and PD-1 KO CA1 neurons. (D) Number of APs evoked by step current injection in WT and KO neurons. (E) Spontaneous discharges in CA1 neurons of PD-1 KO (8/20) but not in WT neurons (0/20). (F) RMP recorded from WT and PD-1 KO neurons. (G) Representative AP traces (left) and AP number (right) evoked by step current injection in WT and PD-1 KO neurons from primary cultures. (H) Percentage of neurons showing spontaneous discharges in WT (2/16) and PD-1 KO (7/18) neurons from primary cultures. Data are represented as mean ± SEM. Also see Figure S3. Sample size and statistical tests are reported in detail in Tables S1 and S5.
Figure 3.
Figure 3.. PD-1 loss in mouse brain slices regulates synaptic transmission, LTP, spine formation, ERK activation, A type K+ currents and NMDAR/AMPAR currents in the CA1 region.
(A) Representative traces mEPSCs recorded from WT and PD-1 KO neurons. (B-C) Quantification of mEPSC frequency (B) and amplitude (C) recorded from WT and PD-1 KO neurons. (D-E) Summary plots (D) and average slope (E) of LTP induced by 2 × HFS in CA1 region of WT and PD-1 KO slices. Top: Black traces (1) and red trace (2) represent the baseline fEPSP and post-induction fEPSP, respectively. (F) Representative confocal z stack and three-dimensional reconstruction images of the apical dendrites of CA1 neurons obtained from WT and PD-1 KO slices. Scale bar, 5 μm. (G) Spine density (left) and spine size (right) in WT mice and PD-1 KO mice. (H) Confocal microscopy images of p-ERK immunostaining in the CA1 region. Scale bar, 50 μm. (I) Quantification of p-ERK+ neurons in CA1 of WT and PD-1 KO mice with and without training. (J) Representative traces of outward A-type potassium currents from WT and PD-1 KO mice. A type current was isolated from the subtraction of red to black circles. (K) Quantification of A type potassium current amplitudes from WT and PD-1 KO neurons and the effects of U0126. (L-M) NMDAR and AMPAR mediated currents in CA1 pyramidal neurons of brain slices of WT and PD-1 KO mice and the effects of U0126 (ERK inhibition) following electrical stimulation of the Schaffer collaterals. (L) Representative traces of evoked NMDAR currents (top) and summary data of current amplitude (bottom). (M) Representative traces of evoked AMPAR currents (top) and summary data of current amplitude (bottom). Data are represented as mean ± SEM. Also see Figure S3. Sample size and statistical tests are reported in detail in Tables S1 and S5.
Figure 4.
Figure 4.. Selective deletion of PD-1 in hippocampal excitatory neurons enhances memory and LTP.
(A) Illustration of bilateral virus (AAV-Camk2a:Cre or AAV-control) injections into the hippocampus of Pdcd1fl/fl mice for selective deletion of Pdcd1 in hippocampal excitatory neurons. (B) Representative confocal images of the mouse hippocampus show the AAV-infected neurons in the CA1 and CA3 regions. Blue: DAPI staining. Scale bar, 200 μm. Right, higher magnification images showing the infected CA1 and CA3 excitatory neurons. Scale bar, 50 μm. (C) Representative confocal images showing selective loss of PD-1 in CA1 excitatory neurons labeled with AAV-Camk2a:Cre. Scale bar, 20 μm. (D) Discrimination index of Pdcd1fl/fl mice injected with AAV-control and AAV-Camk2a:Cre in NOR testing. (E) Spatial learning curves during MWM training in Pdcd1fl/fl mice show better performance in mice injected with AAV-Camk2a:Cre vs. AAV-control. (F) MWM probe tests showing latency to platform in Pdcd1fl/fl mice injected with AAV-control and AAV-Camk2a:Cre. (G) Quadrant percent time of Pdcd1fl/fl mice injected with AAV-control and AAV-Camk2a:Cre in the MWM probe test. (H) Schematic of conditional deletion of Pdcd1 in excitatory neurons (cKO-excitatory). (I) Flow cytometry images (left) and quantification (right) showing the percentage of PD-1+ neurons in the hippocampi of control littermates, cKO-excitatory mice, and cKO-microglia mice. (J) Discrimination index of control littermates and cKO-excitatory mice in NOR testing. (K) Spatial learning curve during MWM training in control littermates and cKO-excitatory mice. (L) MWM probe tests for latency to platform in control littermates and cKO-excitatory mice. (M) Quadrant percent time of control littermates and cKO-excitatory mice in the MWM probe test. (N) Representative traces (left) and summary plots (right) of LTP induced by 2 × HFS in CA1 region of control littermates and cKO-excitatory slices. Black traces (1) and red trace (2) represent the baseline fEPSP and post-induction fEPSP, respectively. (O-P) Quantification of average slope of LTP in CA1 region of control littermate and cKO-excitatory slices in entire phase (O) and late phase (P). Data are represented as mean ± SEM. Also see Figures S4–S7. Sample size and statistical tests are reported in detail in Tables S1 and Table S5.
Figure 5.
Figure 5.. Selective re-expression of PD-1 in the hippocampus excitatory neurons impairs memory and LTP.
(A) Schematics of AAV constructs of Pdcd1 (AAV-Pdcd1) or control (AAV-control) (left) and bilateral viral injections into the mouse hippocampus (right). (B) Representative confocal images of mouse hippocampus (left) and infected CA1 and CA3 neurons (right) after the AAV injections. Blue: DAPI. Scale bars, 200 μm (left), 50 μm (right). (C-D) Representative confocal images of the infected CA1 (C) and CA3 (D) neurons coexpressing eGFP (AAV-Pdcd1) and Pdcd1 mRNA (revealed by RNAscope). Scale bar, 20 μm. (E) Discrimination index of PD-1 KO mice injected with AAV-control and AAV-Pdcd1 in NOR testing. (F) Spatial learning curves during MWM training in PD-1 KO mice injected with AAV-control and AAV-Pdcd1, measured as latency to the hidden platform. (G-H) MWM probe test shows deficits of PD-1 KO mice injected with AAV-Pdcd1 vs. AAV-control in locating the platform (left) and crossing the platform zone (right). (I) MWM probe test shows comparable swimming speed in PD-1 KO mice injected with AAV-control and AAV-Pdcd1. (J) Representative traces (left) and summary plots (right) of LTP induced by 2 × HFS in the CA1 region of PD-1 KO mice injected with AAV-control or AAV-Pdcd1. Left: Black traces (1) and red trace (2) represent the baseline fEPSP and post-induction fEPSP, respectively. (K-L) Quantification of average slope of LTP in the CA1 region of PD-1 KO mice injected with AAV-control and AAV-Pdcd1 in the entire phase (K) and late phase (L). Data are represented as mean ± SEM. Also see Figure S8. Sample size and statistical tests are reported in detail in Tables S1 and S5.
Figure 6.
Figure 6.. Suppression of PD-1 protects cognitive function after traumatic brain injury.
(A-C) Experimental paradigm (A), TBI illustration (B) and rotarod test (C) in WT mice and PD-1 KO mice with TBI or sham surgery. (D) NOR testing shows cognitive deficits in both WT TBI mice and PD-1 KO TBI mice; but PD-1 KO TBI mice have a higher discrimination index than WT TBI mice. (E) MWM training curves show deficits in both WT mice and PD-1 KO; but PD-1 KO mice with TBI spend less time on navigating the hidden platform location than WT mice with TBI. (F-G) MWM probe tests for latency to platform (F) and number of platform zone crossings (G). (H) MWM probe test shows higher swimming velocity in PD-1 KO TBI mice than WT TBI mice. (I-K) Experimental paradigm (I), drug delivery (J) and rotarod test (K) in WT TBI mice treated with control IgG or anti-mPD-1 mAb. (L) Discrimination index of WT TBI mice treated with control IgG and anti-mPD-1 mAb (RMP1-14) in NOR testing. (M) Spatial learning curves during MWM training show significant improvement in WT TBI mice treated with RMP1-14 than control IgG. (N-O) MWM probe test for latency to platform (N) and number of platform crossings (O) in control IgG and RMP1-14 treated mice. (P) MWM probe test shows comparable swimming speed between control IgG and RMP1-14 treated TBI mice. (Q) Discrimination index of control littermates and cKO-excitatory mice with TBI or sham surgery in NOR testing. (R) Spatial learning curve during MWM training in control littermates and cKO-excitatory mice with TBI or sham surgery. (S-U) MWM probe tests for latency to platform (S) and number of platform crossings (T) and swimming speed (U) in control littermates and cKO-excitatory mice with TBI or sham surgery. Data are represented as mean ± SEM. Also see Figure S9. Sample size and statistical tests are reported in detail in Tables S1 and S5.
Figure 7.
Figure 7.. Secreted PD-L1 regulates neuronal excitability and memory via PD-1.
(A-B) Basal levels of PD-L1 in serum/plasma and CSF samples of mice, non-human primates (NHPs) and humans. (C) Time course of PD-L1 release from mouse brain slices incubated with ACSF. (D) Effects of control, KCL, TTX, minocycline, and L-α-aminoadipate on PD-L1 release at 15 min. (E) Schematic of CSF collection in NHP (left) and secreted PD-L1 levels before and 60 min after capsaicin treatment (right). (F) CSF PD-L1 levels in mice with and without training. (G) CSF PD-L1 levels in mice with TBI and sham surgery. (H) Discrimination index of WT mice treated with ICV control IgG or anti-mouse PD-L1 mAb in NOR testing. (I) Spatial learning curve during MWM training in WT mice treated with ICV control IgG or anti-mouse PD-L1 mAb. (J-K) MWM probe tests for latency to platform (J) and number of platform crossings (K) in WT mice treated with ICV control IgG or anti-mouse PD-L1 mAb. (L) Quadrant percent time of WT mice treated with ICV control IgG or anti-mouse PD-L1 mAb for the MWM probe test. (M) Discrimination index of WT mice treated with ICV administration of recombinant mouse PD-L1 or control (Con) protein in NOR testing. (N) Spatial learning curve during MWM training in WT mice treated with ICV recombinant PD-L1 or control protein. (O-P) MWM probe tests for latency to platform (O) and number of platform crossings (P) in WT mice treated with ICV control protein or recombinant mouse PD-L1. (Q) Quadrant percent time of WT mice treated with ICV PD-L1 and control protein in the MWM probe test. (R) Schematic of whole-cell patch clamp recordings in WT mouse hippocampal neurons before and after PD-L1 perfusion. (S) Representative AP traces (left) and quantification of AP numbers (right), evoked by step current injection in WT CA1 neurons before and after perfusion of recombinant mouse PD-L1. (T) Representative outward A-type potassium currents and quantification of A-type K+ current amplitude in WT CA1 neurons before and after PD-L1 perfusion. Black trace: nonconditioned current; red trace: conditioned current. A type current was isolated from the subtraction of red to black circles. Data are represented as mean ± SEM. Also see Figure S10. Sample size and statistical tests are reported in detail in Tables S1 and S5.
Figure 8.
Figure 8.. PDCD1 is widely expressed by human and monkey hippocampal neurons and regulates neuronal excitability in NHP slices.
(A) PDCD1 mRNA expression in human hippocampal neurons as shown by in situ hybridization. Left, representative image of the whole hippocampus (Scale bar, 500 μm). Right panels, high magnification images showing PDCD1 mRNA expression in Nissl-labeled neurons (Scale bar, 20 μm). (B) Quantification of PDCD1+ neurons in the CA1 and CA3 regions of humans. (C) PDCD1 mRNA expression in NHP hippocampal neurons as shown by in situ hybridization. Left, representative image of the whole hippocampus. Scale bar, 500 μm. Right panels, high magnification images showing PDCD1 mRNA expression in Nissl-labeled neurons. Scale bar, 20 μm. (D) Quantification of PDCD1+ neurons in the CA1 and CA3 regions of NHPs. (E) Schematic of experimental design for whole-cell patch clamp recordings in NHP brain slices. (F) Representative AP traces (left) and quantification of AP firing rate (right) before and after treatment of recombinant monkey PD-L1. (G) Representative AP traces (left) and quantification of current-evoked APs (right) in NHP hippocampal neurons treated with control IgG and anti-human PD-1 mAb (nivolumab). Data are represented as mean ± SEM. Also see Figure S11. Sample size and statistical tests are reported in detail in Tables S1 and S5.

References

    1. Ishida Y, Agata Y, Shibahara K, and Honjo T (1992). Induced expression of PD-1, a novel member of the immunoglobulin gene superfamily, upon programmed cell death. EMBO J 11, 3887–3895. 10.1002/j.1460-2075.1992.tb05481.x. - DOI - PMC - PubMed
    1. Sharma P, and Allison JP (2015). The future of immune checkpoint therapy. Science 348, 56–61. 348/6230/56 [pii]; 10.1126/science.aaa8172 [doi]. - DOI - PubMed
    1. Zhao J, Roberts A, Wang Z, Savage J, and Ji RR (2021). Emerging Role of PD-1 in the Central Nervous System and Brain Diseases. Neurosci Bull. 10.1007/sl2264-021-00683-y. - DOI - PMC - PubMed
    1. Baruch K, Deczkowska A, Rosenzweig N, Tsitsou-Kampeli A, Sharif AM, Matcovitch-Natan O, Kertser A, David E, Amit I, and Schwartz M (2016). PD-1 immune checkpoint blockade reduces pathology and improves memory in mouse models of Alzheimer’s disease. Nat Med 22, 135–137. 10.1038/nm.4022. - DOI - PubMed
    1. Rosenzweig N, Dvir-Szternfeld R, Tsitsou-Kampeli A, Keren-Shaul H, Ben-Yehuda H, Weill-Raynal P, Cahalon L, Kertser A, Baruch K, Amit I, et al. (2019). PD-1/PD-L1 checkpoint blockade harnesses monocyte-derived macrophages to combat cognitive impairment in a tauopathy mouse model. Nat Commun 10, 465. 10.1038/s41467-019-08352-5. - DOI - PMC - PubMed

Publication types

MeSH terms