. 2023 Oct;79(4):1025-1036.
doi: 10.1016/j.jhep.2023.05.045. Epub 2023 Jun 20.

Ductular reaction-associated neutrophils promote biliary epithelium proliferation in chronic liver disease

Affiliations

Ductular reaction-associated neutrophils promote biliary epithelium proliferation in chronic liver disease

Silvia Ariño et al. J Hepatol. 2023 Oct.

Abstract

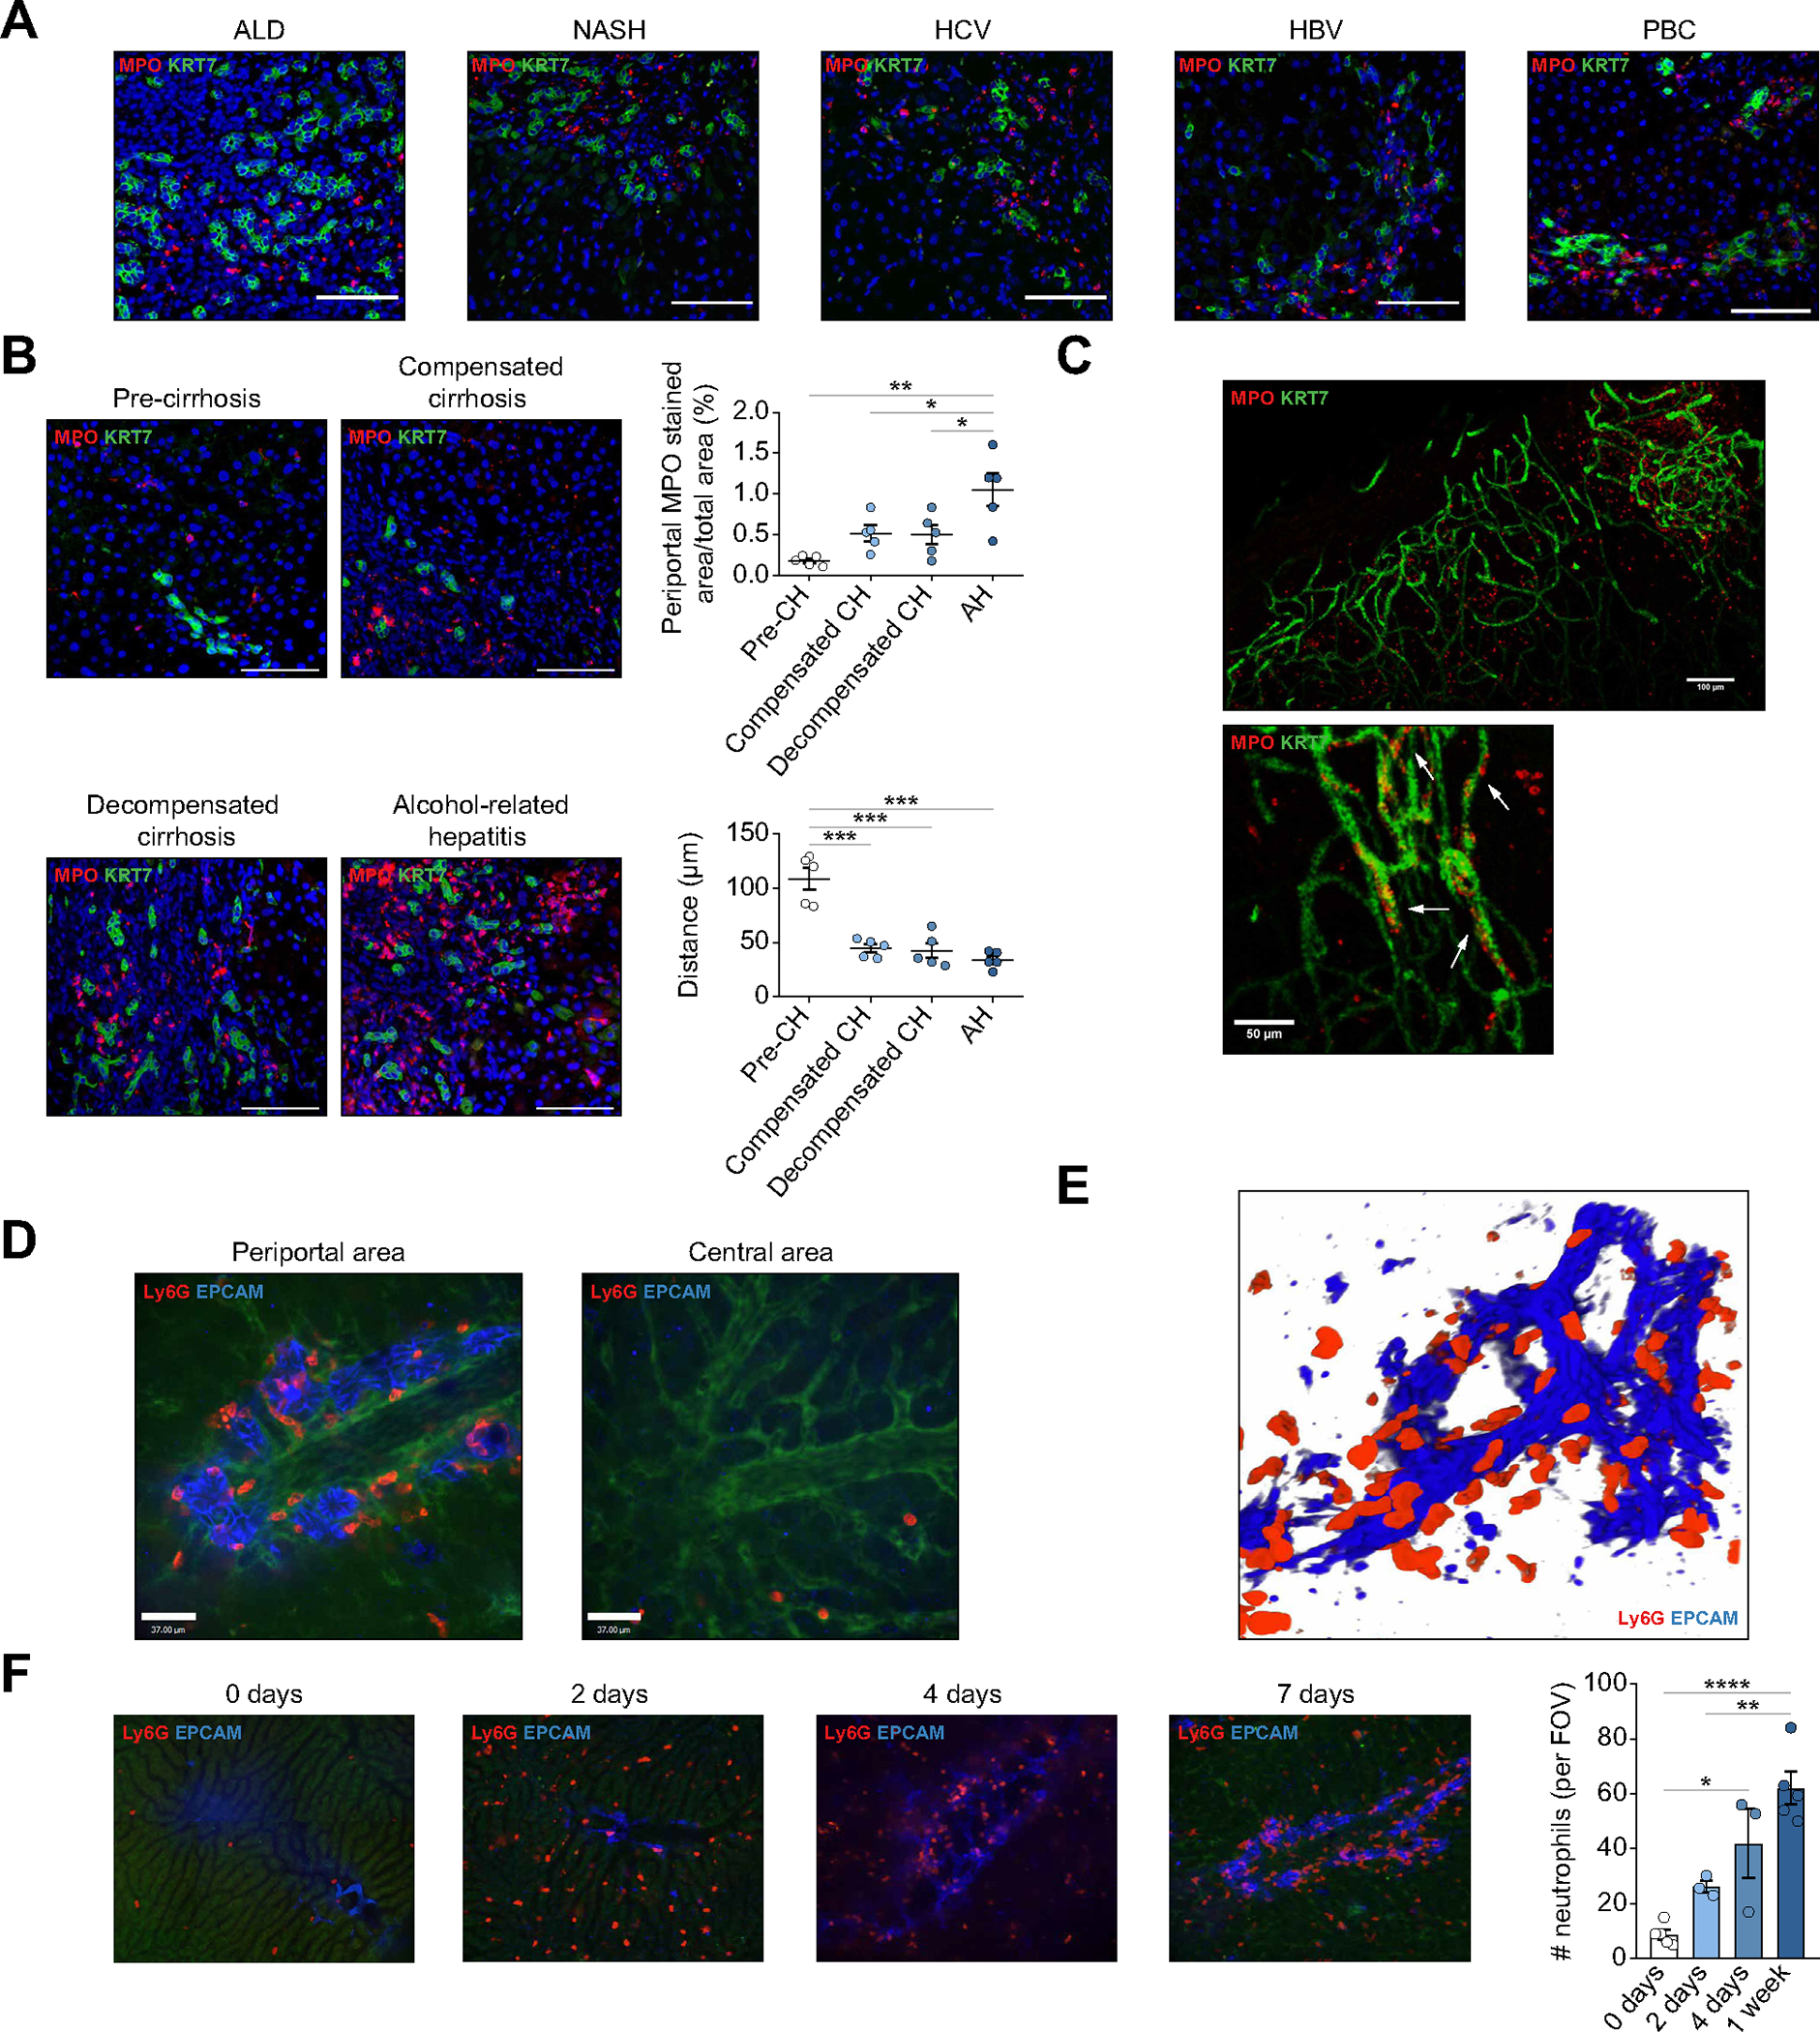
Background & aims: Ductular reaction expansion is associated with poor prognosis in patients with advanced liver disease. However, the mechanisms promoting biliary cell proliferation are largely unknown. Here, we identify neutrophils as drivers of biliary cell proliferation and the defective wound-healing response.

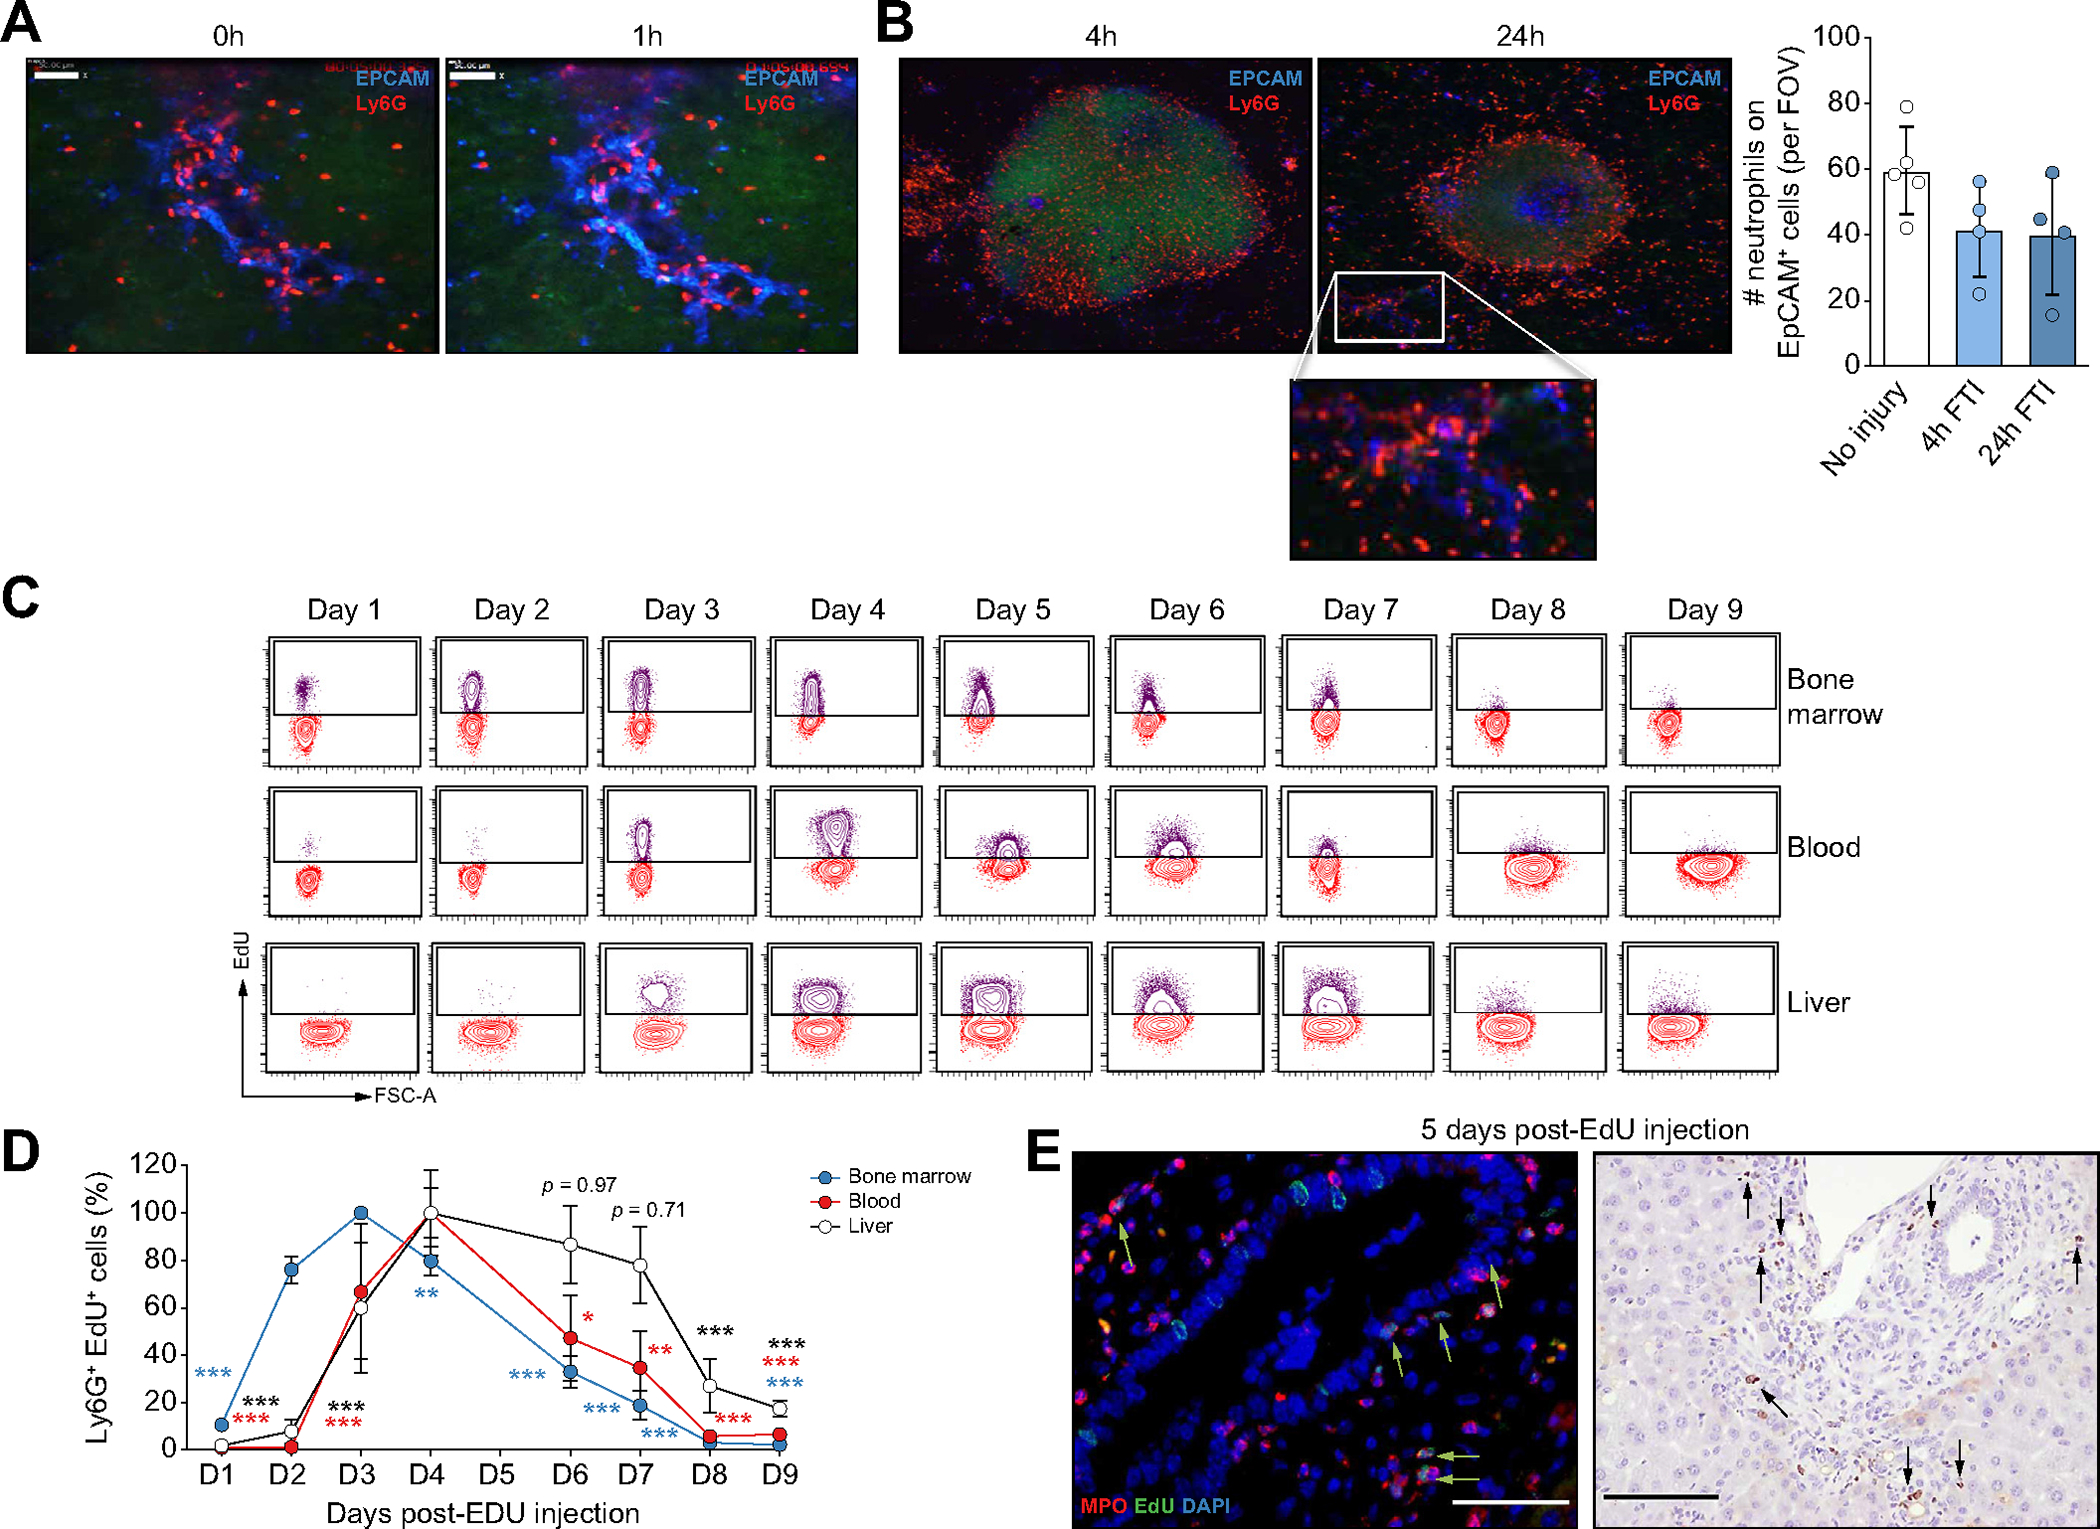
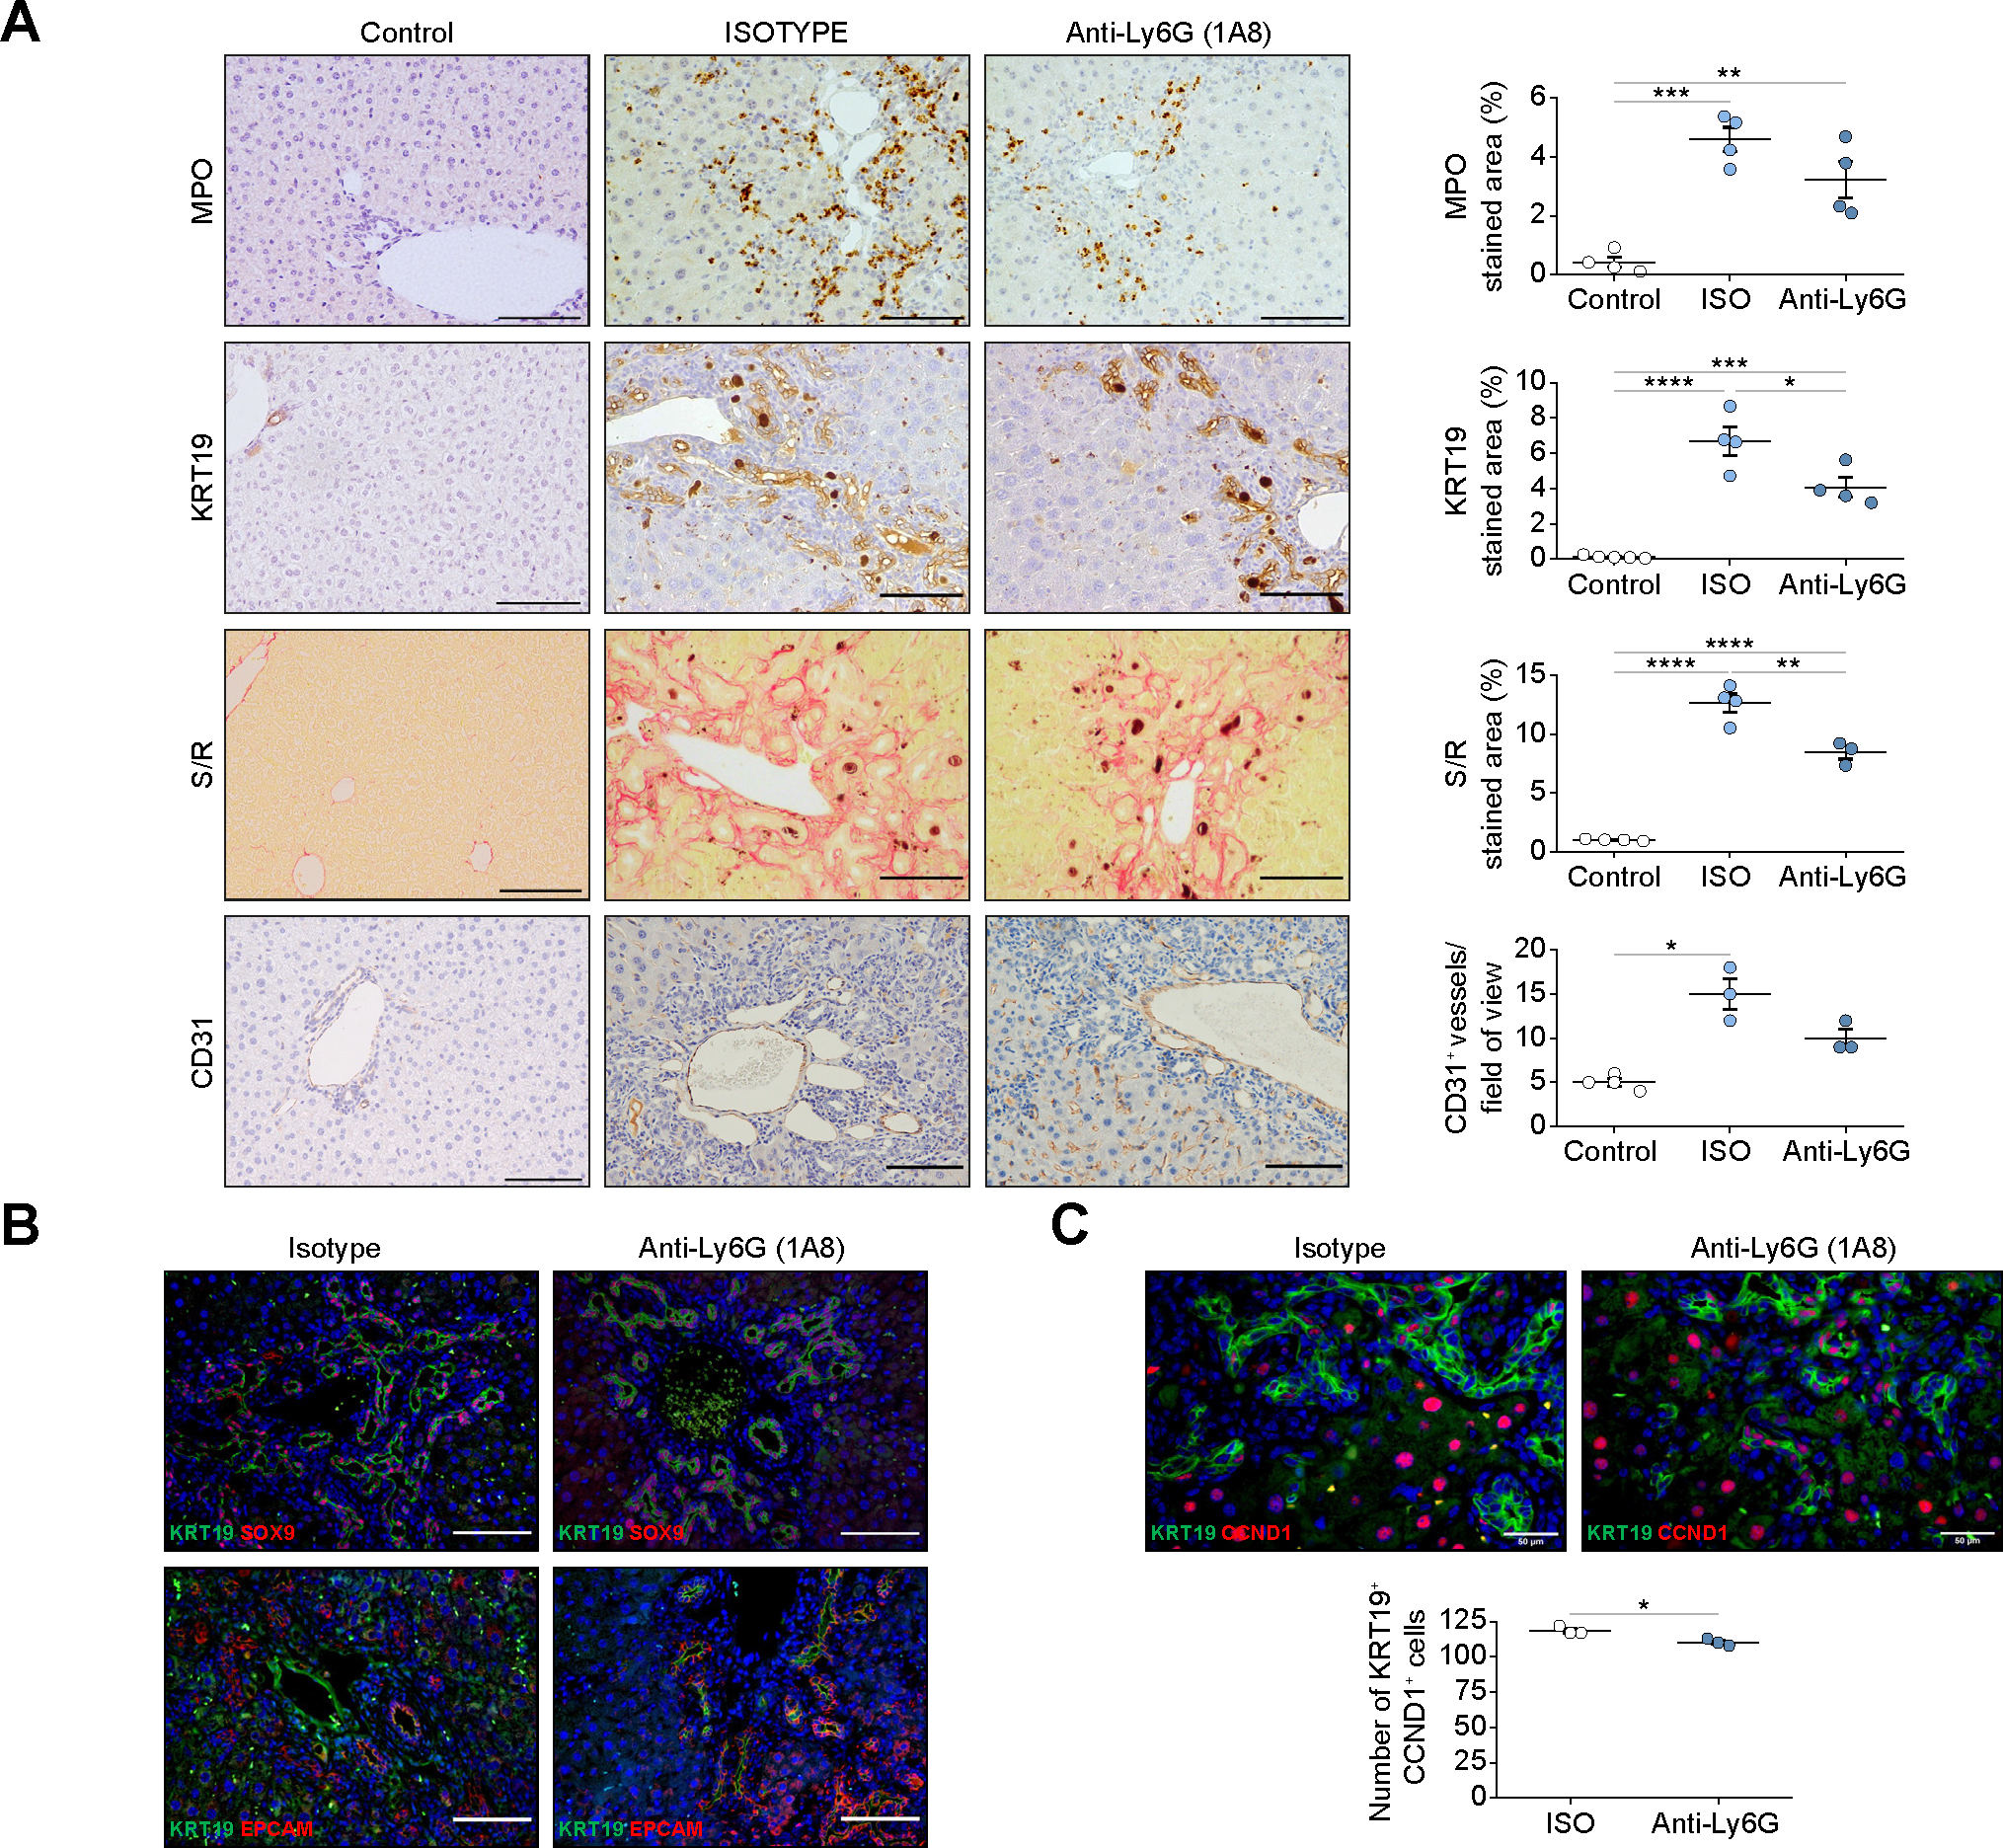
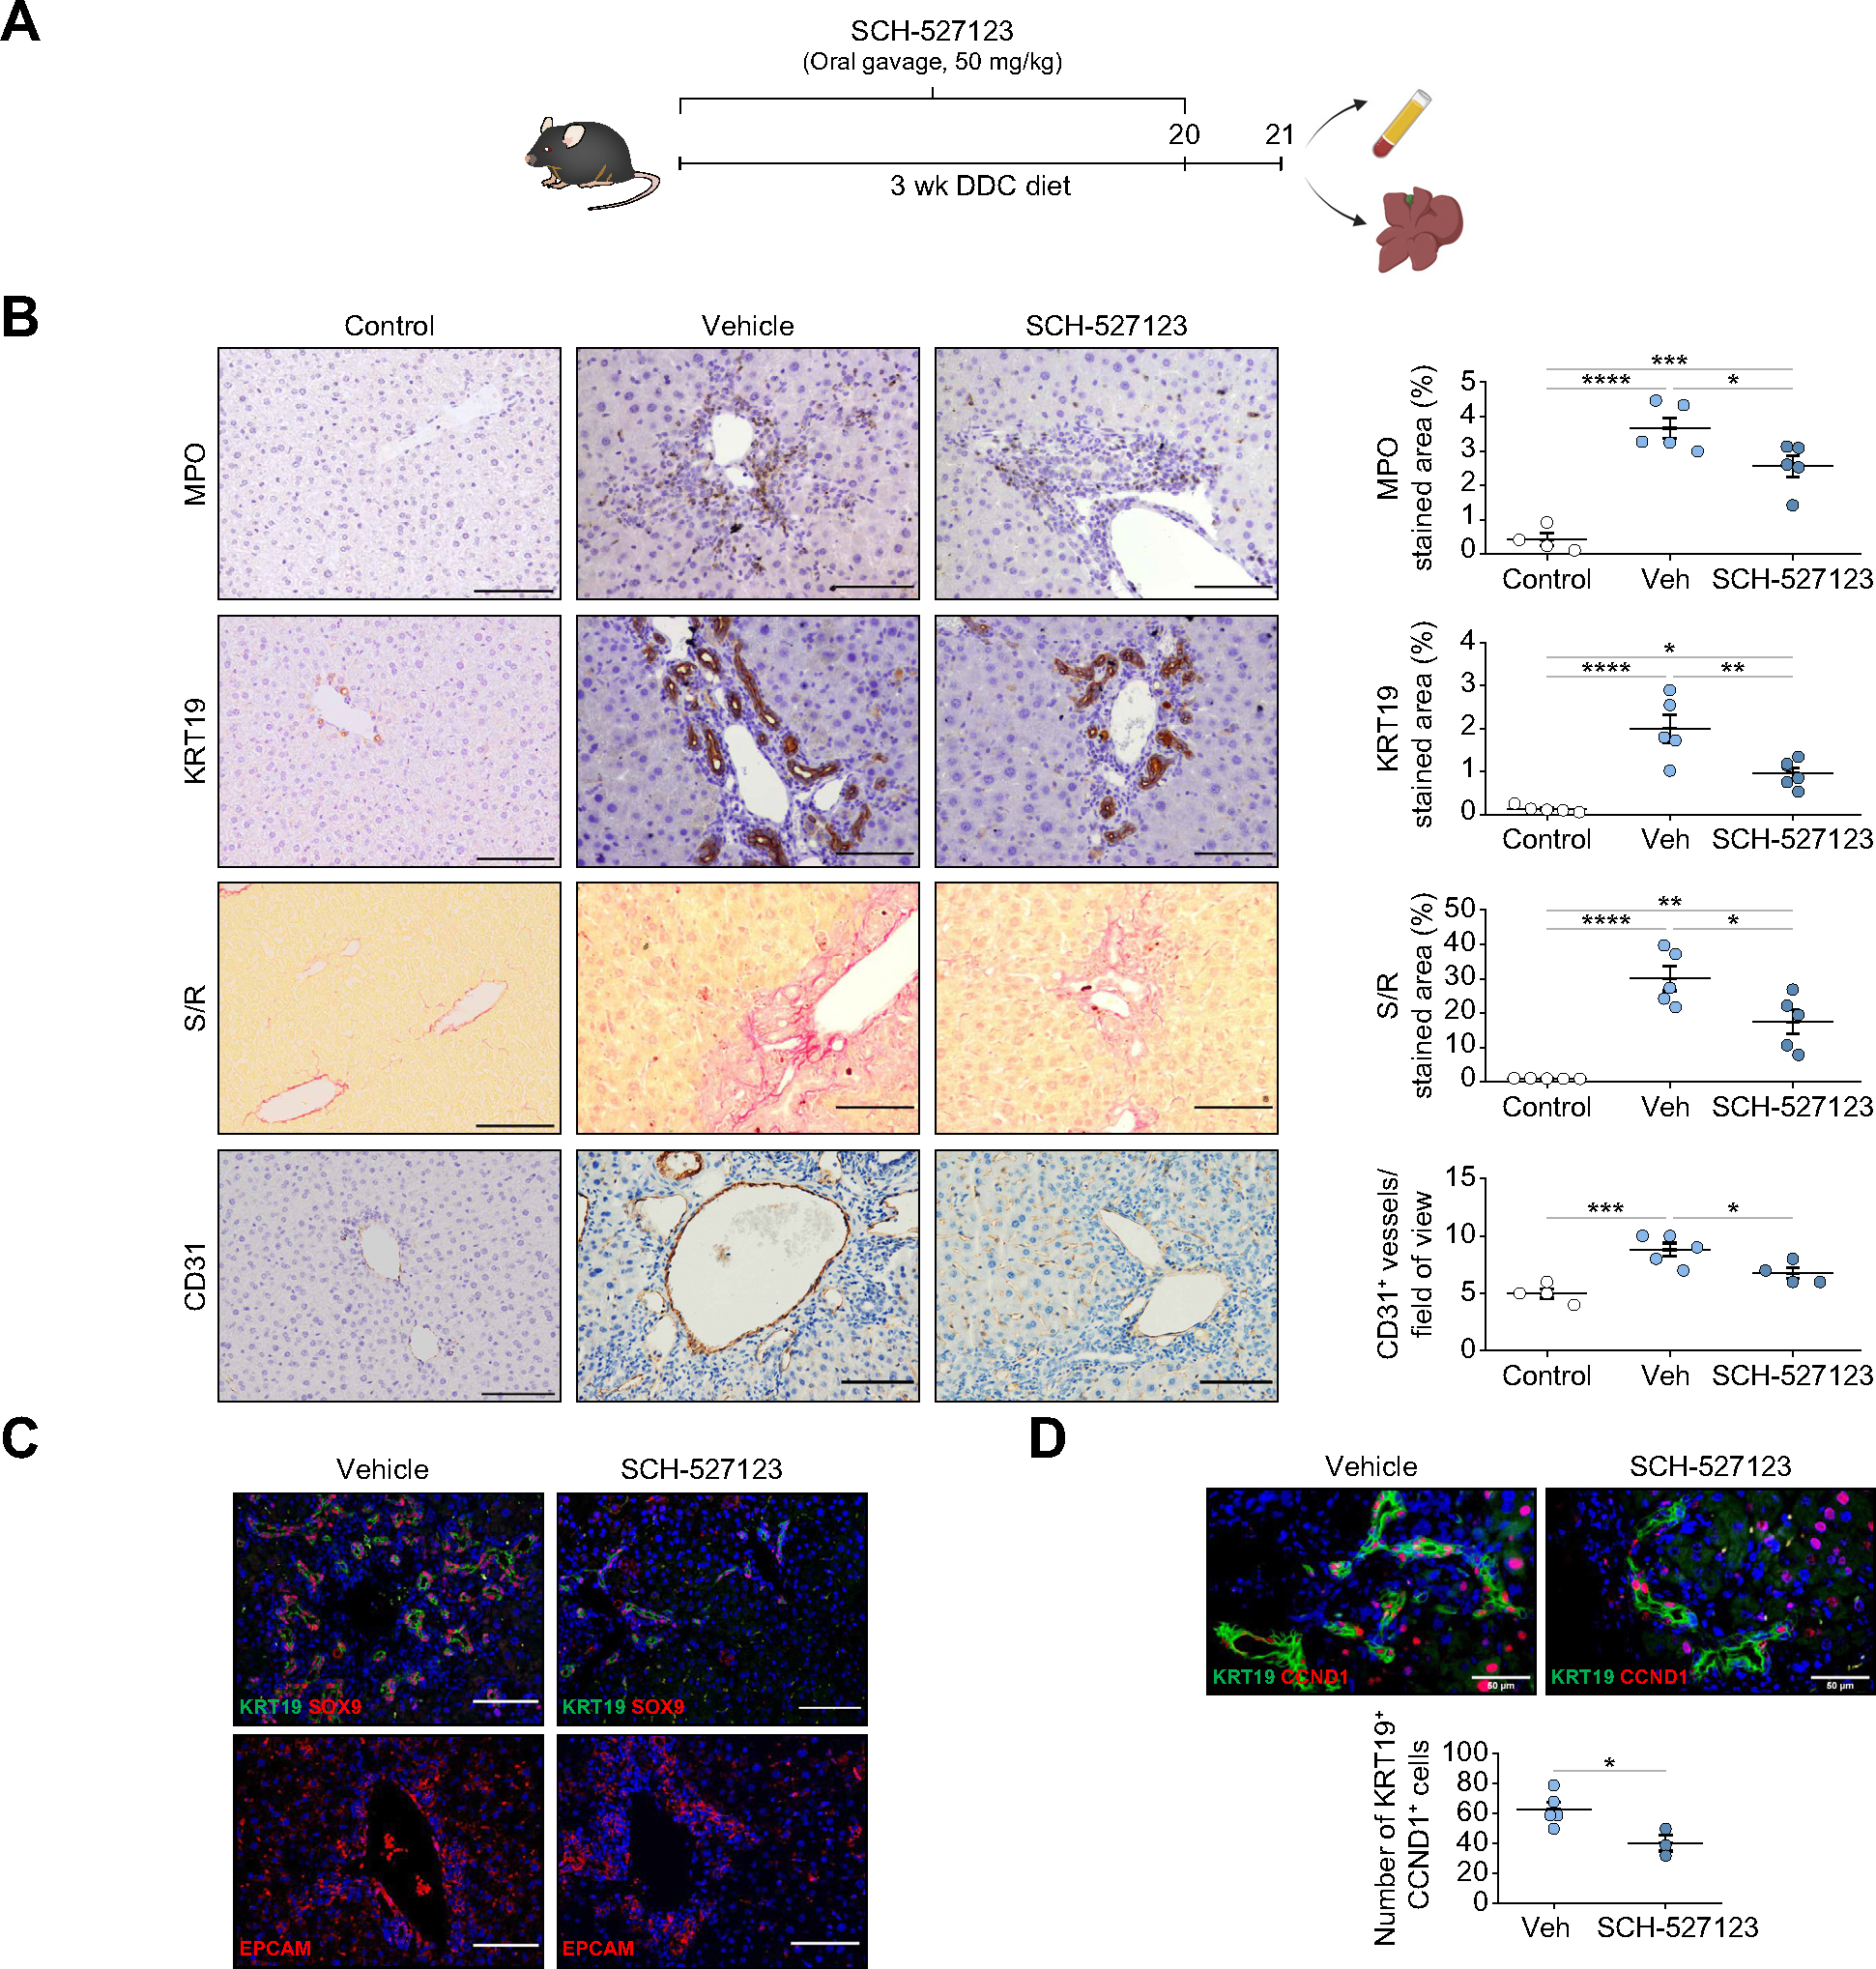
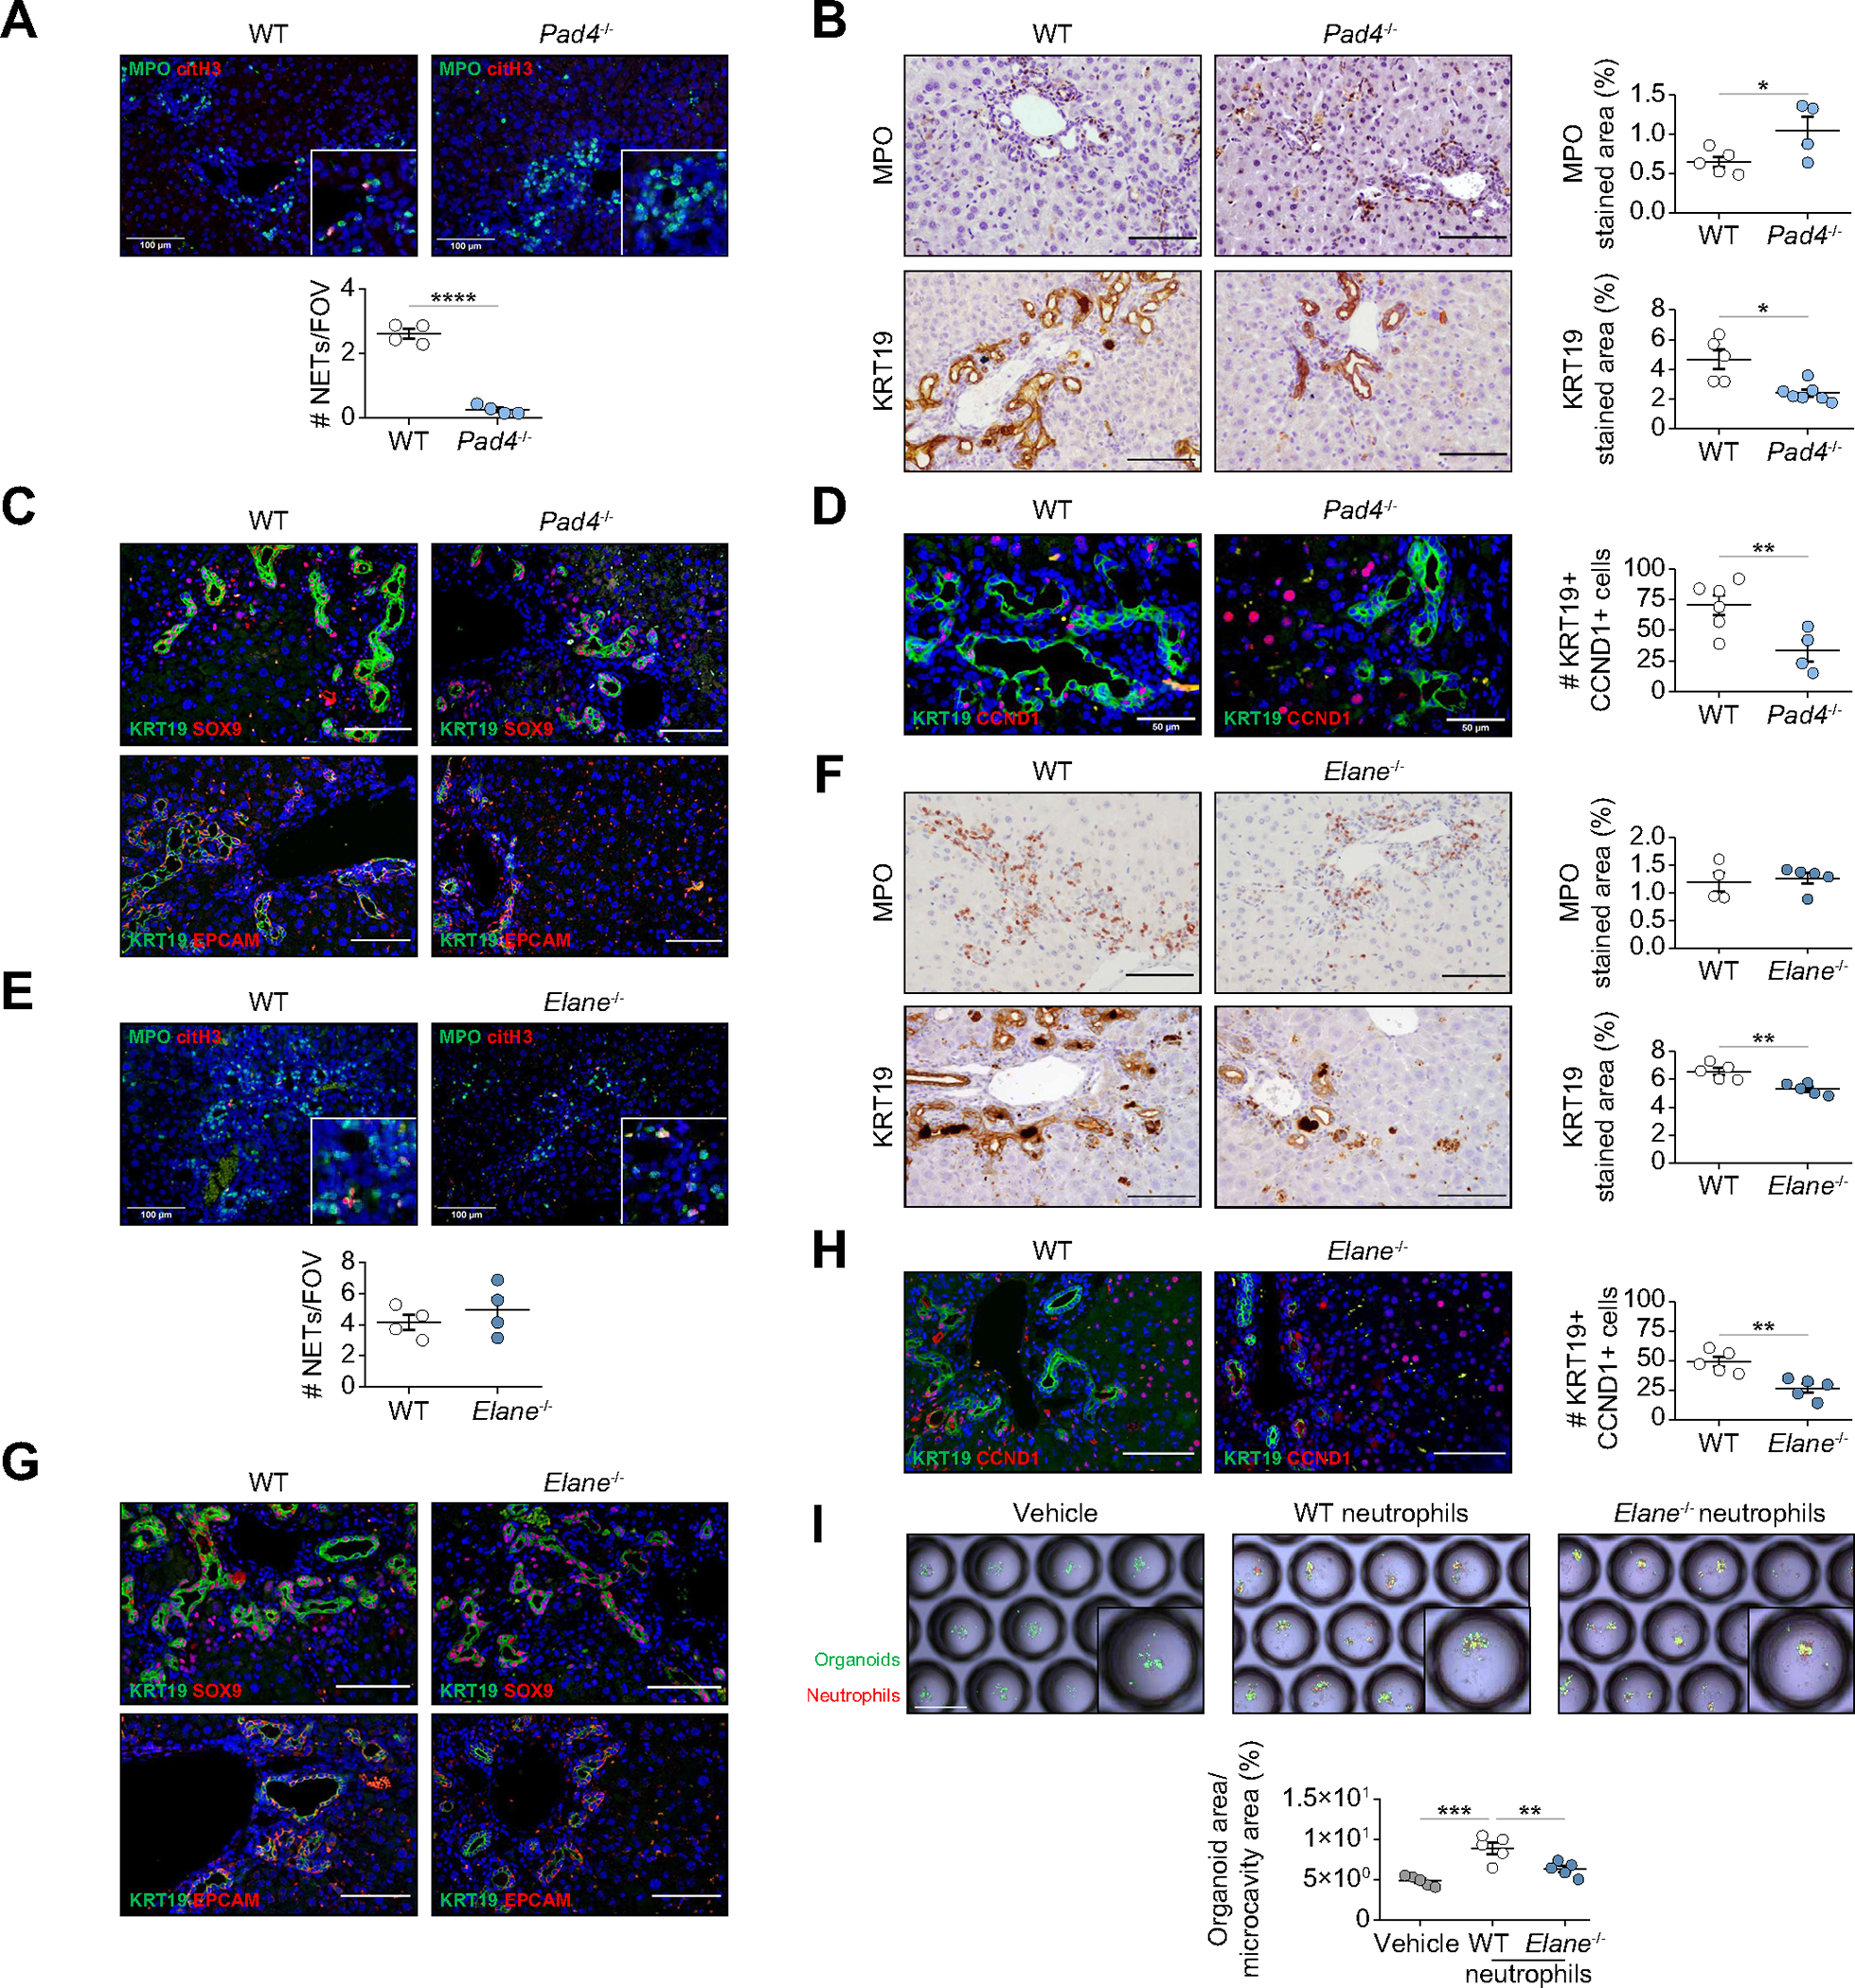
Methods: The intrahepatic localization of neutrophils was evaluated in patients with chronic liver disease. Neutrophil dynamics were analyzed by intravital microscopy and neutrophil-labeling assays in DDC-treated mice. Neutrophil depletion or inhibition of recruitment was achieved using a Ly6g antibody or a CXCR1/2 inhibitor, respectively. Mice deficient in PAD4 (peptidyl arginine deiminase 4) and ELANE/NE (neutrophil elastase) were used to investigate the mechanisms underlying ductular reaction expansion.

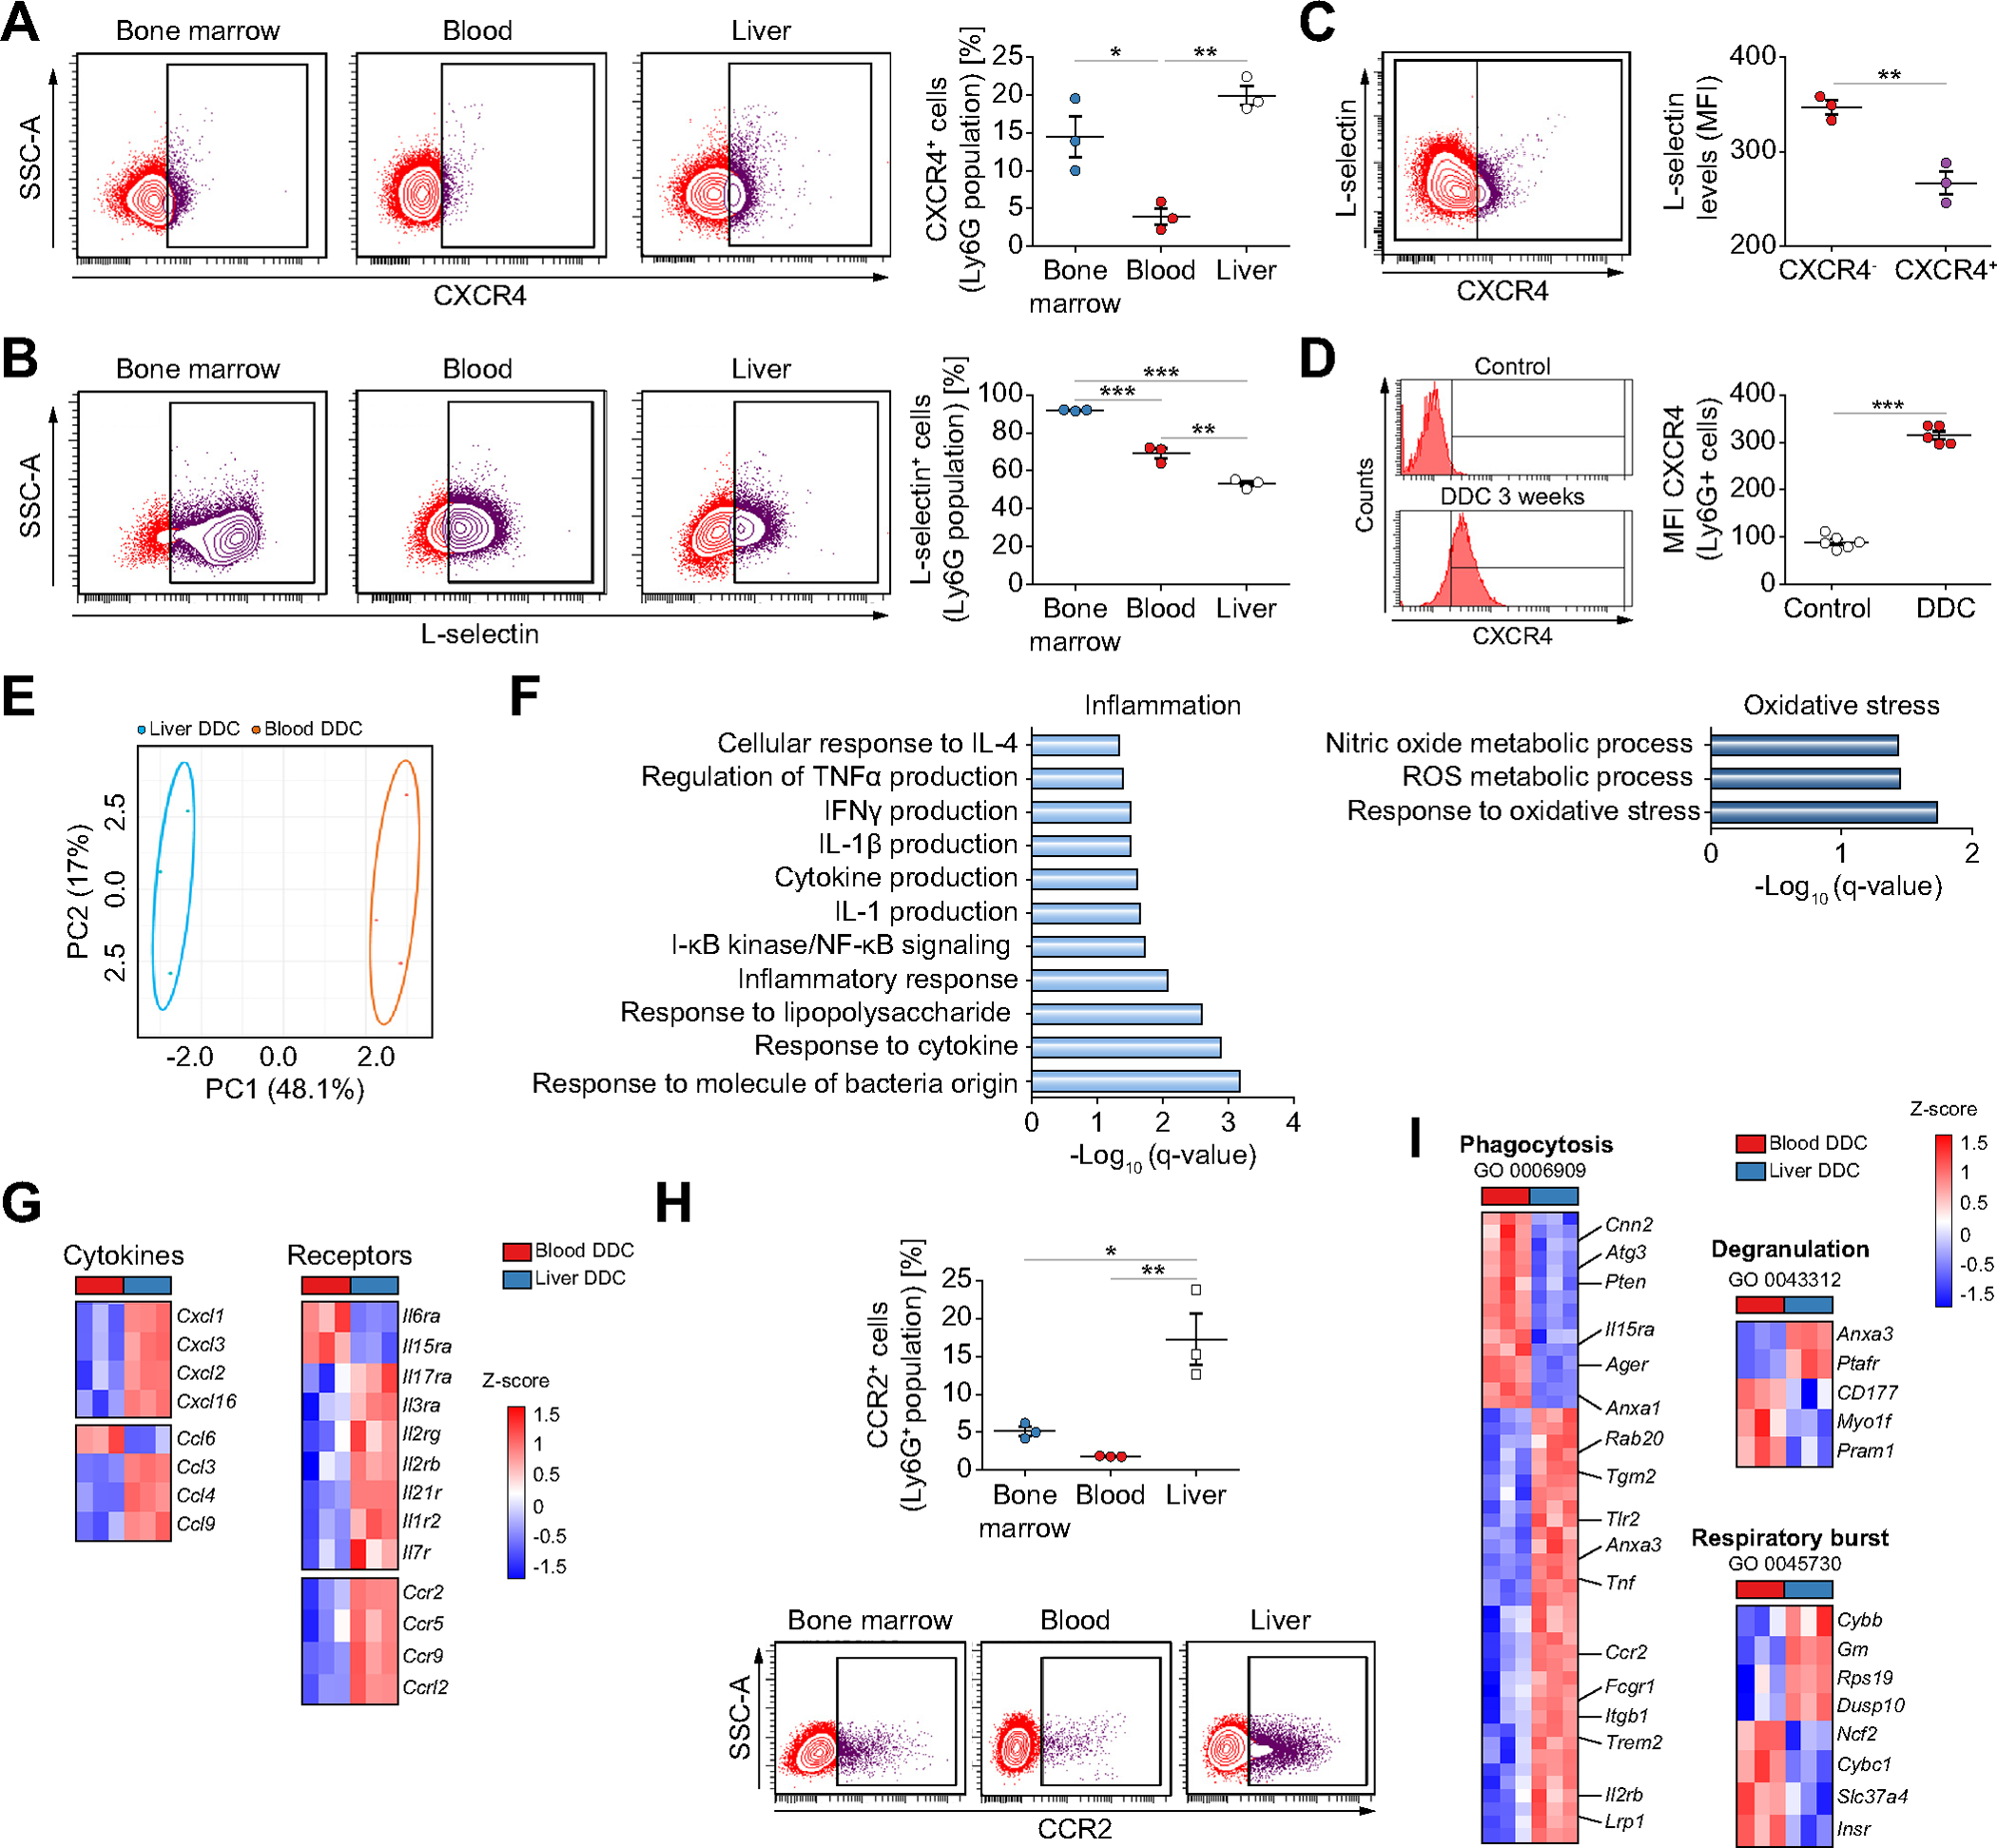
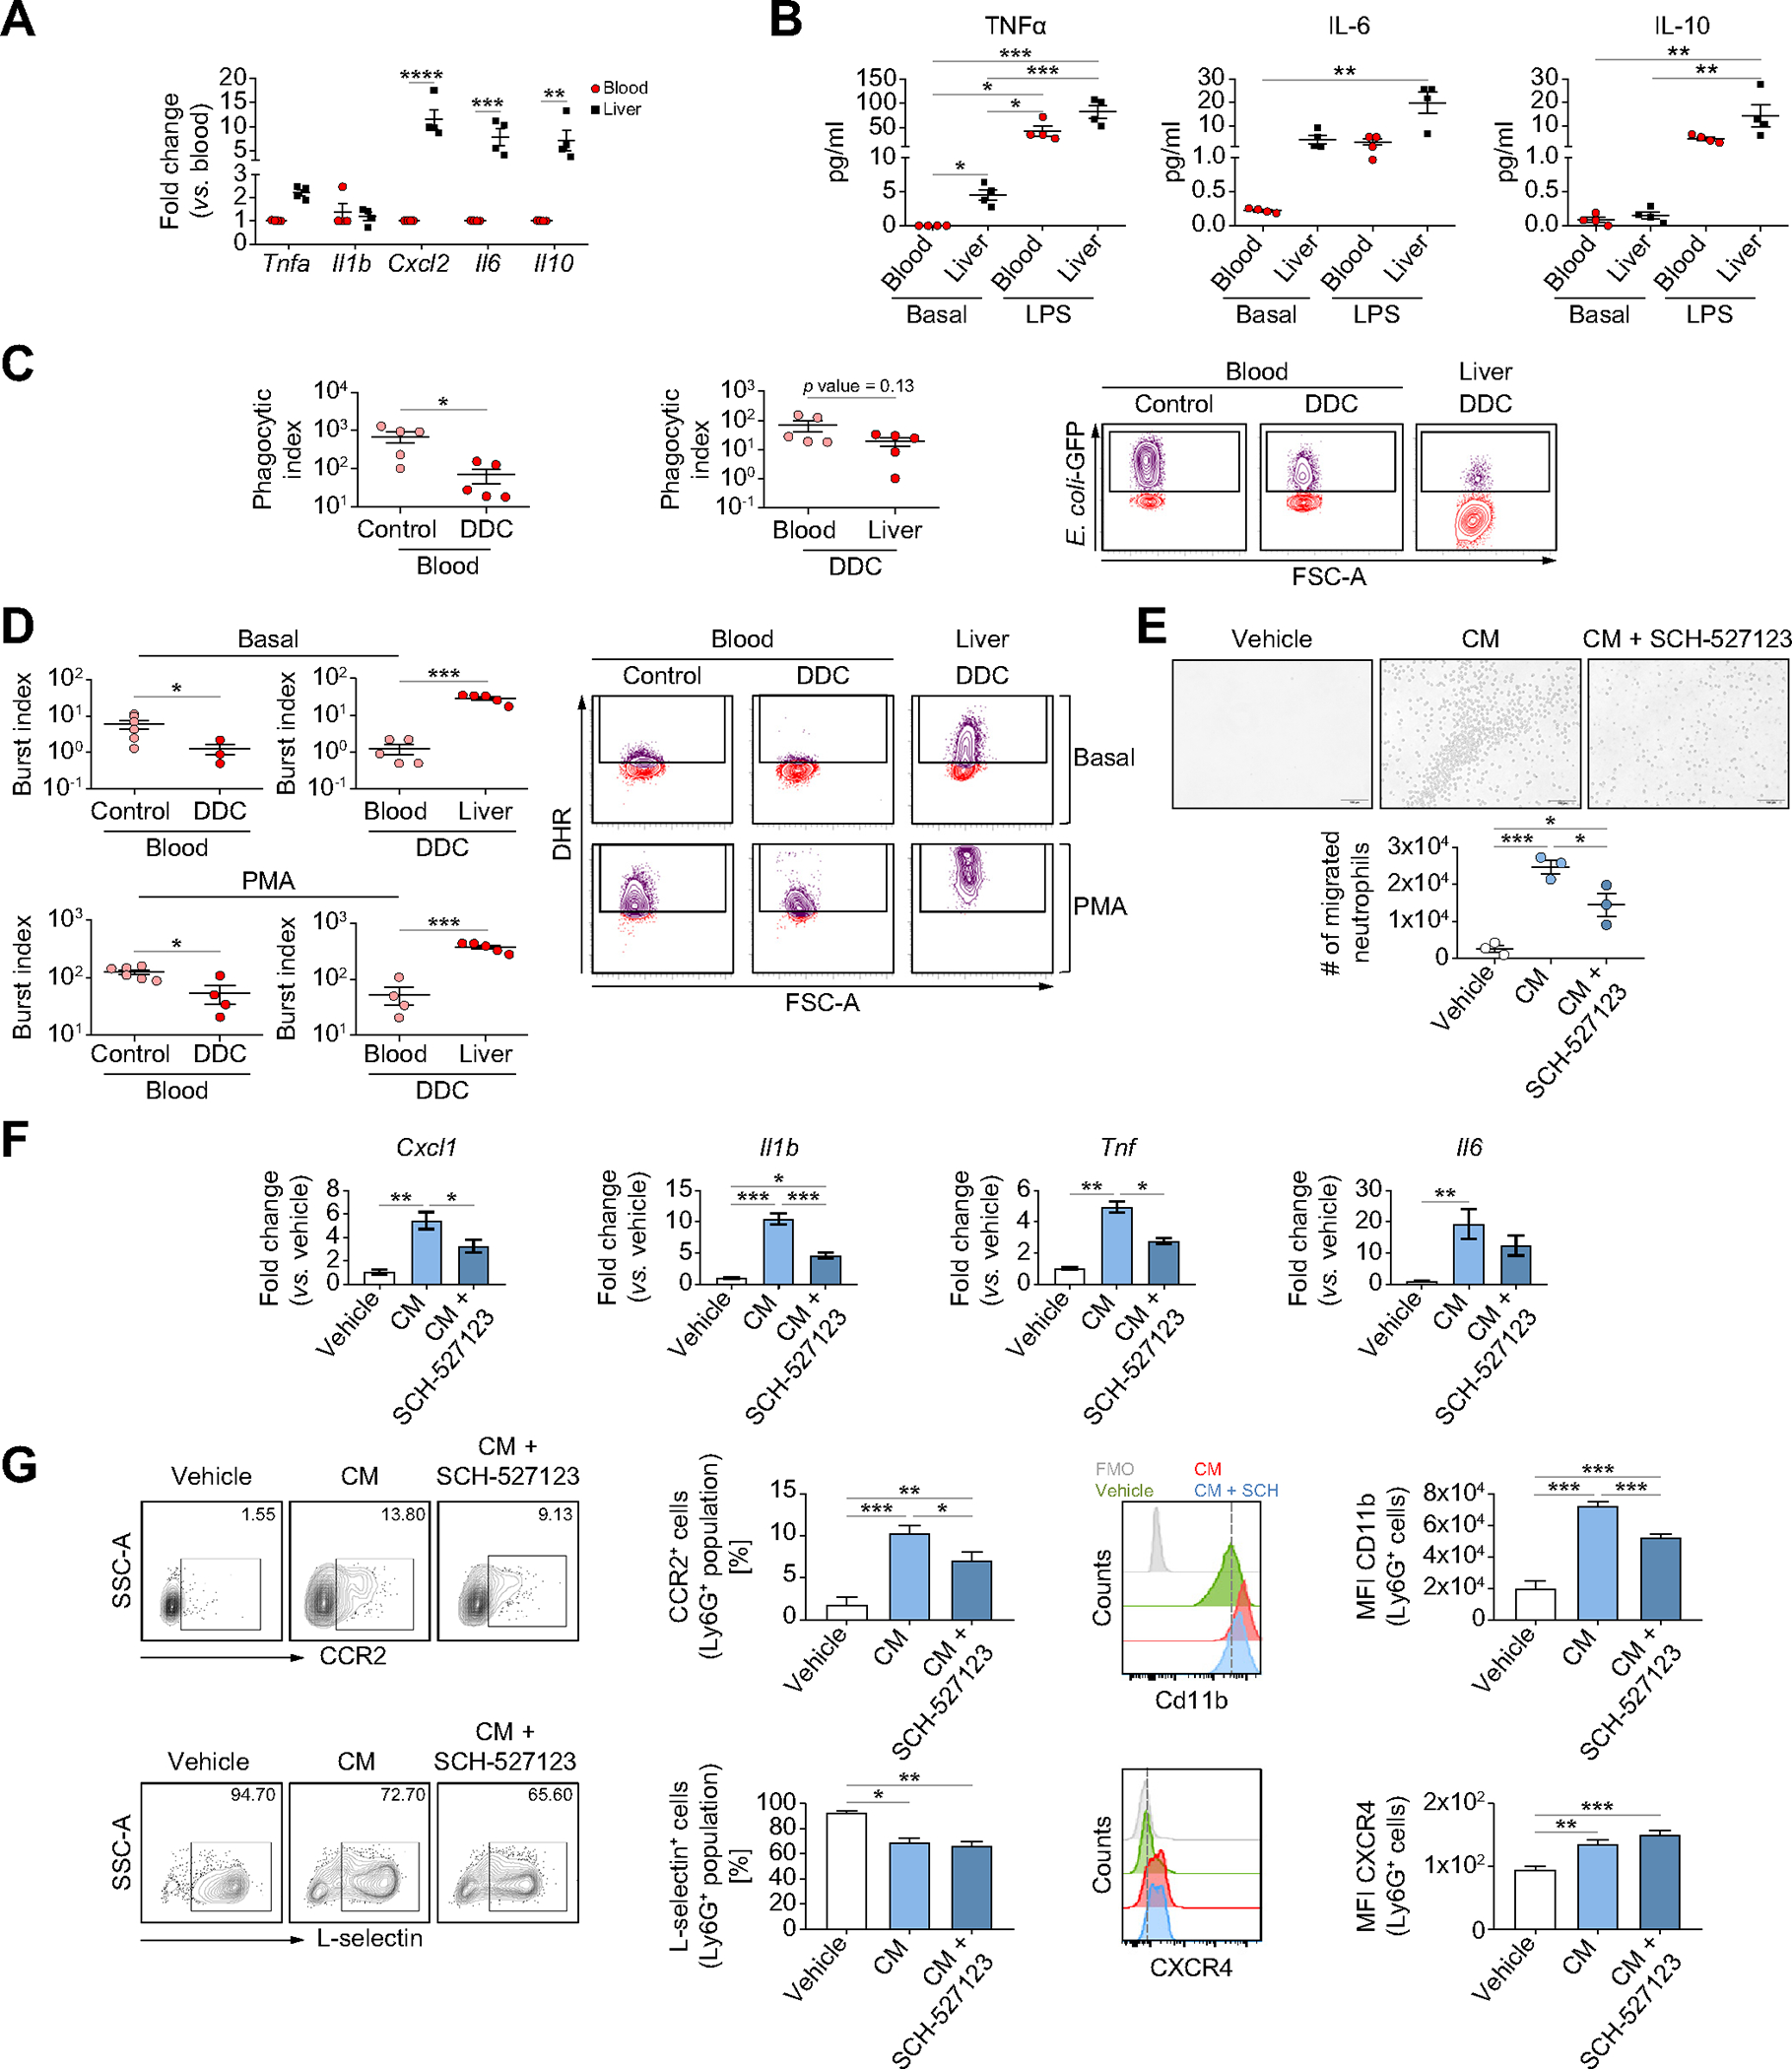
Results: In this study we describe a population of ductular reaction-associated neutrophils (DRANs), which are in direct contact with biliary epithelial cells in chronic liver diseases and whose numbers increased in parallel with disease progression. We show that DRANs are immobilized at the site of ductular reaction for a prolonged period of time. In addition, liver neutrophils display a unique phenotypic and transcriptomic profile, showing a decreased phagocytic capacity and increased oxidative burst. Depletion of neutrophils or inhibition of their recruitment reduces DRANs and the expansion of ductular reaction, while mitigating liver fibrosis and angiogenesis. Mechanistically, neutrophils deficient in PAD4 and ELANE abrogate neutrophil-induced biliary cell proliferation, thus indicating the role of neutrophil extracellular traps and elastase release in ductular reaction expansion.

Conclusions: Overall, our study reveals the accumulation of DRANs as a hallmark of advanced liver disease and a potential therapeutic target to mitigate ductular reaction and the maladaptive wound-healing response.

Impact and implications: Our results indicate that neutrophils are highly plastic and can have an extended lifespan. Moreover, we identify a new role of neutrophils as triggers of expansion of the biliary epithelium. Overall, the results of this study indicate that ductular reaction-associated neutrophils (or DRANs) are new players in the maladaptive tissue-healing response in chronic liver injury and may be a potential target for therapeutic interventions to reduce ductular reaction expansion and promote tissue repair in advanced liver disease.

Keywords: Ductular reaction; biliary cells; chronic injury; elastase; neutrophil extracellular traps; neutrophils; organoids.


Conflict of interest statement

Conflict of interest

The authors declare no conflicts of interest that pertain to this work.

Please refer to the accompanying ICMJE disclosure forms for further details.

Figures

Fig. 1.
Fig. 1.. DRANs are recruited to the biliary epithelium.
(A) Immunofluorescence of MPO and KRT7 in liver sections of patients with ALD, NASH, HCV, HBV and PBC. Scale bar: 100 μm. (B) Immunofluorescence of DRANs (MPO) at biliary epithelium (KRT7) in hepatic biopsies of patients with ALD. Percentage of MPO+ cells at periportal areas and minimum distance of MPO+ cells to KRT7+ cells. Scale bar: 100 μm. (C) Clearing of 3 mm-liver section of a patient with cirrhosis. Arrows show neutrophils (MPO) attached to biliary cells (KRT7). (D) SD-IVM images of periportal and central areas in DDC-treated mice. (E) 3D-reconstruction of neutrophils (Ly6G) recruited to the biliary epithelium (EpCAM) in mice treated with DDC for 1 week. (F) SD-IVM images of DDC-treated mouse showing the progression of neutrophil (Ly6G) recruitment to ductular reaction (EpCAM). All data is presented as mean ± SEM. *p <0.05, **p <0.01, ***p <0.001 as determined by one-way ANOVA with Tukey’s multiple comparison test (B, F). AH, alcohol-related hepatitis; ALD, alcohol-related liver disease; CH, cirrhosis; DDC, 3,5-diethoxycarbonyl-1,4-dihydrocollidine; DRANs, ductular reaction-associated neutrophils; EpCAM, epithelial cell adhesion molecule; FOV, field of view; KRT, cytokeratin; Ly6G, lymphocyte antigen 6 complex locus G6D; MPO, myeloperoxidase; NASH, non-alcoholic steatohepatitis; PBC, primary biliary cholangitis; SD-IVM, spinning-disk confocal intravital microscopy.
Fig. 2.
Fig. 2.. DRANs are immobilized at the biliary epithelium and remain static.
(A) Time-lapse SD-IVM images showing neutrophil (Ly6G) static behaviour at ductular reaction (EpCAM) sites. (B) SD-IVM images of FTI (Sytox Green) in mice treated with DDC for 1 week. Quantification of neutrophils (Ly6G) retained at EpCAM+ cells per FOV. (C) Flow cytometry plots showing Ly6G+ EdU+ neutrophils. (D) Percentage of Ly6G+ EdU+ neutrophils (n = 3–4 mice per time point). Data presented as mean ± SEM. Each time point was compared by two-way ANOVA with Dunnett’s multiple comparison test vs. day 3 (bone marrow samples) or day 4 (liver and blood samples). *p <0.05, **p <0.01 and ***p <0.001. (E) Immunofluorescence (scale bar: 50 μm) and EdU immunohistochemistry (scale bar: 100 μm) of liver sections of mice fed with DDC after 5 days of EdU injection. EdU, 5-ethynyl-2’-deoxyuridine; FOV, field of view; FTI, focal thermal injury; Ly6G, lymphocyte antigen 6 complex locus G6D; SD-IVM, spinning-disk confocal intravital microscopy.
Fig. 3.
Fig. 3.. Liver neutrophils in chronic liver damage acquire an aged and pro-inflammatory phenotype.
Flow cytometry analysis of the expression of CXCR4 (A) and L-selectin (B) in Ly6G+ cells (n = 3 mice per group). (C) Flow cytometry analysis of DDC-treated liver neutrophils (n = 3 mice per group). (D) Flow cytometry analysis of liver neutrophils (n = 5 mice per group). (E) Principal component analysis of transcriptomic data of neutrophils from DDC-treated mice (n = 3 mice per group). (F) Enriched gene ontology biological processes in liver neutrophils compared to blood neutrophils. (G) Heat map of differentially expressed inflammatory cytokines and receptors (n = 3 mice per group). (H) Flow cytometry analysis of CCR2 expression in Ly6G+ neutrophils in DDC-fed mice (n = 3 mice per group). (I) Heat map of differentially expressed genes associated with significantly enriched gene ontology annotations (n = 3 mice per group). All data is presented as mean ± SEM. *p <0.05, **p <0.01 and ***p <0.001 as determined by one-way ANOVA with Tukey’s multiple comparison test (A, B, H) and Student’s t test (C, D). CCR2, C-C Motif Chemokine Receptor 2; CXCR4, C-X-C motif chemokine receptor 4; DDC, 3,5-diethoxycarbonyl-1,4-dihydrocollidine; Ly6G, lymphocyte antigen 6 complex locus G6D; MFI, median fluorescence intensity.
Fig. 4.
Fig. 4.. Liver neutrophils in chronic injury present an altered functionality.
(A) Gene expression analysis of liver and circulating neutrophils from DDC-treated mice (n = 4 mice per group). (B) Supernatant levels of cytokines in neutrophils stimulated with LPS (100 ng/ml) or vehicle for 6 h (n = 4 mice per group). (C) Phagocytic activity of neutrophils isolated from DDC and control mice (n = 5 mice per group). Phagocytic index: % of Ly6G+E. coli-FITC+ cells × MIF/100. (D) Neutrophil oxidative burst at basal or PMA-stimulated contexts in neutrophils from DDC and control mice (n = 5–6 mice per group). Burst index: % of Ly6G+ Rhodamine+ cells × MIF/100. (E) Images and number of migrated neutrophils (n = 3) when exposed to biliary organoid-conditioned media (n = 3) and SCH-527123 (50 μm) for 2 h. Scale bar: 100 μm (F) Gene expression analysis of neutrophils (n = 3) treated with organoid-conditioned media (n = 3) and SCH-527123 (50 μm) for 6 h. (G) Flow cytometry analysis of CCR2, L-selectin, CD11b and CXCR4 expression in neutrophils (n = 4–5) treated for 18 h with organoid-conditioned media (n = 3) and SCH-527123 (50 μm). All data is presented as mean ± SEM. *p <0.05, **p <0.01 and ***p <0.001 as determined by two-way ANOVA with Sidak’s multiple comparison (A), one-way ANOVA with Tukey’s multiple comparison (Cxcl1 and Il1b in E, F, CCR2, CD11b and CXCR4 in G), Kruskal-Wallis test with Dunn’s multiple comparison (B, Tnf and Il6 in E; L-selectin in G) or Student’s t test (C, D). CCR2, C-C Motif Chemokine Receptor 2; CM, conditioned media; CXCR4, C-X-C motif chemokine receptor 4; DDC, 3,5-diethoxycarbonyl-1,4-dihydrocollidine; GFP, green fluorescent protein; LPS, lipopolysaccharide, Ly6G, lymphocyte antigen 6 complex locus G6D; MFI, median fluorescence intensity; PMA, phorbol 12-myristate 13-acetate.
Fig. 5.
Fig. 5.. Long-term depletion of neutrophils in chronic liver injury leads to a decrease in proliferating biliary epithelial cells.
(A) Immunohstochemistry analysis of livers of control- and DDC-treated mice with anti-Ly6G antibody (1A8) or isotype (n = 4 mice per group). Scale bars: 100 μm. (B) Staining of progenitor markers in mice treated with anti-Ly6G antibody (1A8) and isotype. Scale bars: 100 μm. (C) Immunofluorescence of KRT19 and CCND1 of liver sections of mice treated with anti-Ly6G antibody (1A8) and isotype (n = 3 mice per group). Scale bars: 50 μm. All data is presented as mean ± SEM. *p <0.05, **p <0.01 and ***p <0.001 as determined by one-way ANOVA with Tukey’s multiple comparison test (MPO, KRT19, S/R in A), one-way ANOVA Kruskal-Wallis with Dunn’s multiple comparison test (CD31 in A) and Mann-Whitney test (C). CCND1, cyclin D1; CD31, cluster of differentiation 31; DDC, 3,5-diethoxycarbonyl-1,4-dihydrocollidine; EpCAM, epithelial cell adhesion molecule; ISO, isotype; KRT, cytokeratin; MPO, myeloperoxidase; Ly6G, lymphocyte antigen 6 complex locus G6D; SOX9, SRY-Box transcription factor 9; S/R, sirius red.
Fig. 6.
Fig. 6.. Blocking neutrophil recruitment by CXCR1/2 inhibitor reduces biliary epithelium expansion in chronic injury.
(A) Mice were fed with DDC and treated daily with CXCR1/2 inhibitor (SCH-527123) for 3 weeks at a dose of 50 mg/kg. (B) Immunohistochemistry analysis of liver sections of control and 3-weeks DDC-fed mice treated with SCH-527123 or vehicle (n = 5–6 mice per group). Scale bars: 100 μm. (C) Immunofluorescence of progenitor markers in liver sections of mice fed with DDC for 3 weeks and treated with SCH-527123 inhibitor or vehicle. Scale bars: 100 μm. (D) Immunofluorescence of KRT19 and CCND1 in mice treated with SCH-527123 or vehicle (n = 3–5 mice per group). Scale bars: 50 μm. Data presented as mean ± SEM. *p <0.05, **p <0.01 and ***p <0.001 as determined by one-way ANOVA with Tukey’s multiple comparison test (B) and Student’s t test (D). CCND1, cyclin D1; CD31, cluster of differentiation 31; DDC, 3,5-diethoxycarbonyl-1,4-dihydrocollidine; EpCAM, epithelial cell adhesion molecule; KRT, cytokeratin; MPO, myeloperoxidase; SOX9, SRY-Box transcription factor 9; S/R, sirius red; Veh, vehicle; wk, weeks.
Fig. 7.
Fig. 7.. Depletion of NETosis and elastase release reduces liver progenitor cell expansion.
(A) Immunofluorescence of MPO and citH3 in WT and Pad4−/− liver sections (n = 4 mice per group). Scale bars: 100 μm. (B) Immunohistochemistry analysis of WT and Pad4−/− mice liver sections (n = 4–7 mice per group). Scale bars: 100 μm. (C) Immunofluorescence of KRT19-EpCAM and KRT19-SOX9 in WT and Pad4−/− mouse liver sections. Scale bars: 100 μm. (D) Immunofluorescence of KRT19 and CCND1 in WT and Pad4−/− mice (n = 4–6 mice per group). Scale bars: 50 μm. (E) Immunofluorescence of NETs in WT and Elane−/− liver sections (n = 4 mice per group). Scale bars: 100 μm. (F) Immunohistochemistry analysis of MPO and KRT19 in WT and Elane−/− mouse liver sections (n = 4–5 mice per group). Scale bars: 100 μm. (G) Immunofluorescence of progenitor markers in WT and Elane−/− mouse liver sections. Scale bars: 100 μm. (H) Immunofluorescence of KRT19 and CCND1 in WT and Elane−/− mice. Scale bars: 50 μm. (I) Images of biliary organoids and WT or Elane−/− neutrophil co-culture. Organoid area is normalized per microcavity area. Each measurement represents a technical replicate consisting of the average area of at least 40 microcavities (n = 3 mice-derived organoids). Scale bar: 500 μm. Data presented as mean ± SEM. *p <0.05, **p <0.01 and ***p <0.001 as determined by Student’s t test (A, B, D, E, F, H) and one-way ANOVA with Tukey’s multiple comparison test (I). CCND1, cyclin D1; citH3, citrullinated histone H3; DDC, 3,5-diethoxycarbonyl-1,4-dihydrocollidine; Elane, neutrophil elastase; EpCAM, epithelial cell adhesion molecule; FOV, field of view; KRT, cytokeratin; MPO, myeloperoxidase; NETs, neutrophil extracellular traps; Pad4, peptidyl arginine deiminase 4; SOX9, SRY-Box transcription factor 9; WT, wild-type.

Comment in

References

    1. Aguilar-Bravo B, Rodrigo-Torres D, Ariño S, Coll M, Pose E, Blaya D, et al. Ductular reaction cells display an inflammatory profile and recruit neutrophils in alcoholic hepatitis. Hepatology 2019;69:2180–2195. 10.1002/hep.30472. - DOI - PMC - PubMed
    1. Govaere O, Cockell S, Van Haele M, Wouters J, Van Delm W, Van den Eynde K, et al. High-throughput sequencing identifies aetiology-dependent differences in ductular reaction in human chronic liver disease. J Pathol 2019;248:66–76. 10.1002/path.5228. - DOI - PubMed
    1. Takeuchi M, Vidigal PT, Guerra MT, Hundt MA, Robert ME, Olave-Martinez M, et al. Neutrophils interact with cholangiocytes to cause cholestatic changes in alcoholic hepatitis. Gut 2021;70:342–356. 10.1136/gutjnl-2020-322540. - DOI - PMC - PubMed
    1. Wiggins BG, Pallett LJ, Li X, Davies SP, Amin OE, Gill US, et al. The human liver microenvironment shapes the homing and function of CD4+ T-cell populations. Gut 2022;71:1399–1411. 10.1136/GUTJNL-2020-323771. - DOI - PMC - PubMed
    1. Zimmer CL, von Seth E, Buggert M, Strauss O, Hertwig L, Nguyen S, et al. A biliary immune landscape map of primary sclerosing cholangitis reveals a dominant network of neutrophils and tissue-resident T cells. Sci Transl Med 2021;13:3107. 10.1126/SCITRANSLMED.ABB3107/SUPPL_FILE/SCITRANSLMED.ABB3107_SM.PDF. - DOI - PubMed

Publication types