. 2023 Nov;79(5):1214-1225.
doi: 10.1016/j.jhep.2023.05.043. Epub 2023 Jun 20.

GARP on hepatic stellate cells is essential for the development of liver fibrosis

Affiliations

GARP on hepatic stellate cells is essential for the development of liver fibrosis

Xiaolong Zhang et al. J Hepatol. 2023 Nov.

Abstract

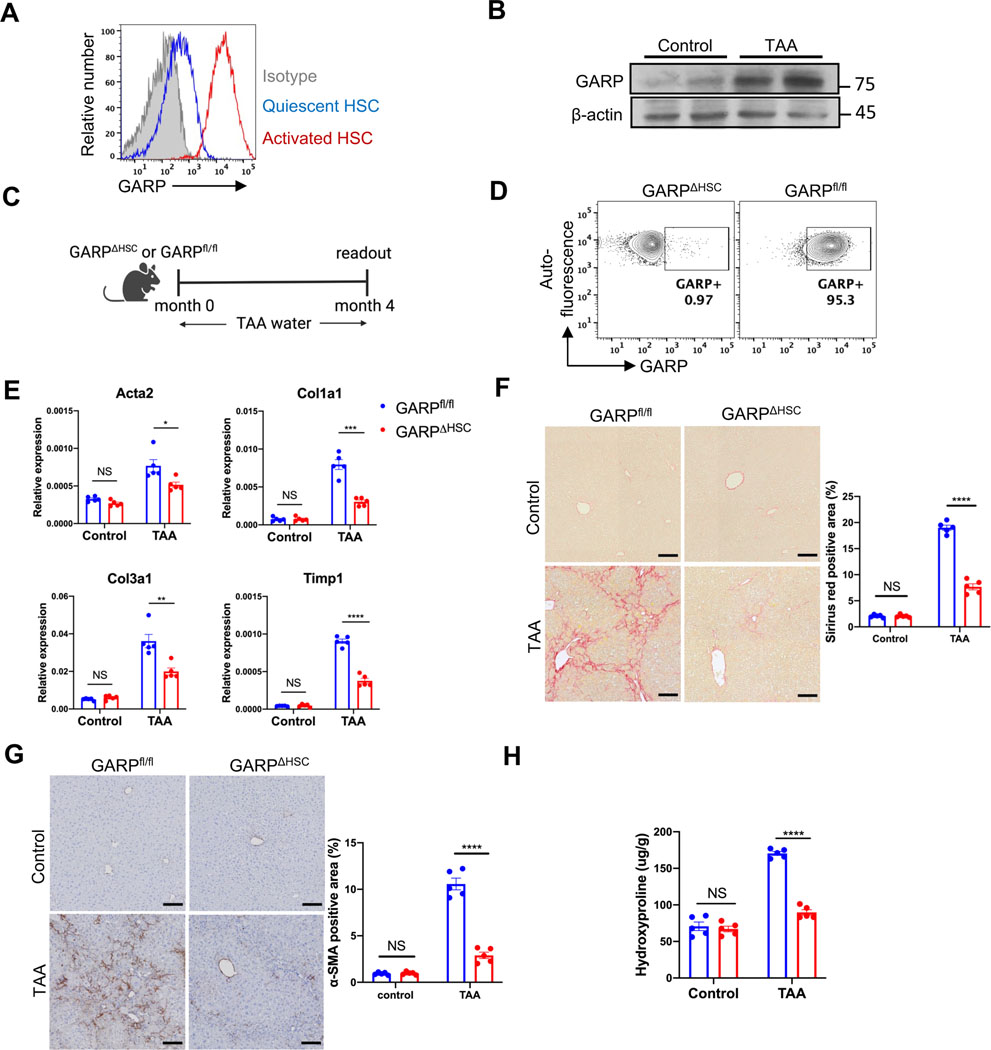
Background & aims: Glycoprotein A repetitions predominant (GARP) is a membrane protein that functions as a latent TGF-β docking molecule. While the immune regulatory properties of GARP on blood cells have been studied, the function of GARP on tissue stromal cells remains unclear. Here, we investigate the role of GARP expressed on hepatic stellate cells (HSCs) in the development of liver fibrosis.

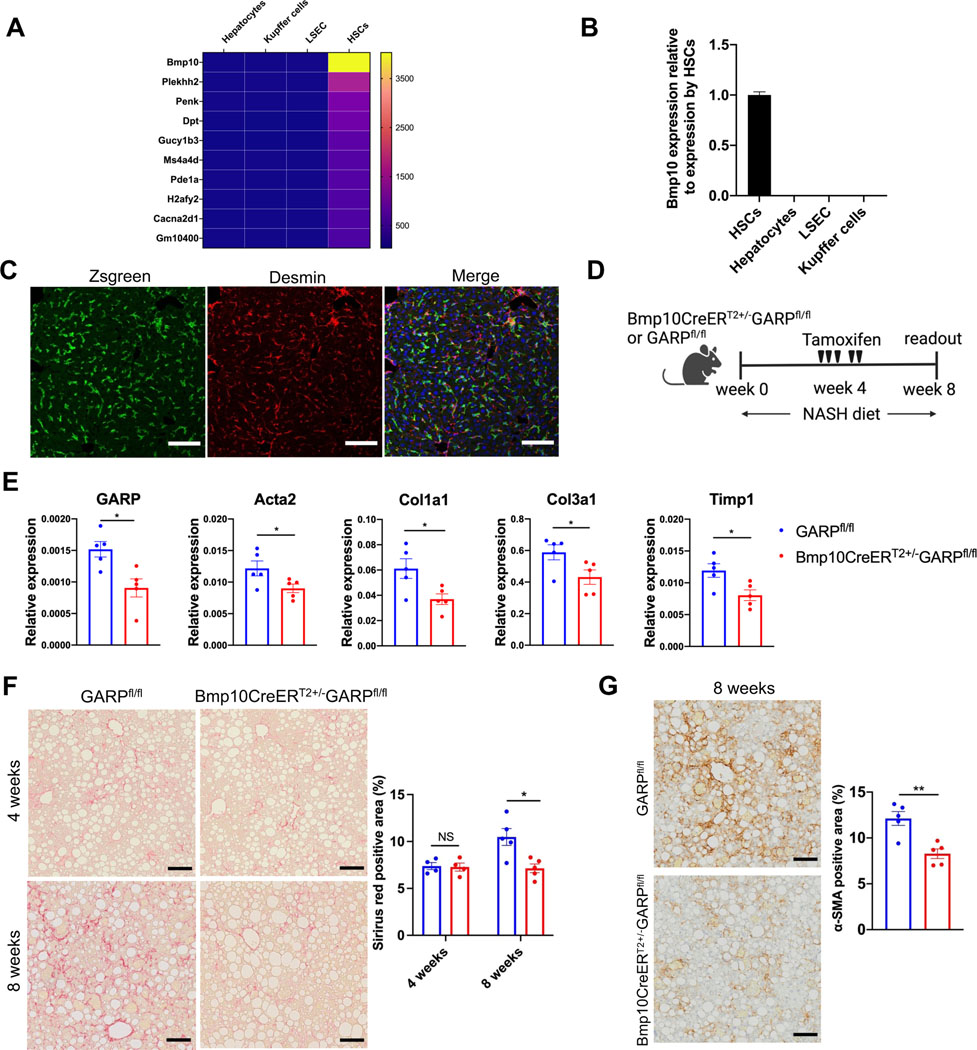
Methods: The function of GARP on HSCs was explored in toxin-induced and metabolic liver fibrosis models, using conditional GARP-deficient mice or a newly generated inducible system for HSC-specific gene ablation. Primary mouse and human HSCs were isolated to evaluate the contribution of GARP to the activation of latent TGF-β. Moreover, cell contraction of HSCs in the context of TGF-β activation was tested in a GARP-dependent fashion.

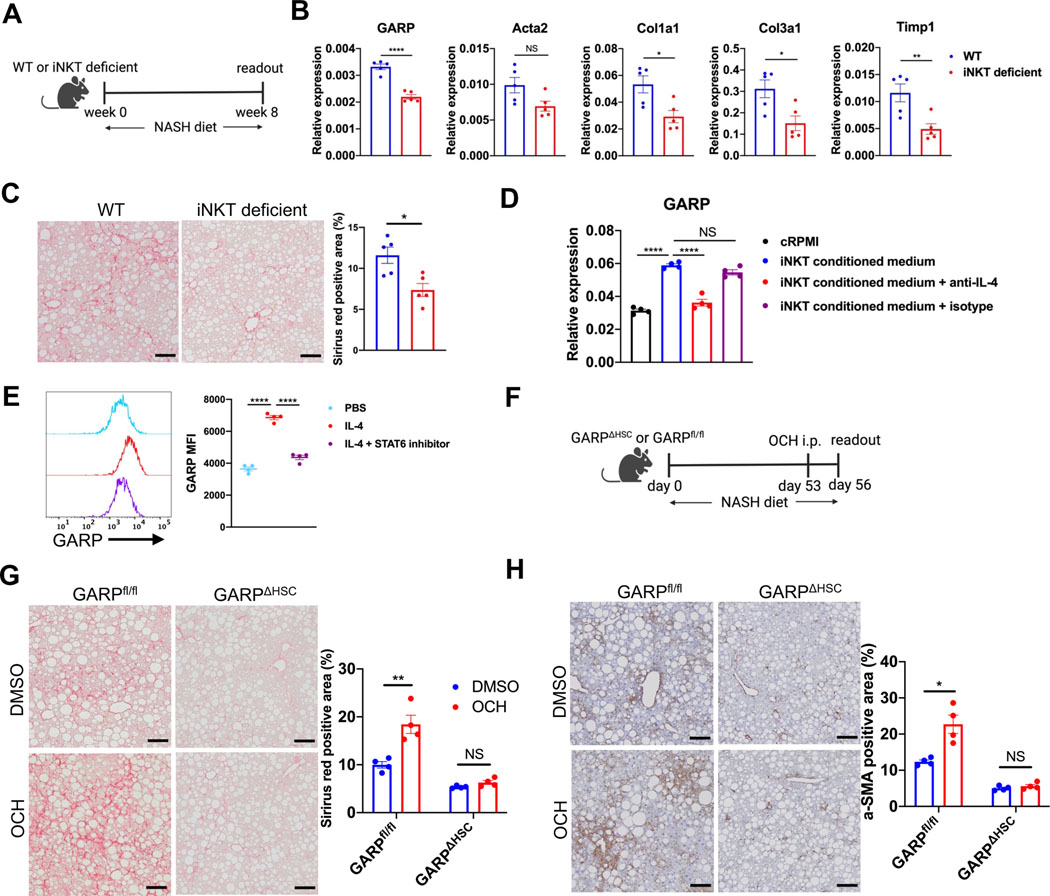
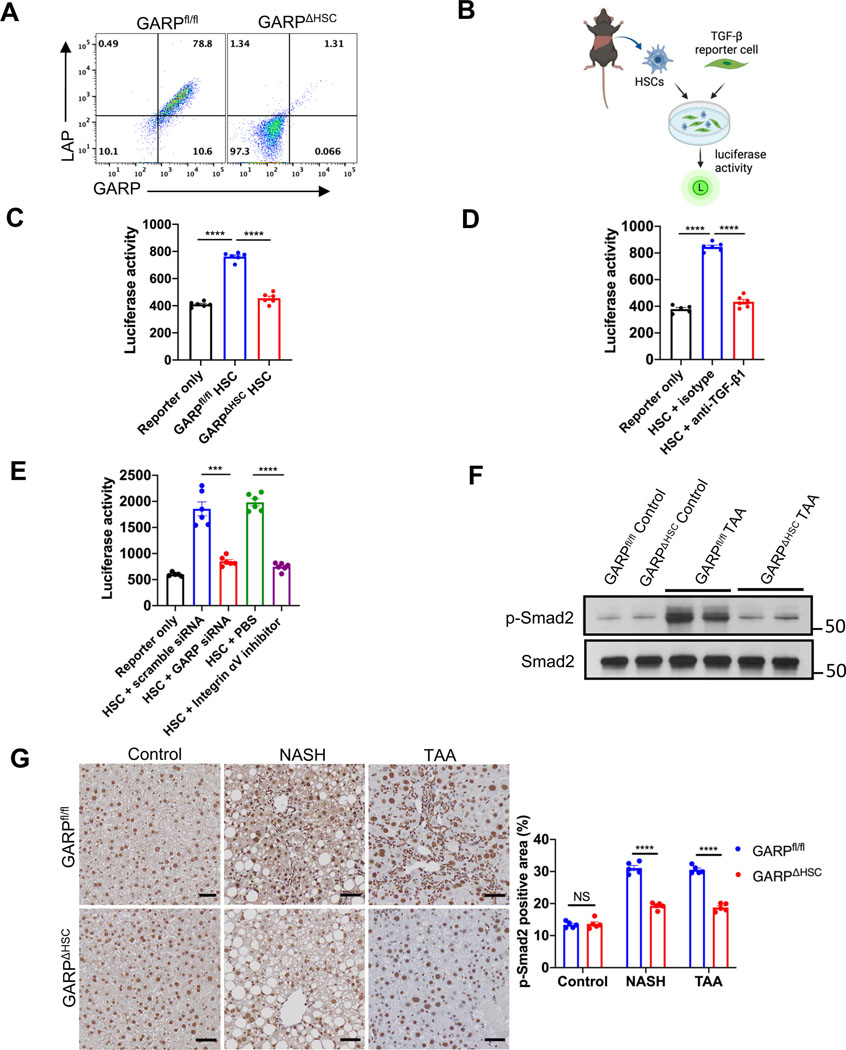
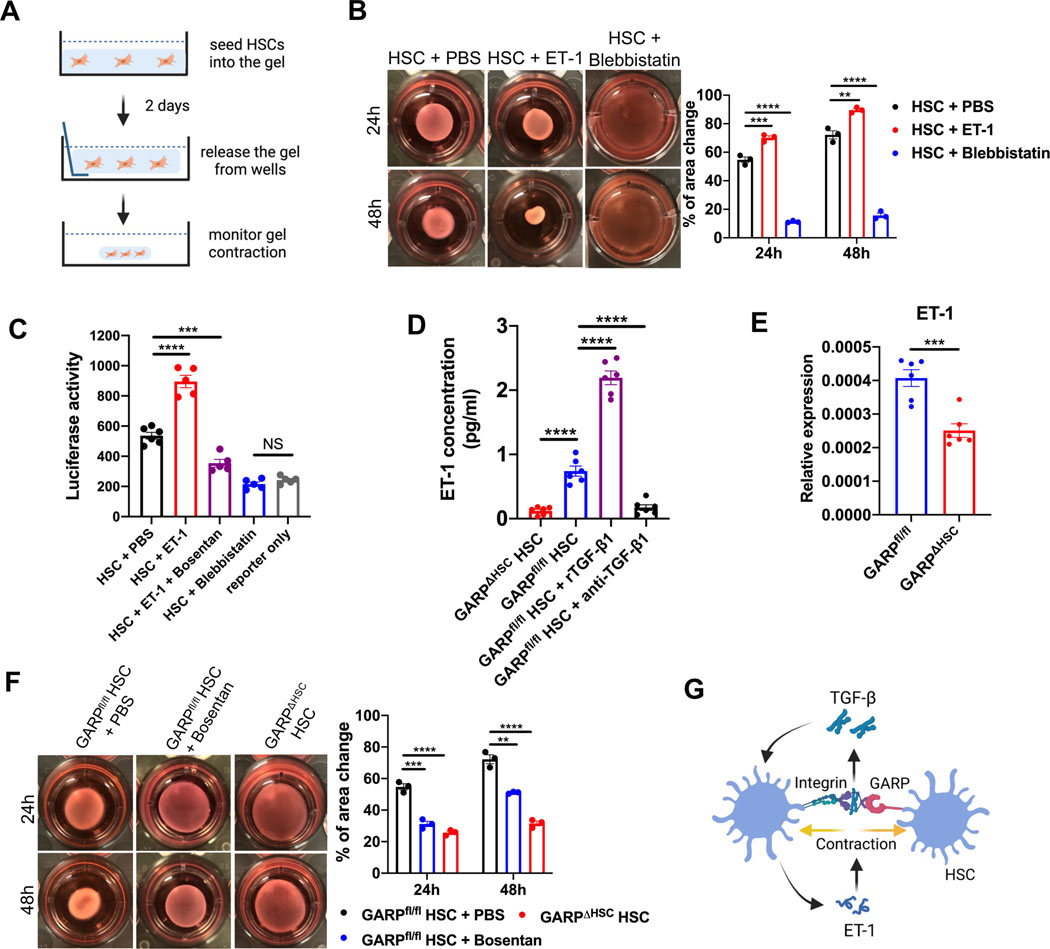
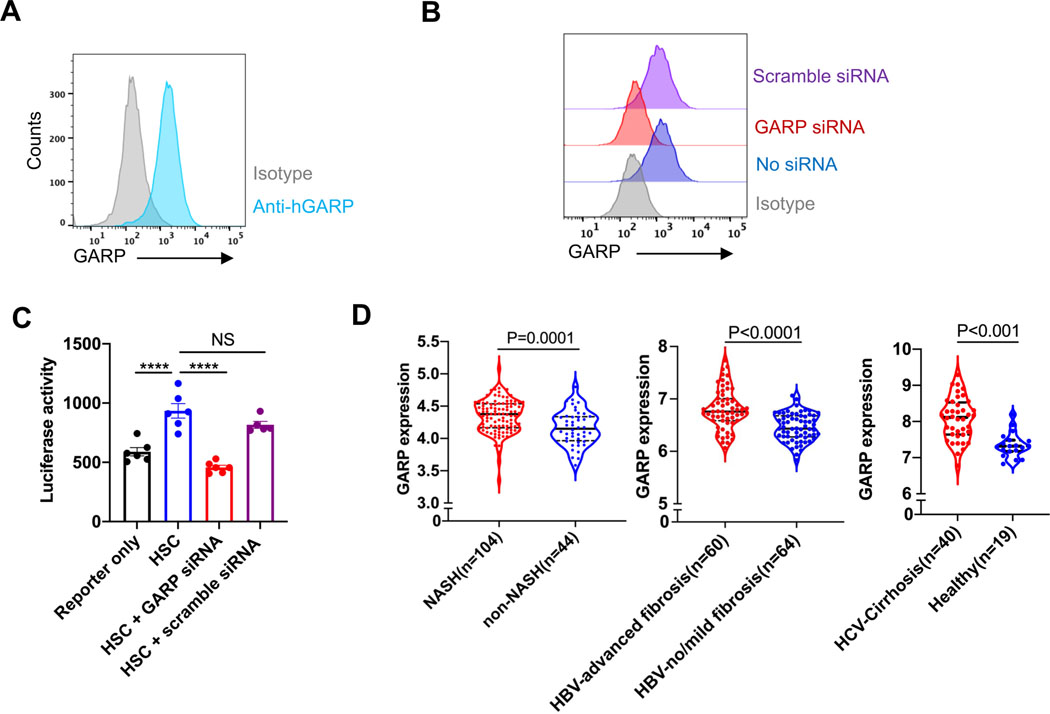
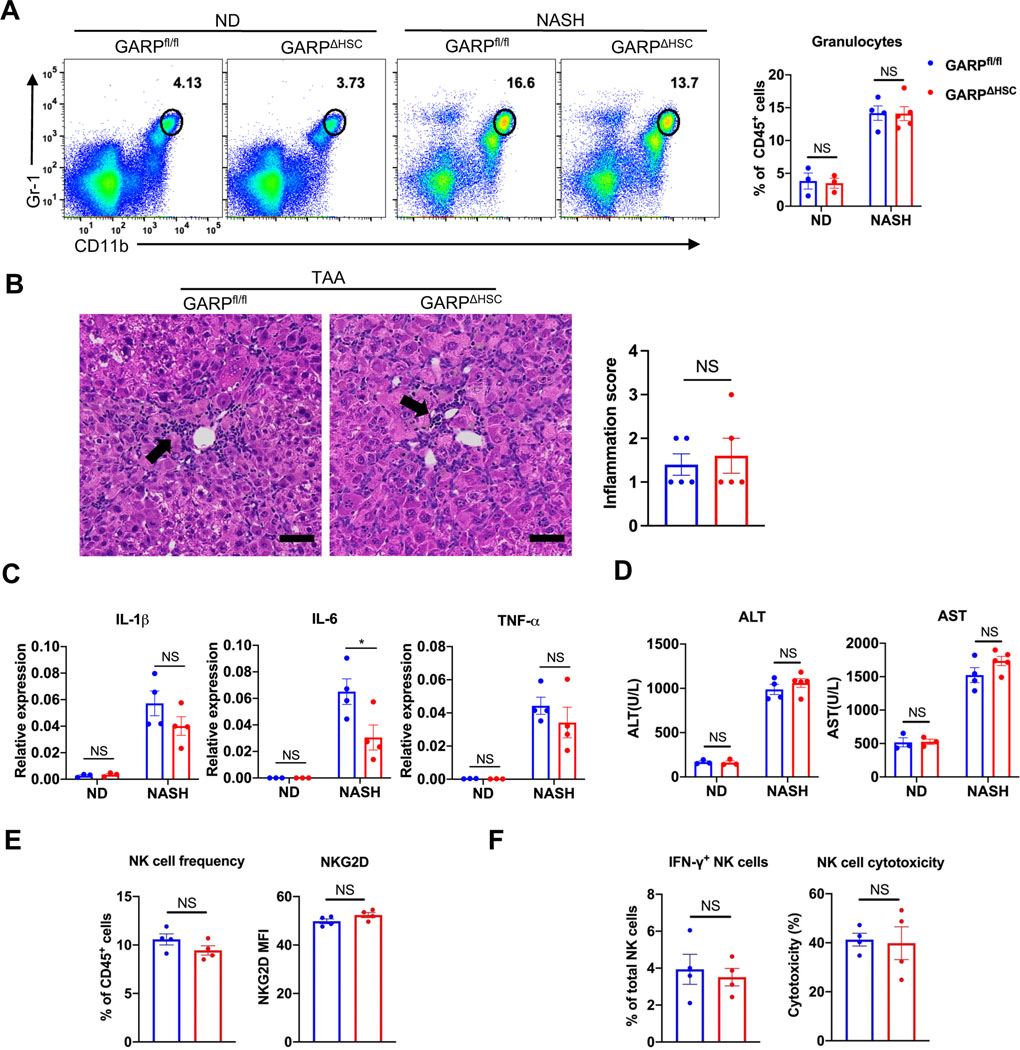
Results: Mice lacking GARP in HSCs were protected from developing liver fibrosis. Therapeutically deleting GARP on HSCs alleviated the fibrotic process in established disease. Furthermore, natural killer T cells exacerbated hepatic fibrosis by inducing GARP expression on HSCs through IL-4 production. Mechanistically, GARP facilitated fibrogenesis by activating TGF-β and enhancing endothelin-1-mediated HSC contraction. Functional GARP was expressed on human HSCs and significantly upregulated in the livers of patients with fibrosis. Lastly, deletion of GARP on HSCs did not augment inflammation or liver damage.

Conclusions: GARP expressed on HSCs drives the development of liver fibrosis via cell contraction-mediated activation of latent TGF-β. Considering that systemic blockade of TGF-β has major side effects, we highlight a therapeutic niche provided by GARP and surface-mediated TGF-β activation. Thus, our findings suggest an important role of GARP on HSCs as a promising target for the treatment of liver fibrosis.

Impact and implications: Liver fibrosis represents a substantial and increasing public health burden globally, for which specific treatments are not available. Glycoprotein A repetitions predominant (GARP) is a membrane protein that functions as a latent TGF-β docking molecule. Here, we show that GARP expressed on hepatic stellate cells drives the development of liver fibrosis. Our findings suggest GARP as a novel target for the treatment of fibrotic disease.

Keywords: GARP; TGF-β; endothelin-1 (ET-1); hepatic stellate cells (HSCs); liver fibrosis; natural killer T (NKT) cells.


Conflict of interest statement

Conflict of interest: The authors declare no conflict of interest.

Figures

Fig. 1.
Fig. 1.. GARP on HSCs exacerbates liver fibrosis.
(A) GARP expression on the surface of quiescent (1-day cultured) or activated (7-day cultured) HSCs detected by flow cytometry. (B) Immunoblot of GARP in liver lysates of mice fed with TAA for 4 months or control naïve mice. (C) Experimental design of TAA-induced liver fibrosis in GARPΔHSC mice and GARPfl/fl littermates. (D) Flow cytometry analysis of GARP expression on the surface of HSCs. HSCs were isolated from the liver of mice fed with TAA for 4 months and were gated on vitamin A-mediated autofluorescence. (E) Fibrotic gene expression in the liver of mice determined by qRT-PCR. (F) Representative images of Sirius red staining of mouse liver (left) and quantification of stained area (right). Scale bar 100 μm. (G) Representative images of IHC staining of α-SMA in the liver of mice (left) and quantification of stained area (right). Scale bar 100 μm. (H) Concentration of hydroxyproline in the liver of mice. Each data point represents one mouse. Data are presented as mean ± standard error of mean (SEM). Data are from one experiment representing at least three independent experiments with similar results. Unpaired t-test was used to compare two groups. *p<0.05;**p<0.01;***p<0.001;****p<0.0001; NS, not significant.
Fig. 2.
Fig. 2.. Therapeutic deletion of GARP in established disease alleviates fibrogenesis.
(A) Heat map of the genes with high expression in HSCs (signal intensity >500) and low expression in other liver-resident cells (signal intensity <100). Gene expression was determined by microarray analysis. (B) Bmp10 mRNA expression in liver-resident cells detected by qRT-PCR. (C) IF staining in the liver of Bmp10CreERT2+/−Ai6 mice 12 days after last tamoxifen administration as analyzed by confocal microscopy. Zsgreen (green), desmin (red), nucleus (blue). Scale bar 100 μm. (D) Experimental design of induced GARP deletion during NASH diet-mediated liver fibrosis. (E) GARP and fibrotic gene expression in the liver of mice detected by qRT-PCR. (F) Representative images of Sirius red staining of mouse liver (left) and quantification of stained area (right). Scale bar 100 μm. (G) Representative images of IHC staining of α-SMA in the liver of mice (left) 8 weeks after NASH diet and quantification of stained area (right). Each data point represents a single mouse. Data are presented as mean ± SEM. Data in E-G are from one experiment representing at least two independent experiments with similar results. Unpaired t-test was used to compare two groups. *p<0.05;**p<0.01. NS, not significant.
Fig. 3.
Fig. 3.. NKT cells promote fibrotic scarring by inducing GARP expression on HSCs through IL-4 production.
(A) Experimental design of NASH diet-induced liver fibrosis in wild-type (WT) or Traj18-knockout (iNKT-deficient) mice. (B) GARP and fibrotic gene expression in the liver of mice detected by qRT-PCR. (C) Representative images of Sirius red staining of mouse liver (left) and quantification of stained area (right). Scale bar 100 μm. (D) GARP mRNA expression in HSCs treated with complete RPMI (cRPMI) or iNKT-conditioned medium in the presence or absence of anti-IL-4 or isotype control antibody. (E) Representative histogram plot (left) and mean fluorescent intensity (MFI) (right) of GARP staining on the surface of HSCs after incubation with PBS, recombinant IL-4, or IL-4 plus STAT6 inhibitor AS1517499. (F) Scheme of OCH injection during NASH diet-induced liver fibrosis. (G) Representative images of Sirius red staining of mouse liver (left) and quantification of stained area (right). Scale bar 100 μm. (H) Representative images of IHC staining of α-SMA in the liver of mice (left) and quantification of stained area (right). Scale bar 100 μm. Each data point represents a single mouse in A-C and F-H or one well in D-E. Data are presented as mean ± SEM and are from one experiment representative of at least two independent experiments with similar results. Unpaired t-test in B-C, G-H and one-way ANOVA in D-E were used to compare two groups. *p<0.05;**p<0.01;***p<0.001;****p<0.0001; NS, not significant.
Fig. 4.
Fig. 4.. GARP on HSCs facilitates fibrogenesis by activating TGF-β.
(A) Flow cytometry analysis of GARP and LAP expression on the surface of HSCs isolated from GARPfl/fl or GARPΔHSC mice and culture-activated for 7 days. (B) Schematic of TGF-β reporter assay using isolated HSCs and active TGF-β reporter cells. (C) TGF-β activation by HSCs from GARPfl/fl or GARPΔHSC mice. (D) TGF-β activation by WT HSCs in the presence of anti-TGF-β1 or isotype antibody. (E) TGF-β activation by WT HSCs treated with scramble siRNA, or GARP siRNA, or incubated with PBS, or integrin inhibitor CWHM12. (F) Immunoblot of p-Smad2 or total Smad2 in the liver lysates of mice fed with TAA for 4 months or control naïve mice. (G) Representative images of IHC staining for p-Smad2 in the liver of mice fed with NASH diet for 8 weeks, or TAA for 4 months, or control naïve mice (left), and quantification of stained area (right). Scale bar 50 μm. Each data point represents one well in C-E or a single mouse in G. Data are presented as mean ± SEM. One-way ANOVA in C-D and unpaired t-test in E-G were used to compare two groups. ***p<0.001;****p<0.0001; NS, not significant.
Fig. 5.
Fig. 5.. GARP fosters a vicious cycle involving endothelin-1 (ET-1) and TGF-β.
(A) Schematic of collagen gel assay to measure contraction of HSCs. (B) Representative images of collagen gel mixed with WT HSCs in the presence of PBS, ET-1, or blebbistatin, at time point 24 and 48 hours after gel release from the well side (left), and statistical analysis of change in gel area (right). (C) TGF-β activation by WT HSCs in the presence of PBS, ET-1, ET-1 plus bosentan, or blebbistatin. (D) ELISA of ET-1 concentration in the supernatant of GARPΔHSC or GARPfl/fl HSCs cultured in the presence of recombinant TGF-β1 (rTGF-β1) or anti-TGF-β1 antibody. (E) ET-1 mRNA level in the liver of mice fed with NASH diet for 8 weeks determined by qRT-PCR. (F) Representative images of collagen gel mixed with HSCs from GARPΔHSC or GARPfl/fl mice in the presence of PBS, or bosentan at 24 and 48 hours after gel release from the well side (left), and statistical analysis of change in gel area (right). (G) A graph illustrating GARP-mediated TGF-β activation, ET-1 production, and contraction by HSCs. Each data point represents one well in B-D and F or one mouse in E. Data are presented as mean ± SEM. One-way ANOVA in B-D, F and unpaired t-test in E were used to compare two groups. **p<0.01;***p<0.001;****p<0.0001; NS, not significant.
Fig. 6.
Fig. 6.. Functional GARP is present on human HSCs and upregulated in the liver of fibrosis patients.
(A) Flow cytometry analysis of GARP expression on the surface of human primary HSCs after 7 days culture. (B) FACS analysis of GARP expression on the surface of human HSCs treated with or without scramble siRNA or GARP siRNA. (C) TGF-β activation by human HSCs treated with or without scramble siRNA or GARP siRNA. Data are presented as mean ± SEM. (D) Level of GARP mRNA expression in liver biopsies of patients with NASH (left), HBV-induced advanced fibrosis (middle), or HCV-induced cirrhosis (right) compared to corresponding non-fibrosis or healthy individuals. Solid black line in the violin plots represents median. The upper and lower dotted black lines represent 75th and 25th percentile. Each data point indicates one well in C or one patient in D. One-way ANOVA in C and unpaired t-test in D were used to compare two groups. ***p<0.001; ****p<0.001;NS, not significant.
Fig. 7.
Fig. 7.. Targeting GARP on HSCs does not augment liver damage or inflammation.
(A) Representative FACS plots of granulocytes in the liver of mice (left) and quantification of its frequency (right). (B) Representative images of hematoxylin and eosin staining on mouse liver sections after 4 months of TAA treatment (left) and quantification of inflammation score (right). Black arrow indicates foci of infiltrating inflammatory cells. Scale bar 50 μm. (C) Expression of pro-inflammatory genes in the liver of mice quantified by qRT-PCR. (D) ALT and AST activity in serum of mice after 8 weeks of NASH or normal diet. (E) Frequency of NK cells and level of activating receptor NKG2D on NK cells in the liver of mice after 8 weeks of NASH diet. (F) Frequency of IFN-γ producing cells among total NK cells isolated from the liver of mice, and cytotoxicity of isolated liver NK cells against HSCs. Each data point represents a single mouse. Data are presented as mean ± SEM. Unpaired t-test was used to compare two groups. *p<0.05; NS, not significant.

References

    1. Koyama Y, Brenner DA. Liver inflammation and fibrosis. J Clin Invest 2017;127:55–64. - PMC - PubMed
    1. Schwabe RF, Tabas I, Pajvani UB. Mechanisms of Fibrosis Development in Nonalcoholic Steatohepatitis. Gastroenterology 2020;158:1913–1928. - PMC - PubMed
    1. Ekstedt M, Hagstrom H, Nasr P, Fredrikson M, Stal P, Kechagias S, et al. Fibrosis stage is the strongest predictor for disease-specific mortality in NAFLD after up to 33 years of follow-up. Hepatology 2015;61:1547–1554. - PubMed
    1. Sepanlou SG, Safiri S, Bisignano C, Ikuta KS, Merat S, Saberifiroozi M, et al. The global, regional, and national burden of cirrhosis by cause in 195 countries and territories, 1990–2017: a systematic analysis for the Global Burden of Disease Study 2017. The Lancet Gastroenterology & Hepatology 2020;5:245–266. - PMC - PubMed
    1. Friedman SL. Hepatic stellate cells: protean, multifunctional, and enigmatic cells of the liver. Physiol Rev 2008;88:125–172. - PMC - PubMed

Publication types