. 2023 Nov 2;146(11):4495-4507.
doi: 10.1093/brain/awad213.

CSF proteomics in autosomal dominant Alzheimer's disease highlights parallels with sporadic disease

Affiliations

CSF proteomics in autosomal dominant Alzheimer's disease highlights parallels with sporadic disease

Emma L van der Ende et al. Brain. .

Abstract

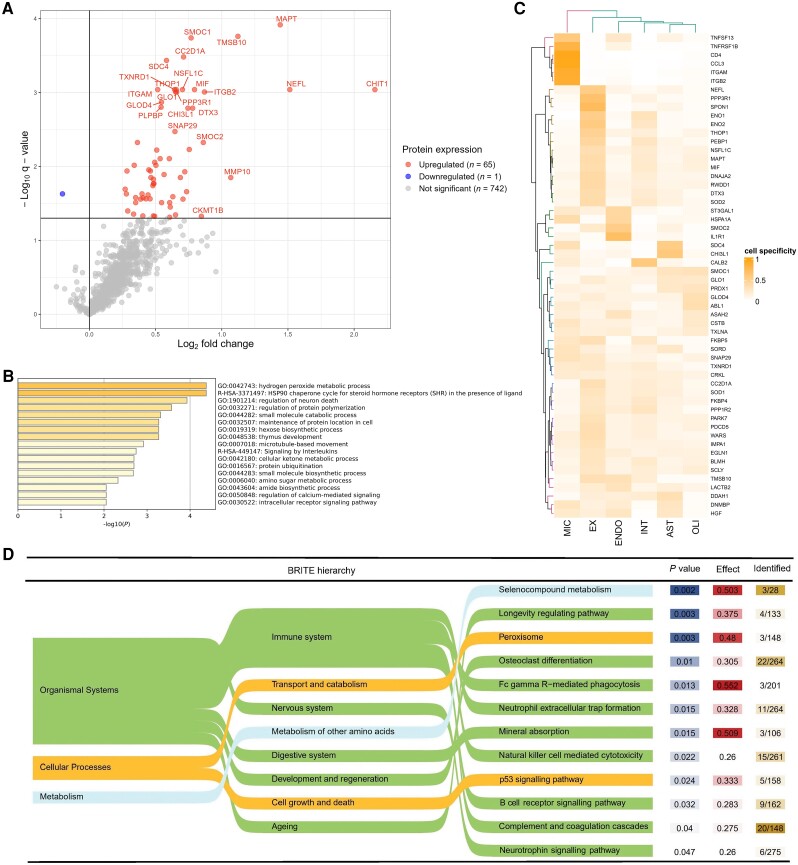
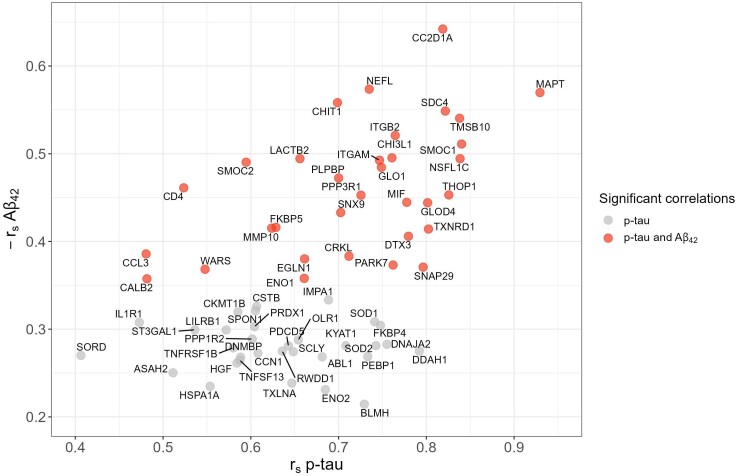
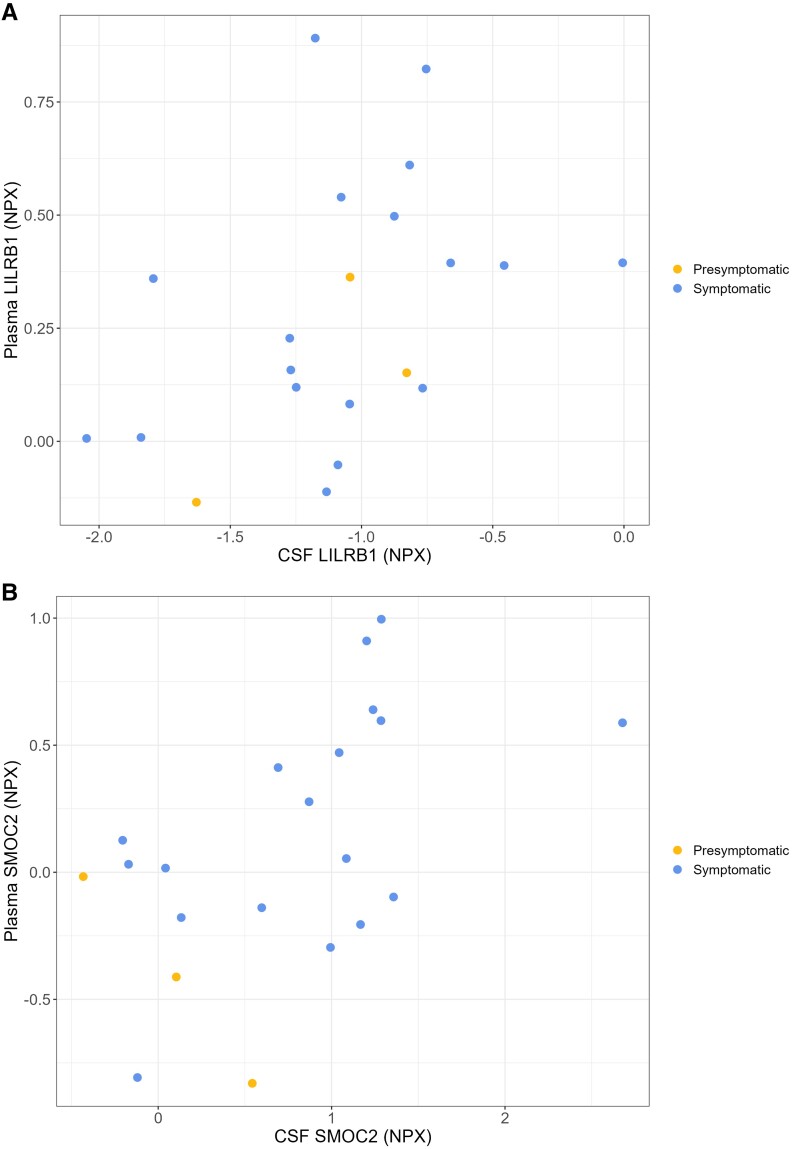
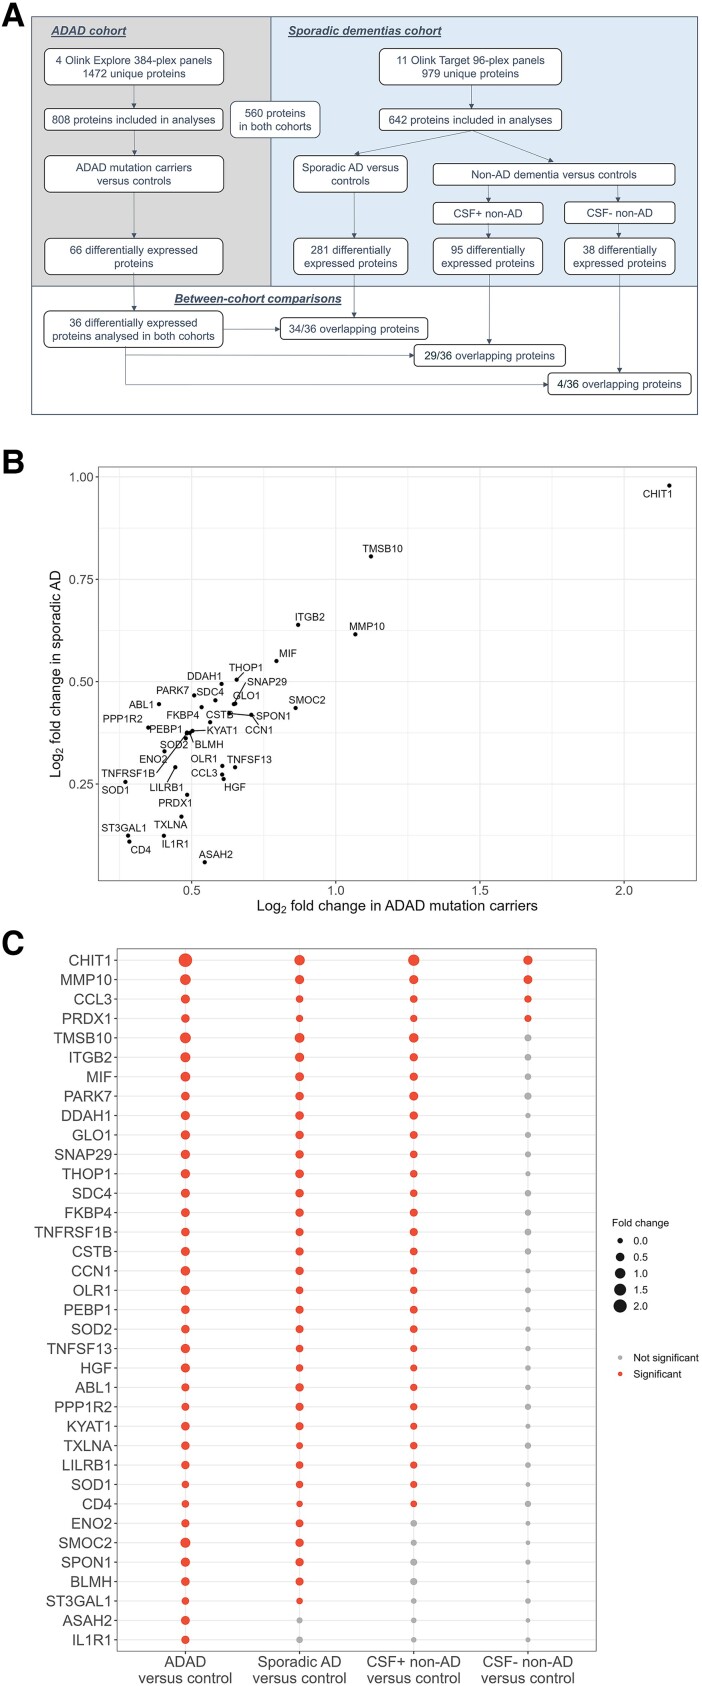
Autosomal dominant Alzheimer's disease (ADAD) offers a unique opportunity to study pathophysiological changes in a relatively young population with few comorbidities. A comprehensive investigation of proteome changes occurring in ADAD could provide valuable insights into AD-related biological mechanisms and uncover novel biomarkers and therapeutic targets. Furthermore, ADAD might serve as a model for sporadic AD, but in-depth proteome comparisons are lacking. We aimed to identify dysregulated CSF proteins in ADAD and determine the degree of overlap with sporadic AD. We measured 1472 proteins in CSF of PSEN1 or APP mutation carriers (n = 22) and age- and sex-matched controls (n = 20) from the Amsterdam Dementia Cohort using proximity extension-based immunoassays (PEA). We compared protein abundance between groups with two-sided t-tests and identified enriched biological pathways. Using the same protein panels in paired plasma samples, we investigated correlations between CSF proteins and their plasma counterparts. Finally, we compared our results with recently published PEA data from an international cohort of sporadic AD (n = 230) and non-AD dementias (n = 301). All statistical analyses were false discovery rate-corrected. We detected 66 differentially abundant CSF proteins (65 increased, 1 decreased) in ADAD compared to controls (q < 0.05). The most strongly upregulated proteins (fold change >1.8) were related to immunity (CHIT1, ITGB2, SMOC2), cytoskeletal structure (MAPT, NEFL) and tissue remodelling (TMSB10, MMP-10). Significant CSF-plasma correlations were found for the upregulated proteins SMOC2 and LILR1B. Of the 66 differentially expressed proteins, 36 had been measured previously in the sporadic dementias cohort, 34 of which (94%) were also significantly upregulated in sporadic AD, with a strong correlation between the fold changes of these proteins in both cohorts (rs = 0.730, P < 0.001). Twenty-nine of the 36 proteins (81%) were also upregulated among non-AD patients with suspected AD co-pathology. This CSF proteomics study demonstrates substantial biochemical similarities between ADAD and sporadic AD, suggesting involvement of the same biological processes. Besides known AD-related proteins, we identified several relatively novel proteins, such as TMSB10, MMP-10 and SMOC2, which have potential as novel biomarkers. With shared pathophysiological CSF changes, ADAD study findings might be translatable to sporadic AD, which could greatly expedite therapy development.

Keywords: dementia; familial; genetic; olink; proteome.


Conflict of interest statement

A.W.L. has performed contract research with Axovant, EIP Pharma and Combinostics. All funding is paid to her institution. W.M.F. has performed contract research for Biogen MA Inc. and Boehringer Ingelheim, and has been an invited speaker at Boehringer Ingelheim, Biogen MA Inc, Danone, Eisai, WebMD Neurology (Medscape), NovoNordisk, Springer Healthcare and the European Brain Council. W.M.F. is consultant to Oxford Health Policy Forum CIC, Roche and Biogen MA Inc. She participated in the advisory boards of Biogen MA Inc., Roche and Eli Lilly. All funding is paid to her institution. W.M.F. is a member of the steering committee of PAVE and Think Brain Health. W.M.F. was associate editor of Alzheimer, Research & Therapy in 2020/2021 and is an associate editor at Brain. C.E.T. has a collaboration contract with ADx Neurosciences, Quanterix and Eli Lilly and performed contract research or received grants from AC-Immune, Axon Neurosciences, Bioconnect, Bioorchestra, Brainstorm Therapeutics, Celgene, EIP Pharma, Eisai, Fujirebio, Grifols, Instant Nano Biosensors, Merck, Novo Nordisk, PeopleBio, Roche, Siemens, Toyama and Vivoryon. She serves on the editorial boards of Medidact Neurologi, Springer, Alzheimer’s Research & Therapy and Neurology: Neuroimmunology & Neuroinflammation. She had speaker contracts for Roche, Grifols and Novo Nordisk. L.V. received a grant for the CORAL consortium by Olink. The remaining authors report no competing interests.

Figures

Figure 1
Figure 1
Differential protein abundance and associated biological pathways in ADAD mutation carriers. (A) Differential protein abundance in ADAD mutation carriers versus controls. The log2 fold change, which is equivalent to the difference in log2-transformed normalized protein expression (NPX) levels, is plotted against the –log10-transformed q-value. The horizontal line indicates the statistical significance threshold, set at q < 0.05. Significantly dysregulated proteins are shown in red (upregulated) or blue (downregulated). The top 20 proteins with the smallest q-value and the top 10 proteins with the largest fold change are labelled. (B) Enriched biological pathways among ADAD mutation carriers. Functional enrichment was performed using Metascape, selecting Gene Ontology Biological Processes and Reactome as ontology sources. All analysed proteins were included as the enrichment background (n = 808). Terms with a P-value <0.01, a minimum count of three and an enrichment factor >1.5 (i.e. the ratio between observed counts and counts expected by chance) were collected and grouped into clusters based on their membership similarities. P-values were calculated based on the accumulative hypergeometric distribution. Kappa scores are used as the similarity metric when performing hierarchical clustering on the enriched terms, and subtrees with a similarity of >0.3 are considered a cluster. The most statistically significant term is chosen to represent the cluster. Stronger terms indicate more significant enrichment. (C) Cell-type specificity of dysregulation proteins. In this heat map, the dysregulated CSF proteins are clustered based on the proportion of cell-type expression. The columns list the cell types: microglia (MIC), excitatory neuron (EX), endothelial cells (ENDO), interneurons (INT), astrocytes (AST) or oligodendrocytes (OLI). (D) Enriched KEGG pathways according the BRITE hierarchy, with increasing granularity from left to right. For the analyses, the measured proteins from the background. A threshold was set at a minimum count of three proteins measured and P < 0.05. The enrichment is presented by the median beta estimate of up- or downregulation for the pathway, the P-value and the number of proteins detected with the current proteomics analyses relative to all proteins in the pathway.
Figure 2
Figure 2
Correlations between differentially abundant CSF proteins and core CSF AD biomarkers. The correlation coefficient with Aβ42 and p-tau was determined for each protein using Spearman’s rho and considered significant at q < 0.05. All proteins shown (n = 65) correlated significantly with p-tau; those shown in red also correlated with Aβ42. For visualization purposes, correlation coefficients with Aβ42 are inverted (i.e. −rs42). One protein, IL-17A, was negatively correlated with p-tau (rs = −0.38; q = 0.015) and positively correlated with Aβ42 (rs = 0.11; q = 0.48) and is not shown here.
Figure 3
Figure 3
Correlations between CSF and plasma (A) LILRB1 and (B) SMOC2 among ADAD mutation carriers. CSF and plasma protein abundance are expressed on a log2 scale as normalized protein expression (NPX). Correlation coefficients and P-values are derived from Spearman’s rho. Blue and yellow symbols represent symptomatic (n = 18) and presymptomatic mutation carriers (n = 4), respectively.
Figure 4
Figure 4
Comparisons of differentially abundant CSF proteins in ADAD with sporadic dementias. (A) Flow chart showing design of between-cohort comparisons. In total, 560 proteins were measured in both cohorts and included in the comparisons, including 36 of the 66 differentially regulated proteins among ADAD mutation carriers. CSF+ non-AD and CSF− non-AD indicate non-AD dementia patients with a positive or negative AD biomarker profile, respectively. (B) Scatter plot showing log2-fold changes in ADAD mutation carriers and sporadic AD patients versus controls for the proteins (n = 34) which were significantly upregulated in both cohorts. (C) Bubble chart displaying overlap of differentially abundant proteins in the various comparisons. Red circles indicate significantly dysregulated proteins; the circle size is proportional to the fold change. Of the 36 proteins upregulated in ADAD and included in the comparison study, 34 were also upregulated in sporadic AD compared to controls; 29 proteins were upregulated in both sporadic AD and CSF+ non-AD dementia, whereas just four were also upregulated among CSF− non-AD dementia. Two proteins were uniquely dysregulated in ADAD. ADAD = autosomal dominant Alzheimer’s disease.

References

    1. Bateman RJ, Aisen PS, De Strooper B, et al. Autosomal-dominant Alzheimer’s disease: a review and proposal for the prevention of Alzheimer’s disease. Alzheimers Res Ther. 2011;3:1. - PMC - PubMed
    1. Bateman RJ, Xiong C, Benzinger TL, et al. Clinical and biomarker changes in dominantly inherited Alzheimer’s disease. N Engl J Med. 2012;367:795–804. - PMC - PubMed
    1. Schindler SE, Fagan AM. Autosomal dominant Alzheimer disease: a unique resource to study CSF biomarker changes in preclinical AD. Front Neurol. 2015;6:142. - PMC - PubMed
    1. Lippa CF, Saunders AM, Smith TW, et al. Familial and sporadic Alzheimer’s disease: neuropathology cannot exclude a final common pathway. Neurology. 1996;46:406–412. - PubMed
    1. Morris JC, Weiner M, Xiong C, et al. Autosomal dominant and sporadic late onset Alzheimer’s disease share a common in vivo pathophysiology. Brain. 2022;145:3594–3607. - PMC - PubMed

Publication types