. 2023 Jun 22;14(1):3710.
doi: 10.1038/s41467-023-39277-9.

Tetraspanin-8 sequesters syntaxin-2 to control biphasic release propensity of mucin granules

Affiliations

Tetraspanin-8 sequesters syntaxin-2 to control biphasic release propensity of mucin granules

José Wojnacki et al. Nat Commun. .

Abstract

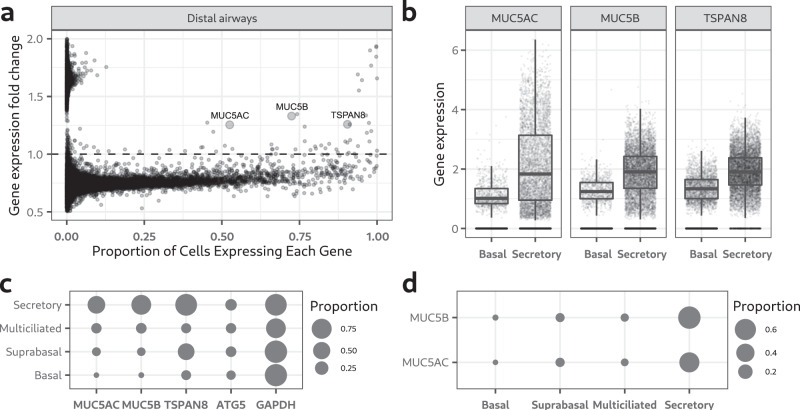
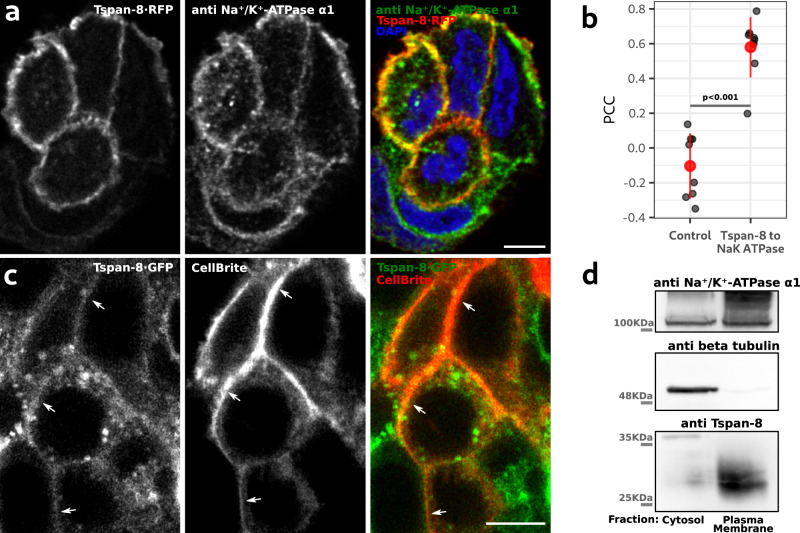
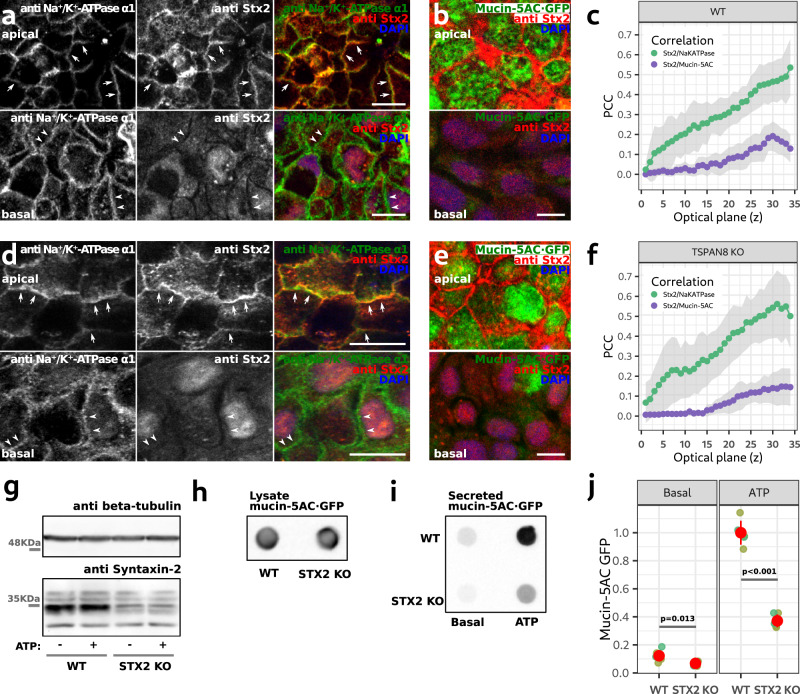
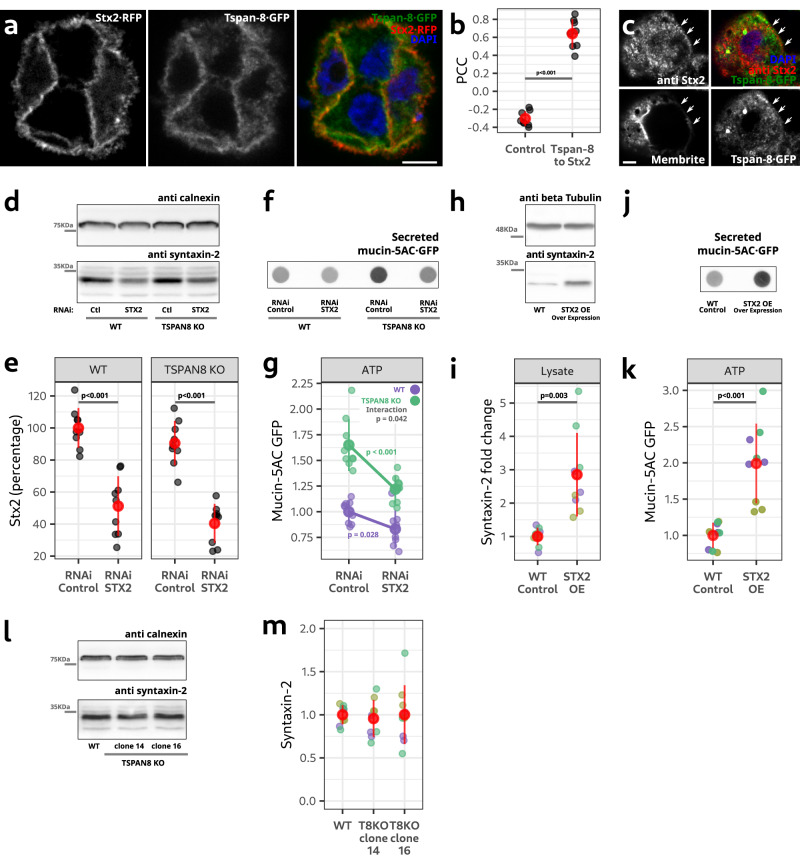
Agonist-mediated stimulated pathway of mucin and insulin release are biphasic in which rapid fusion of pre-docked granules is followed by slow docking and fusion of granules from the reserve pool. Here, based on a cell-culture system, we show that plasma membrane-located tetraspanin-8 sequesters syntaxin-2 to control mucin release. Tetraspanin-8 affects fusion of granules during the second phase of stimulated mucin release. The tetraspanin-8/syntaxin-2 complex does not contain VAMP-8, which functions with syntaxin-2 to mediate granule fusion. We suggest that by sequestering syntaxin-2, tetraspanin-8 prevents docking of granules from the reserve pool. In the absence of tetraspanin-8, more syntaxin-2 is available for docking and fusion of granules and thus doubles the quantities of mucins secreted. This principle also applies to insulin release and we suggest a cell type specific Tetraspanin/Syntaxin combination is a general mechanism regulating the fusion of dense core granules.


Conflict of interest statement

The authors declare no competing interests.

Figures

Fig. 1
Fig. 1. Tetraspanin-8 is upregulated in mucin-secreting cells from the healthy human airways.
a Dot plot showing fold-change in gene expression between basal and mucin-secreting cells in the y-axis and the proportion of mucin-secreting cells expressing each gene in the x-axis. Each dot represents one gene of the distal airways. 18,417 genes were analyzed. Larger dots represent MUC5AC, MUC5B and TSPAN8 genes. Dots are plotted with a 50% transparency value for better visibility in areas of the graph with high dots density. b Box and dot plots of the expression levels of MUC5AC, MUC5B and TSPAN8. Cells from the nasal, proximal, intermediate and distal regions of the airways were pooled together. Each dot represents gene expression in a single cell. 41,850 cells were analyzed. Cells in which no expression was detected are lined at the bottom of the y-axis. The boxes of the box plots were calculated excluding cells with no detectable expression. The lower and upper hinges of the box plots correspond to the first and third quartiles respectively (the 25th and 75th percentiles). The upper whisker extends from the hinge to the largest value no further than 1.5 * IQR from the hinge (where IQR is the interquartile range, or distance between the first and third quartiles). The lower whisker extends from the hinge to the smallest value at most 1.5 * IQR of the hinge. A one-way ANOVA comparing gene expression between basal and secretory cells was done independently for each gene. In the 3 statistical tests the p value was lower than 0.001. c Plot of the proportion of cells expressing MUC5AC, MUC5B, TSPAN8, ATG5 and GAPDH. The area of the dot represents the proportion of cells expressing each gene according to the scale shown. d Mucins and TSPAN8 co-expression plot. The proportion of cells co-expressing TSPAN8/MUC5AC and TSPAN8/MUC5B were calculated for secretory, multi ciliated, suprabasal and basal cells. The area of the dot represents the proportion of gene co-expression according to the scale.
Fig. 2
Fig. 2. TSPAN8 KO increases mucin secretion.
a Representative dot blot showing mucin-5AC·GFP secreted by WT and TSPAN8 KO cell lines. b Quantification of the amount of mucin-5AC·GFP in secreted fractions of WT and TSPAN8 KO cell lines. Each dot represents the signal from one secretion assay. Grouped in different colors are secretion assays that were processed in parallel. n = 9. Red dots represent the mean +/− the standard deviation. Statistical analysis was performed independently for basal and ATP-stimulated conditions. The p values of planned orthogonal contrasts are shown. c Lysates of WT and TSPAN8 KO cells of the secretion assay shown in a were processed for western blot analysis. d Representative dot blot of the total mucin-5AC·GFP in unstimulated WT and TSPAN8 KO cell lines. e Quantification of the amount of mucin-5AC·GFP in the cell lysates of WT and TSPAN8 KO cells. Each dot represents the signal from an independent sample. Grouped in different colors are samples that were processed in parallel. n = 9. Red dots represent the mean +/− the standard deviation. The p values of planned orthogonal contrasts are shown. f Lysates of WT and TSPAN8 KO cells of the samples shown in d were processed for western blot analysis. g Quantification of secreted mucin granules in WT and TSPAN8 KO cells during ATP stimulation. Each dot represents the average cumulative percentage of secreted granules. Values are expressed as proportional to time 0. The gray shadow represents the mean +/− the standard deviation. h Frames showing the lateral projection of a time-lapse of WT cells during ATP stimulation. Time is relative to the moment of ATP addition. Signal is from mucin5AC·GFP fluorescent emission and its intensity was color-coded in a pseudo-color look up table. Arrows point to mucin granules release. Arrowheads point to mucin granules inside cells before ATP stimulation. i Same as in h, but for TSPAN8 KO cells. Source data for a to g are provided as a Source Data file.
Fig. 3
Fig. 3. Tetraspanin 8 is localized at the plasma membrane of mucin-secreting cells.
a Optical plane of a representative confocal image of mucin-secreting cells transfected with Tspan-8·RFP and immunolabelled for the Na+/K+-ATPase α1. Right image shows the merge of the two. Scale bar is 5 µm. b Quantification of the Pearson Correlation Coefficient (PCC) between Tspan-8·RFP and Na+/K+-ATPase α1. As control, Na+/K+-ATPase α1 images were rotated 90° right and the PCC was calculated. Each dot represents the PCC of one image with at least three cells. n = 9. The red dot is the mean value of the gray dots +/− the standard deviation. One-way ANOVA test p < 0.001. c Optical plane from a confocal image of live mucin-secreting cells expressing Tspan-8·GFP at endogenous levels. To visualize the plasma membrane, cells were incubated with the lipophilic membrane marker CellBrite®. Right image shows the merge of the two. Arrows point to the plasma membrane. Scale bar is 5 µm. Five images from two independent cell cultures showed similar results. d WT HT29-N2 cell lines were processed to obtain plasma membrane-enriched fractions. Purified samples were analyzed by western blot. As controls, top and middle panels show immunoblotting against Na+/K+-ATPase α1 and beta tubulin respectively. One of three independent experiment is shown. All replicates showed similar results. Source data for b and d are provided as a Source Data file.
Fig. 4
Fig. 4. Tspan-8 binds with syntaxins 2 and 3.
a Tspan-8·GFP immunoprecipitation and western blot analysis. Top panels show immunoblotting against GFP to confirm immunoprecipitation. Over-exposed membranes for better visualization of the co-precipitate are shown. RFP immunoprecipitation was used as control condition. b GFP·Stx2 immunoprecipitation and western blot analysis. Untransfected cells and RFP immunoprecipitation were used as control conditions. c Tspan-8·GFP immunoprecipitation and western blot analysis. WT HT29-N2 cells were used as a control condition. d Lysates of HT29-N2 cells genetically modified to express Tspan-8·GFP were processed for VAMP-8 immunoprecipitation and western blot analysis. Uncoated beads were used as control. e, f Tspan-8·GFP immunoprecipitation and western blot analysis. Top panels show immunoblotting against Munc18-1 (e) and Munc18-2 (f). No transfection and Tspan-8·RFP transfection were used as control conditions. g Representative images of the FRET acceptor before and after photobleaching. Arrows indicate regions of the plasma membrane. Scale bar is 5 µm. h Quantification of the fluorescence intensity of the acceptor pre and post photobleaching. Same-images before and after photobleaching are linked with a straight line. Each dot represents the signal intensity of one image. n = 22. Images come from three independent cell cultures. Red dots represent the mean +/− the standard deviation. One-way ANOVA test: p < 0.001. i Representative images of the FRET donor before and after photobleaching of the FRET acceptor. Arrows indicate regions of the plasma membrane. Scale bar is 5 µm. j FRET map calculated with images shown in i. Arrows indicate regions of the plasma membrane with high FRET. FRET efficiency was color-coded with a pseudo-color look up table shown in the image. Scale bar is 5 µm. k Quantification of the FRET efficiency between NeonGreen·Stx2 and Tspan-8·mScarlet. Each dot represents the FRET efficiency of one image. Control conditions are images for which no bleaching step was performed. 13 control and 22 bleached images were analyzed. Red dots represent the mean +/− the standard deviation. One-way ANOVA test: p < 0.001. Source data for a to k are provided as a Source Data file.
Fig. 5
Fig. 5. Syntaxin-2 is necessary for mucin-5AC secretion.
a Optical planes of a representative confocal image of a HT29-N2 WT/Caco2 co-culture immunolabelled for the Na+/K+-ATPase α1 and Stx2. Arrows point to regions of the apical plasma membrane where Na+/K+-ATPase α1 and Stx2 co-localize. Arrowheads point to the basal plasma membrane. Scale bar is 10 µm. b Optical plane of a representative confocal image of a HT29 WT/Caco2 co-culture expressing mucin-5AC·GFP and immunolabelled for Stx2. Scale bar is 10 µm. c Quantification of the PCC between Na+/K+-ATPase α1 and Stx2 in WT cells. Green dots and lines show the mean PCC quantification between the Na+/K+-ATPase α1 and Stx2 signals in each optical plane. Purple dots and lines show the mean PCC between Stx2 and mucin-5AC·GFP. The gray areas show the mean PCC +/− the standard deviation. d. Same as in A for TSPAN8 KO cells. e Same as in B for TSPAN8 KO cells. f Same as in C for TSPAN8 KO cells. g Representative western blot of the total amount of beta tubulin and Stx2 in WT and STX2 KO cells corresponding to the mucin secretion assay shown in i. h Representative dot blot showing the total mucin-5AC·GFP content in differentiated WT and STX2 KO cell lines. i Representative dot blot of a secretion assay of WT and STX2 KO cells. j Quantification of secretion assays of WT and STX2 KO cell lines. Each dot represents the mucin-5AC·GFP signal from one secretion assay. Grouped in different colors are secretion assays that were processed in parallel. n = 9. Red dots represent the mean +/− the standard deviation. Values are expressed as relative to the average mucin-5AC·GFP signal in ATP-stimulated WT cells. Statistical analysis was performed independently for basal and ATP-stimulated conditions. One-way ANOVA analysis: basal p = 0.013; ATP p < 0.001. Source data for c and f to h are provided as a Source Data file.
Fig. 6
Fig. 6. Syntaxin-2 and Tspan-8 are in the same pathway of regulated mucin secretion.
a Cells co-transfected with Stx2·RFP and Tspan-8·GFP. Scale bar is 10 µm. b Quantification of the PCC between Stx2·RFP and Tspan-8·GFP. Each gray dot represents the PCC of one image. n = 8. One-way ANOVA p < 0.001. c Cells immunolabeled with an anti Stx2 antibody, Tspan-8·GFP and CellBrite®. Arrows point to the plasma membrane. Scale bar is 5 µm. One image of three independent cultures is shown with similar results in all images. d Western blot of Stx2 in WT and TSPAN8 KO cells treated with RNAi control or against STX2. e Quantification of the amount of Stx2 in WT and TSPAN8 KO cells treated with RNAi control or against STX2. Each dot represents Stx2 signal from an independent sample. n = 9. Two-way ANOVA test: genotype p = 0.146; RNAi treatment p value < 0.001. TukeyHSD p values shown. f Dot blot showing mucin-5AC·GFP secretion from WT and TSPAN8 KO cells treated with RNAi control or against STX2. g Quantification of mucin-5AC·GFP in WT and TSPAN8 KO cells treated with RNAi control or against STX2. Each dot represents the signal from 1 secretion assay. n = 9. Two-way ANOVA test: genotype: p < 0.001; RNAi treatment p < 0.001; interaction p = 0.042. p values of a one-way ANOVA for each genotype are shown. h. Western blot of Stx2 in WT and STX2-over expressing cells. i Quantification of Stx2 in WT and STX2-over expressing cells. Each dot represents Stx2 from an independent sample. n = 9. One-way ANOVA p = 0.003. j Dot blot of a secretion assay showing secreted mucin-5AC·GFP of ATP-stimulated WT and STX2-over expressing cells. k Quantification of the secretion assays of WT and STX2-over expressing cells. Each dot represents the mucin-5AC·GFP from one assay. n = 9. One-way ANOVA p < 0.001. l Western blot of Stx2 in WT and TSPAN8 KO cells. m Quantification of the amount of Stx2 in WT and TSPAN8 KO cells. Each dot represents the Stx2 signal from an independent sample. n = 9. Source data for b and d to m are provided as a Source Data file.
Fig. 7
Fig. 7. Tspan-8 d234-237 is arrested in the ER, sequesters Stx2 and inhibits mucin5-AC·GFP secretion.
a Optical plane from a confocal image of live cells expressing Tspan-8·GFP and labelled with CellBrite® to visualize the plasma membrane. Top row are cells expressing WT Tspan-8 (clone 3) and lower row are cells expressing the truncated version of Tspan-8 d234-237 (clone 8). Arrows point to the plasma membrane. Scale bar is 5 µm. b Quantification of the PCC between Cellbrite® and Tspan-8·GFP. Each gray dot represents the PCC of 1 image with at least 3 cells. n = 10. The red dot is the mean value of the gray dots +/− the standard deviation. The p value was calculated with an ANOVA test. c Optical plane from live cells expressing Tspan-8·GFP at endogenous levels and transiently transfected with Stx2·RFP. Top row are cells expressing WT Tspan-8·GFP (clone 3) and lower row are cells expressing the truncated version of Tspan-8 d234-237 (clone 8). Images of clone 3 (n = 8) and clone 8 (n = 11) were taken from two independent cell cultures. All images showed similar results. Arrows point to the plasma membrane. Arrowheads point to Stx2·RFP trapped in the ER. Scale bar is 5 µm. d Lysates of HT29-N2 cells genetically modified by CRISPR/Cas9 to express WT (clone 3) or a truncated version (clone 8) of Tspan-8·GFP were processed for immunoprecipitation of GFP and western blot analysis. WT HT29-N2 cells were used as a control condition. One of two independent experiment is shown. Both experiments showed similar results. e Representative dot blot showing mucin-5AC secreted by cells expressing WT or a truncated version of Tspan-8. f Quantification of the amount of secreted mucin-5AC in cells expressing the WT or the truncated version of Tspan-8. Each dot represents the signal from one secretion assay. Grouped in different colors are secretion assays that were processed in parallel. n = 12. Red dots represent the mean +/− the standard deviation. One-way ANOVA test: p < 0.001. Source data for bf are provided as a Source Data file.
Fig. 8
Fig. 8. Tspan-8 over expression inhibits insulin secretion.
a Western blot of the total amount of Tspan-8 (~25 KDa) in INS-1 cells. OE means over expression and Ctl refers to WT INS-1 cells. One image of four independent experiments is shown. Results are similar in all replicates. Not shown replicates are provided in the source data file. b Western blot of the total amount of human Tspan-8·mScarlet (~51 KDa) in INS-1 cells. Membranes were immunoblotted with anti calnexin and anti RFP antibodies, respectively and developed by ECL. OE means over expression and Ctl refers to WT INS-1 cells. One image of four independent experiments is shown. Results are similar in all replicates. Not shown replicates are provided in the source data file. c Optical plane from a confocal image of live INS-1 cells over expressing human Tspan-8·mScarlet. Arrows point to the plasma membrane. Arrowheads point to intracellular human Tspan-8·mScarlet. Scale bar is 5 µm. One of six independent images is shown. Images were taken from two independent cell cultures. All images showed similar results. d Lysates of WT or hTspan-8·mScarlet-over expressing INS-1 cells were processed for immunoprecipitation of RFP and western blot analysis. OE means over expression and Ctl refers to WT INS-1 cells. One image of two independent experiments is shown. Results are similar in all replicates. e Quantification of glucose-stimulated insulin secretion in WT and hTspan-8·mScarlet-over expressing INS-1 cells. Insulin in the culture media was measured by ELISA. Values are expressed as relative to the control condition. Grouped in different colors are secretion assays that were processed in parallel. Red dots represent the mean +/− the standard deviation. Total number of replicates are 15. The p value (<0.001) of a one-way ANOVA analysis is shown in the plot. Source data for a, b, d and e are provided as a Source Data file.
Fig. 9
Fig. 9. Model for function of Tspan-8 to regulate biphasic release of granules.
1. Pre-docked granules fuse upon exposure of cells to external agonist like ATP. 2. Tspan-8 at the plasma membrane binds Stx2 preventing it from docking granules from the reserve pool during the second phase of stimulated secretion. 2’. Loss of Tspan-8 exposes Stx2 to engage with granules from the reserve pool that fuse to increase the quantity of mucins secreted.

References

    1. Rossi AH, et al. Calcium signaling in human airway goblet cells following purinergic activation. Am. J. Physiol.-Lung Cell. Mol. Physiol. 2007;292:L92–L98. doi: 10.1152/ajplung.00081.2006. - DOI - PubMed
    1. Rorsman P, et al. Regulation of calcium in pancreatic α- and β-cells in health and disease. Cell Calcium. 2012;51:300–308. doi: 10.1016/j.ceca.2011.11.006. - DOI - PMC - PubMed
    1. Cantero-Recasens G, et al. Sodium channel TRPM4 and sodium/calcium exchangers (NCX) cooperate in the control of Ca2+-induced mucin secretion from goblet cells. J. Biol. Chem. 2019;294:816–826. doi: 10.1074/jbc.RA117.000848. - DOI - PMC - PubMed
    1. Jahn R, et al. Molecular machines governing exocytosis of synaptic vesicles. Nature. 2012;490:201–207. doi: 10.1038/nature11320. - DOI - PMC - PubMed
    1. Hovenberg HW, et al. Different mucins are produced by the surface epithelium and the submucosa in human trachea: identification of MUC5AC as a major mucin from the goblet cells. Biochem. J. 1996;318:319–324. doi: 10.1042/bj3180319. - DOI - PMC - PubMed

Publication types