. 2023 Jun 22;14(1):3699.
doi: 10.1038/s41467-023-39417-1.

Multiplexed ddPCR-amplicon sequencing reveals isolated Plasmodium falciparum populations amenable to local elimination in Zanzibar, Tanzania

Affiliations

Multiplexed ddPCR-amplicon sequencing reveals isolated Plasmodium falciparum populations amenable to local elimination in Zanzibar, Tanzania

Aurel Holzschuh et al. Nat Commun. .

Abstract

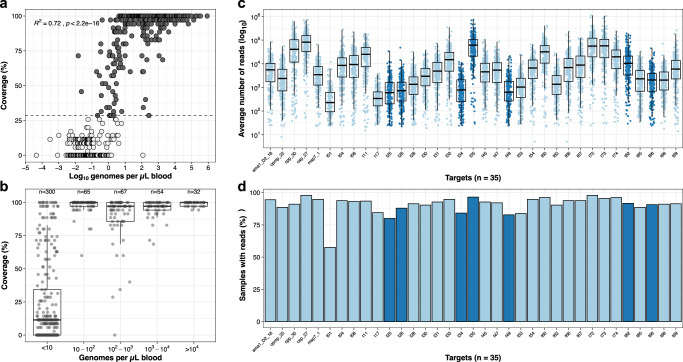
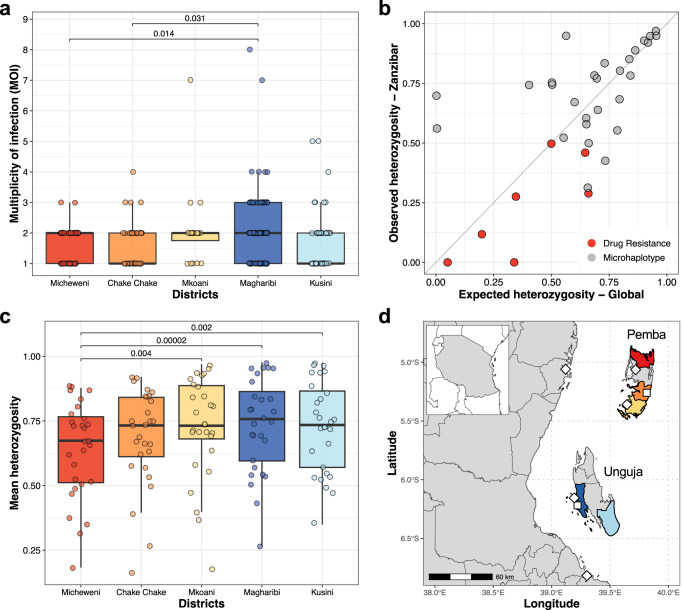
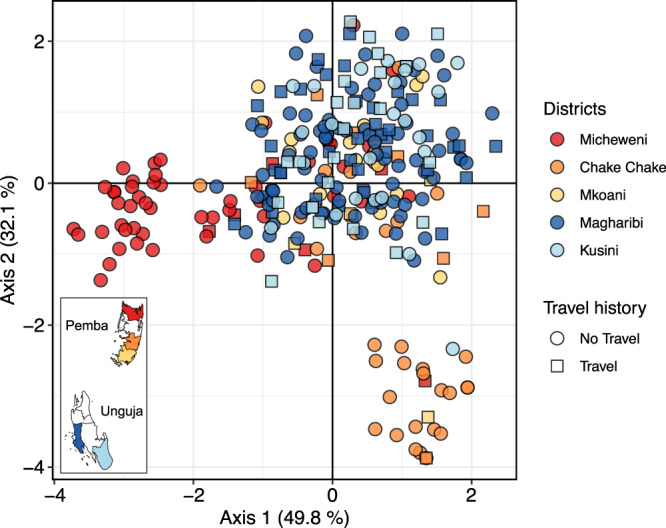
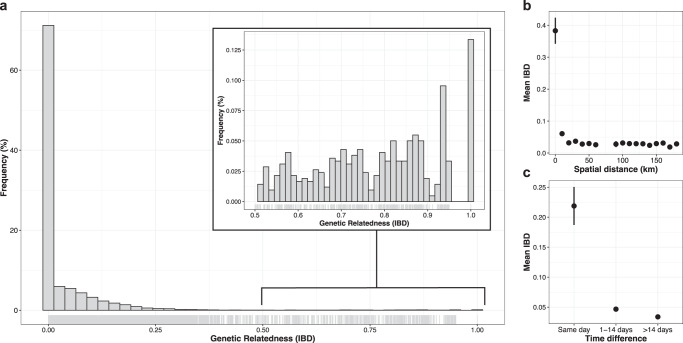
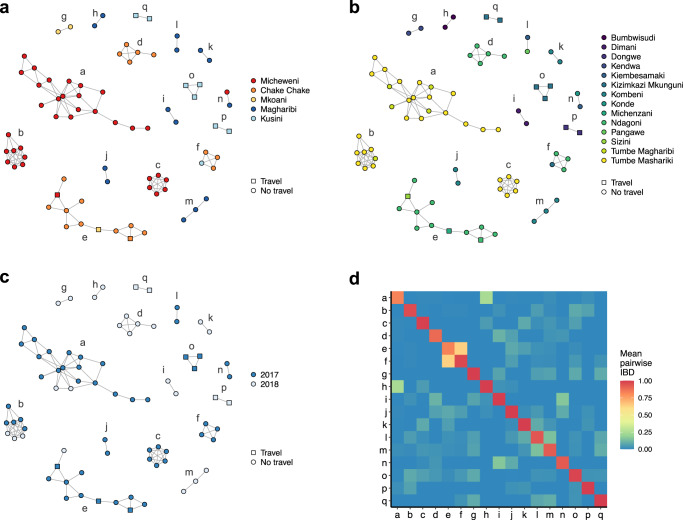
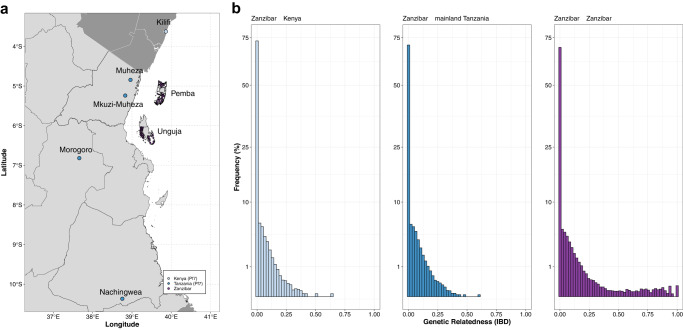
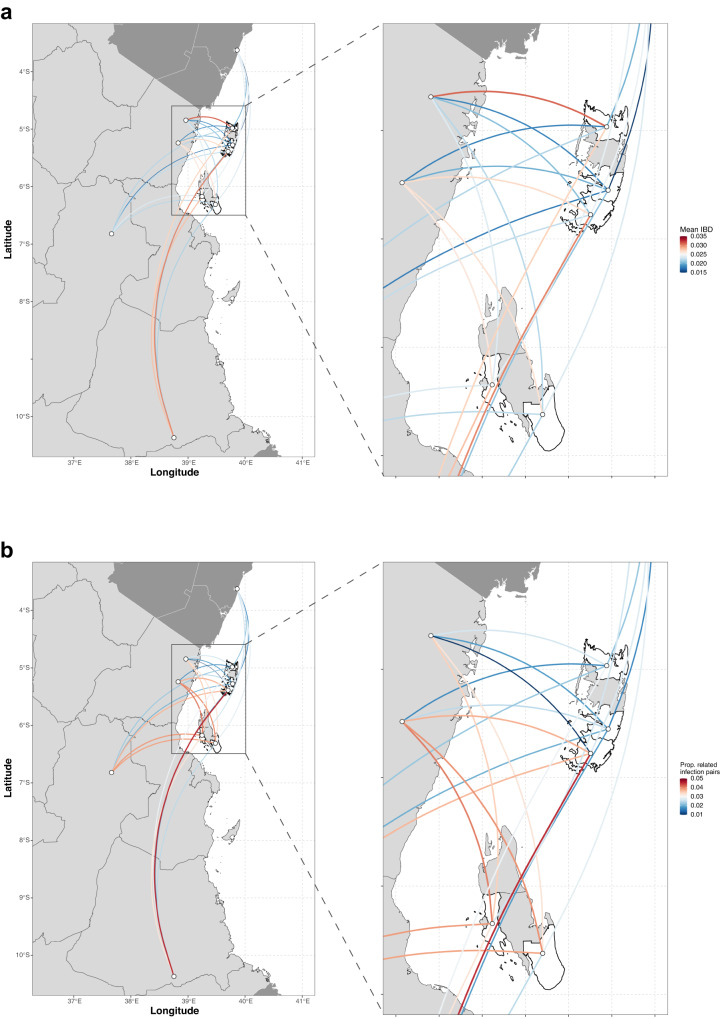
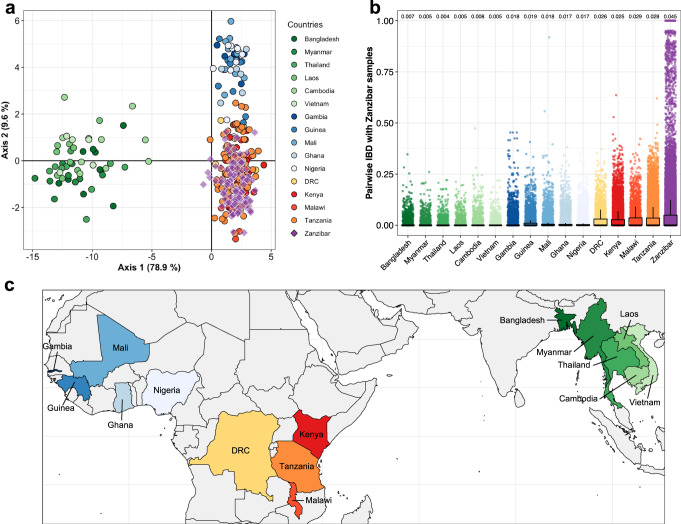
Zanzibar has made significant progress toward malaria elimination, but recent stagnation requires novel approaches. We developed a highly multiplexed droplet digital PCR (ddPCR)-based amplicon sequencing method targeting 35 microhaplotypes and drug-resistance loci, and successfully sequenced 290 samples from five districts covering both main islands. Here, we elucidate fine-scale Plasmodium falciparum population structure and infer relatedness and connectivity of infections using an identity-by-descent (IBD) approach. Despite high genetic diversity, we observe pronounced fine-scale spatial and temporal parasite genetic structure. Clusters of near-clonal infections on Pemba indicate persistent local transmission with limited parasite importation, presenting an opportunity for local elimination efforts. Furthermore, we observe an admixed parasite population on Unguja and detect a substantial fraction (2.9%) of significantly related infection pairs between Zanzibar and the mainland, suggesting recent importation. Our study provides a high-resolution view of parasite genetic structure across the Zanzibar archipelago and provides actionable insights for prioritizing malaria elimination efforts.


Conflict of interest statement

The authors declare no competing interests.

Figures

Fig. 1
Fig. 1. Evenness and coverage of multiplexed amplicon sequencing of microhaplotypes (n = 28) and drug resistance loci (n = 7).
a Coverage of microhaplotype loci and drug resistance targets by parasite density in 518 DBS samples from Zanzibar. 290 samples with data in ≥10 loci (dashed line) were included for further analyses (colored in black). Correlation between sequencing coverage and parasite density was analyzed using linear regression (R2 = 0.72, F(1516) = 1306, P < 2.2e–16); P value is two-sided. b Boxplot summarizing the coverage of microhaplotype loci and drug resistance targets by parasite density in 518 DBS samples from Zanzibar. Coverage was determined based on the number of targets with 10 or more reads (e.g., 100% indicates 35/35 loci with ≥10 reads). Sample sizes for each bin are indicated. The box bounds the IQR divided by the median, and Tukey-style whiskers extend to a maximum of 1.5 ×  IQR beyond the box. c Boxplot showing the average number of reads per target (n = 35) per sample (n = 290). Colored by microhaplotypes (light blue) and drug resistance loci (dark blue). The box bounds the IQR divided by the median, and Tukey-style whiskers extend to a maximum of 1.5 × IQR beyond the box. Note that the y-axis is on a log10-scale. d Number of samples (%) of the 290 samples included with ≥10 reads per marker. Colored by microhaplotypes (light blue) and drug resistance loci (dark blue).
Fig. 2
Fig. 2. Multiplicity of infection and heterozygosity.
a Multiplicity of infection (MOI) of 290 DBS samples across 5 districts. The box bounds the IQR divided by the median, and Tukey-style whiskers extend to a maximum of 1.5 × IQR beyond the box. Differences between districts were examined using a two-sided t test. Bonferroni adjusted P values are indicated for significant pairs only. b Correlation of expected heterozygosity of microhaplotypes and drug resistance loci in the global population and the observed heterozygosity in the Zanzibar samples was analyzed using linear regression (R2 = 0.37, F(1, 33) = 19.78, P = 9.292e–5). c Distribution of expected heterozygosity of the 28 microhaplotypes across 5 districts in Zanzibar. The box bounds the IQR divided by the median, and Tukey-style whiskers extend to a maximum of 1.5 × IQR beyond the box. Differences between districts were examined using a pairwise two-sided t test. Bonferroni adjusted P values are indicated for significant pairs only. d Map of Zanzibar archipelago with the 5 districts included in the study. Inset map shows the United Republic of Tanzania. Airports (squares) and ferry terminals (diamonds) are highlighted.
Fig. 3
Fig. 3. P. falciparum population structure across 5 districts in Zanzibar.
Separation of P. falciparum samples by district using discriminatory analysis of principal components (DAPC). The first 23 components of a principal component analysis (PCA) are shown. Each dot represents a sample colored by its geographic origin based on the 5 districts included in the analysis (inset map). Travel history is indicated by circles (no travel) or squares (travel).
Fig. 4
Fig. 4. Pairwise genetic relatedness and spatiotemporal patterns of IBD.
a Histogram of pairwise IBD between all samples (n = 290 samples; n = 41,905 pairwise comparisons), estimated by Dcifer. Inset shows the heavy tail of the distribution, with some pairs of samples having IBD  ≥  0.9. b Spatial patterns in IBD among all samples (n = 290 samples; n = 41,905 pairwise comparisons). Mean IBD binned by the spatial distance in 10 km intervals. Bin at distance 0 km represents within-household comparisons. Vertical lines indicate 95% confidence intervals. c Temporal patterns in IBD among all samples (n = 290 samples; n = 41,905 pairwise comparisons). Mean IBD of sample pairs collected on the same day, 1–14 days apart, or >14 days apart. Vertical lines indicate 95% confidence intervals.
Fig. 5
Fig. 5. Relatedness network of highly related infection pairs.
Each node identifies a unique infection and edges connecting nodes correspond to IBD ≥ 0.9. Colored according to (a), district; (b), shehia; and (c), year. Travel (square) and no travel (circle) of individuals are indicated. Clusters are labeled with letters. d Heatmap showing mean IBD within and between clusters. Mean IBD between clusters ranges from 0 to 0.635 and within clusters from 0.823 to 1.
Fig. 6
Fig. 6. Pairwise genetic relatedness between isolates from Zanzibar and mainland Tanzania and Kenya.
a Location of samples colored by population: purple, Zanzibar; dark blue, published mainland Tanzania P. falciparum isolates from MalariaGEN (Pf7); light blue, published mainland Kenya P. falciparum isolates from MalariaGEN (Pf7). b Histogram of pairwise IBD. Pairwise IBD between all samples from Zanzibar (n = 290), with mainland Tanzania (n = 80), Kenya (n = 35) and themselves, estimated by dcifer. Note that the y-axis is on square-root scale.
Fig. 7
Fig. 7. Genetic connectivity between the 5 districts in Zanzibar (n = 290) and the 5 sites on mainland Tanzania (n = 80) and Kenya (n = 35).
a Mean IBD is shown for all pairs. b Proportion of related infections is shown for all pairs. Significance between nodes was assessed using one-sided permutation test (100,000 permutations). Note, no connection was deemed statistically significant (P < 0.05) by permutation testing, likely due to small sample size.
Fig. 8
Fig. 8. Genetic differentiation and relatedness of P. falciparum isolates from Zanzibar and global isolates.
a Genetic differentiation between global P. falciparum populations by discriminatory analysis of principal components (DAPC) using 28 microhaplotypes. The first 51 components of a principal component analysis (PCA) are shown. Each point represents a single isolate (n = 374); colors indicate country of origin. Only monoclonal samples were used for this analysis. b Boxplot showing pairwise IBD between samples from Zanzibar (n = 290) and several countries from West Africa, Central Africa, East Africa, and Asia (n = 242). Mean IBD is indicated. The box bounds the IQR divided by the median, and Tukey-style whiskers extend to a maximum of 1.5 × IQR beyond the box. c Countries from which samples originate are colored in the map, for clarity of the geographic regions under consideration. Democratic Republic of the Congo is abbreviated as DRC.

Similar articles

Cited by

References

    1. World Health Organization. WHO Malaria Report 2022 (WHO, 2022).
    1. Stuck L, et al. Malaria infection prevalence and sensitivity of reactive case detection in Zanzibar. Int. J. Infect. Dis. 2020;97:337–346. doi: 10.1016/j.ijid.2020.06.017. - DOI - PMC - PubMed
    1. Björkman A, et al. From high to low malaria transmission in Zanzibar—challenges and opportunities to achieve elimination. BMC Med. 2019;17:14. doi: 10.1186/s12916-018-1243-z. - DOI - PMC - PubMed
    1. van der Horst, T. et al. Operational coverage and timeliness of reactive case detection for malaria elimination in Zanzibar, Tanzania. Am. J. Trop. Med Hyg. 10.4269/ajtmh.19-0505 (2019). - PMC - PubMed
    1. Björkman A, et al. Spatial distribution of falciparum malaria infections in Zanzibar: implications for focal drug administration strategies targeting asymptomatic parasite carriers. Clin. Infect. Dis. 2017;64:1236–1243. doi: 10.1093/cid/cix136. - DOI - PMC - PubMed

Publication types

MeSH terms