Clinical Trial
. 2023 Jun 22;14(1):3698.
doi: 10.1038/s41467-023-39383-8.

Nivolumab plus chemoradiotherapy in locally-advanced cervical cancer: the NICOL phase 1 trial

Affiliations
Clinical Trial

Nivolumab plus chemoradiotherapy in locally-advanced cervical cancer: the NICOL phase 1 trial

Manuel Rodrigues et al. Nat Commun. .

Abstract

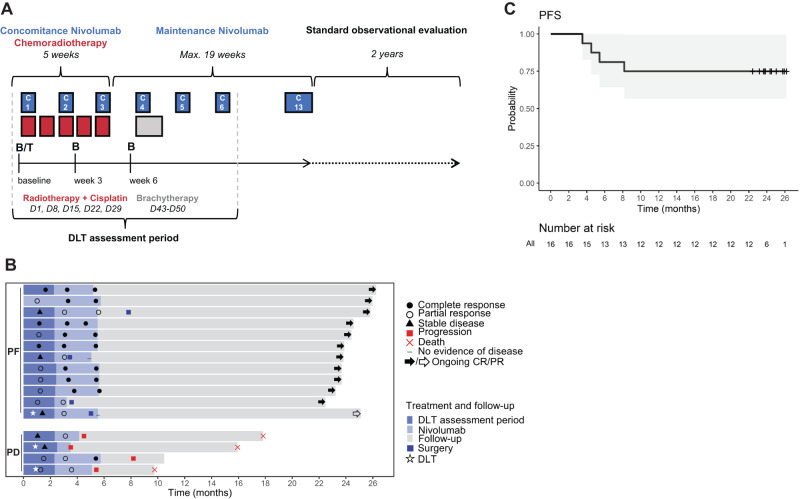
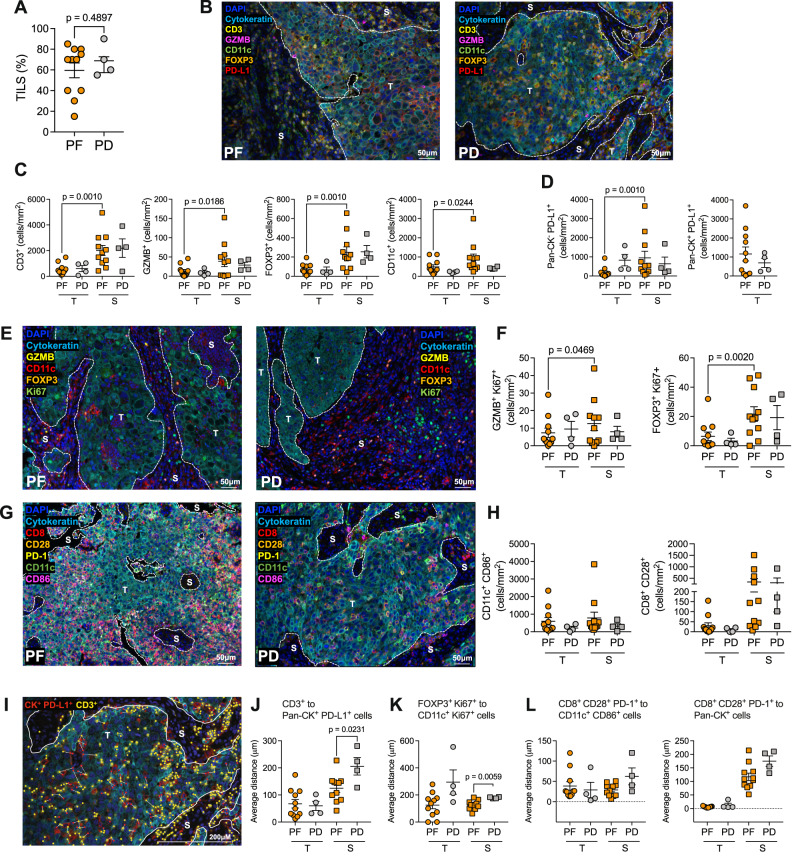
Concurrent chemoradiotherapy (CRT) with blockade of the PD-1 pathway may enhance immune-mediated tumor control through increased phagocytosis, cell death, and antigen presentation. The NiCOL phase 1 trial (NCT03298893) is designed to determine the safety/tolerance profile and the recommended phase-II dose of nivolumab with and following concurrent CRT in 16 women with locally advanced cervical cancer. Secondary endpoints include objective response rate (ORR), progression free survival (PFS), disease free survival, and immune correlates of response. Three patients experience grade 3 dose-limiting toxicities. The pre-specified endpoints are met, and overall response rate is 93.8% [95%CI: 69.8-99.8%] with a 2-year PFS of 75% [95% CI: 56.5-99.5%]. Compared to patients with progressive disease (PD), progression-free (PF) subjects show a brisker stromal immune infiltrate, higher proximity of tumor-infiltrating CD3+ T cells to PD-L1+ tumor cells and of FOXP3+ T cells to proliferating CD11c+ myeloid cells. PF show higher baseline levels of PD-1 and ICOS-L on tumor-infiltrating EMRA CD4+ T cells and tumor-associated macrophages, respectively; PD instead, display enhanced PD-L1 expression on TAMs, higher peripheral frequencies of proliferating Tregs at baseline and higher PD-1 levels at week 6 post-treatment initiation on CD4 and CD8 T cell subsets. Concomitant nivolumab plus definitive CRT is safe and associated with encouraging PFS rates. Further validation in the subset of locally advanced cervical cancer displaying pre-existing, adaptive immune activation is warranted.


Conflict of interest statement

M.R. reports personal fees for serving as an advisor from Merck Sharp & Dohme, AstraZeneca, GlaxoSmithKline, Immunocore; travel support from AstraZeneca; funds to his institution to support a study from Merck Sharp & Dohme. E.R. reports investigator-initiated trial funds (paid to the institution) by AstraZeneca, BMS, and Replimune; serves on the consultancy/advisory board for AstraZeneca, Merck, Roche, Light Chain Biosciences, Pierre Fabre; E.R. declares travel support from BMS, Hoffmann La Roche, AstraZeneca, Merck Sharp & Dohme. G.V. and E.R. received grants from the Fonds Amgen France pour la Science et l’Humain. MR and ER report funding to their institution to support a study from Janssen-Cilag. CaD received grants from AstraZeneca, Janssen, and Astellas. M.K. received funds from Roche. The remaining co-authors declare no competing interests.

Figures

Fig. 1
Fig. 1. Study design, progression-free survival, and treatment response.
A Study design of the NiCOL Trial, C cycle. B blood sampling, T tumor sampling, D day, DLT dose-limiting toxicity. Red squares symbolize weeks of chemoradiotherapy (five daily fractions of 1.8 G, combined with one intravenous infusion of cisplatin 40 mg/m2); the gray square symbolizes intra-cavitary uterovaginal brachytherapy (85 Gy to the high-risk volume in pulsed dose rate); the blue squares symbolize nivolumab intravenous infusion (240 mg every 2 weeks). B Swimmer’s plot sorted by treatment response: Progression-free patients (PF, n = 12) in the upper part, comprise patients with Complete Response (CR, full black arrow and circle, n = 11) and with Partial Response (PR, empty arrow and circle, n = 1); at the bottom, patients with Progression of Disease (PD, n = 4) are highlighted by a red square (all biologically independent samples). A red cross indicates the time of the patient’s death. The dose-limiting toxicity (DLT) window, the length of treatment, the time of surgery, and follow-up (in months) are also shown. A white star indicates a DLT event. C Progression-free survival (PFS).
Fig. 2
Fig. 2. Bulk RNA sequencing and genomic alteration assessment of baseline tumors.
A Volcano plot showing log2-transformed Fold Change (log2FC) in protein-coding genes in patients with progression of disease (PD) versus progression-free ones (PF). While no statistically significant gene was detected, orange and dark gray dots correspond to the most upregulated genes in PF and in PD samples, respectively. B Gene set variation analysis (GSVA) on MSigDB Hallmark gene sets. PF and PD samples are annotated in orange and gray, respectively. C Gene set enrichment analysis (GSEA) showing epithelial-mesenchymal transition (EMT), angiogenesis, KRAS signaling up, interferon-gamma response, and interferon-alpha response Hallmark gene sets from MSigDB that are significantly enriched in the tumors of PF (orange) versus PD (gray) patients (Benjamini–Hochberg adjusted p < 0.05). Fold change expression values and adjusted p values were combined to rank the genes as input for the GSEA which is based on the Kolmogorov–Smirnov test. D Volcano plot highlighting the protein-coding genes with the highest FC for the following signatures: Angiogenesis (in red) and EMT (in green) pathways—enriched in PD; Interferon-alpha (yellow) and interferon-gamma (dark blue) pathways—enriched in PF. None of the highlighted genes was statistically significant. In all panels, n = 11 for PF and n = 4 for PD (biologically independent samples). The complete list of the genes that are enriched in the pathways of the GSEA analysis are provided in Supplementary Data 1.
Fig. 3
Fig. 3. Profiling of intratumoral T and myeloid cells.
A Percentage of TILs, assessed by H&E staining, in PF vs PD. B Representative Multiplex Immunohistochemistry (mIHC) staining of the tumor microenvironment (TME) for CD3+, Granzyme B (GZMB+), FOXP3+, CD11c+, Pan-cytokeratin (Pan-CK) tumor cells and PD-L1+ cells in PF vs PD. C Number of CD3+, GZMB+, FOXP3+, CD11c+ cells/mm2 in the S vs T areas in PF vs PD. D Number of PD-L1+ Pan-CK- cells/mm2 (i.e., non-tumor cells) in the S vs T areas (left), and of PD-L1+ Pan-CK+ cells in the T area in PF vs PD. E Representative mIHC staining of the TME for GZMB+, FOXP3+, CD11c+, Pan-CK+ tumor cells, and Ki67+ cells in PF vs PD. F Number of proliferating (Ki67+) GZMB+ (left) and FOXP3+ (right) cells/mm2 in the S vs T areas, in PF vs PD. G Representative mIHC staining of the TME for CD8+, CD28+, PD-1+, CD11c+, CD86+, and Pan-CK+ tumor cells in PF vs PD. H Number of CD11c+CD86+ double positive antigen-presenting cells/mm2 (APC) (left) and CD8+CD28+ cells/mm2 (right) in the S vs T areas, in PF vs PD. I Representative mIHC staining (from a PD) highlighting CD3+ cells (yellow dots) and PD-L1+ Pan-CK+ tumor cells (red dots). The white lines represent the intercellular distance between each CD3+ and PD-L1+ tumor cell in proximity. J Cumulative data of the proximity of CD3+ cells to PD-L1+ tumor cells in the S and T areas of PF vs PD. K Cumulative data of the proximity of FOXP3+ Ki67+ cells to CD11c+ Ki67+ cells in the S area of PF vs PD. L Cumulative data of the proximity of CD8+ CD28+ cells to CD11c+ CD86+ APC (left) and to Pan-CK+ cells (right) in the S area of PF vs PD. In all panels, n = 11 for PF and n = 4 for PD (biologically independent samples). Panels B, E, G, and I are representative of 15 biologically independent samples. Data were presented as individual values (mean ± SEM). Statistical tests: two-tailed unpaired and paired t-tests (Mann–Whitney and Wilcoxon matched-pairs signed rank test) in all panels. T tumor, S Stroma. Source data are provided as Source Data File.
Fig. 4
Fig. 4. Ex vivo phenotyping of intratumoral T and myeloid cell subsets by flow cytometry.
A Frequency of intratumoral CD3+ T cells gated on CD45+ cells, CD4+ T cells, CD4+ Tconv (CD3+CD4+CD127-/+CD25-), CD4+ Tregs (CD3+CD4+CD127loCD25+/high) and of CD8+ T cells, expressed as a percentage of CD3+ T cells, in PF vs PD. B Spearman correlation between the intratumoral frequency of CD3 and Tregs (both expressed as a percentage of CD45+ cells), assessed by FC in PF vs PD. The graphs display non-linear regression curves and 95% confidence intervals. C Distribution of CD4+ and CD8+ T cell subsets (EMRA = CD45RA+CD27; CD45RA+CD27+ cells; CM = CD45RA-CD27+; EM = CD45RA-CD27) expressed as a frequency of CD4+ and CD8+ T cells, respectively, in PF vs PD. D Mean fluorescence intensity (MFI), expressed as Geomean (gMFI) of PD-1 in EMRA CD4+ T cell compartment in PF vs PD. E Distribution of the total myeloid compartment, defined as Lineage- (CD3-CD19CD56), HLA-DR+CD11c+, in PF vs PD. F Representative histograms showing the frequency of PD-L1+ TAMs (gated on Lineage-HLA-DR+CD11c+CD14+CD16+CD163+CD206+) in PF vs PD (plain color in orange and gray, respectively) and isotype controls (relative dotted lines) are shown on the left. Cumulative data are shown on the right. G gMFI of ICOS-L in Lineage-HLA-DR+CD11c+CD14+CD16+CD163CD206 TAMs. H Frequency of conventional DC1 (cDC1) cells, expressed as a frequency of CD141+ cells, within lineage-HLA-DR+CD11c+CD14CD16 cells, in PF vs PD. In all panels, PF: n = 6; PD: n = 4 (biologically independent samples). Data were presented as individual values showing mean ± SEM. Statistical tests: two-tailed unpaired t-test (Mann–Whitney test) (Panels A, CH). Nonparametric Spearman correlation (Panel B). If not indicated, no statistically significant difference was observed. Tconv T conventional, Treg T regulatory, EM effector memory, CM central memory, EMRA effector memory RA. Source data relative to all panels are provided as Source Data File.
Fig. 5
Fig. 5. Immune monitoring of peripheral T cells by flow cytometry.
A Frequency of peripheral CD4+ Tconv (CD3+CD4+CD127+/−CD25-), CD4+ Tregs (CD3+CD4+CD127loCD25+/high), and CD8+ T cells in PF vs PD at the indicated time points. B gMFI of PD-1 in CD4+ T conv cells in PF vs PD at the indicated time points. C Representative histograms at week 6 (left) and cumulative data (right) of the frequency of PD-1+ CD4+ Tconv cells in PF vs PD (in orange and gray, respectively), with isotype controls (relative dotted lines) at the indicated time points. D Representative histograms at week 6 (left) and cumulative data (right) of the frequency of PD-1+ EMRA CD4+ T cells in PF vs PD (in orange and gray, respectively), isotype controls (relative dotted lines) at the indicated time points. E Representative histograms at week 6 (left) and cumulative data (right) of the frequency of PD-1+ EM CD4+ Tconv cells in PF vs PD (in orange and gray, respectively), with isotype controls (relative dotted lines) at the indicated time points. F gMFI of OX40 in EMRA CD4+ T cell subset in PF vs PD at the indicated time points. G Representative histograms at baseline (left) and cumulative data (right) of the frequency of Ki67+ Tregs in PF vs PD (in orange and gray, respectively), isotype controls (relative dotted lines) at the indicated time points. H Representative histogram showing the frequency of PD-1+ EM CD8+ T cells at week 6 in PF vs PD (in orange and gray, respectively), isotype controls (relative dotted lines) (left). Cumulative data were shown on the right. In all panels: n = 7 for PF, n = 3 for PD at baseline; n = 9 for PF, n = 4 for PD week 3 and week 6 (biologically independent samples). Data were presented as individual values showing mean ± SEM. Statistical test: Two-way ANOVA—mixed-effects model with the Geisser-Greenhouse correction (all panels). If not indicated, no statistically significant difference was observed. Tconv T conventional, Treg T regulatory, EM effector memory, CM central memory, EMRA effector memory RA. Source data are provided as Source Data File.

References

    1. Siegel RL, Miller KD, Fuchs HE, Jemal A. Cancer statistics, 2022. CA Cancer J. Clin. 2022;72:7–33. doi: 10.3322/caac.21708. - DOI - PubMed
    1. Pal A, Kundu R. Human papillomavirus E6 and E7: the cervical cancer hallmarks and targets for therapy. Front. Microbiol. 2019;10:1–15. - PMC - PubMed
    1. Lei J, et al. HPV vaccination and the risk of invasive cervical cancer. N. Engl. J. Med. 2020;383:1340–1348. doi: 10.1056/NEJMoa1917338. - DOI - PubMed
    1. Pingali C, et al. National, regional, state, and selected local area vaccination coverage among adolescents aged 13–17 Years - United States, 2020. MMWR Morb. Mortal. Wkly Rep. 2021;70:1183–1190. doi: 10.15585/mmwr.mm7035a1. - DOI - PMC - PubMed
    1. Cibula D, et al. The European Society of Gynaecological Oncology/European Society for Radiotherapy and Oncology/European Society of Pathology Guidelines for the management of patients with cervical cancer. Int. J. Gynecol. Cancer. 2018;28:641–655. doi: 10.1097/IGC.0000000000001216. - DOI - PubMed

Publication types