. 2023 Jun 22;14(1):3719.
doi: 10.1038/s41467-023-39265-z.

Trispecific antibody targeting HIV-1 and T cells activates and eliminates latently-infected cells in HIV/SHIV infections

Affiliations

Trispecific antibody targeting HIV-1 and T cells activates and eliminates latently-infected cells in HIV/SHIV infections

Wanwisa Promsote et al. Nat Commun. .

Abstract

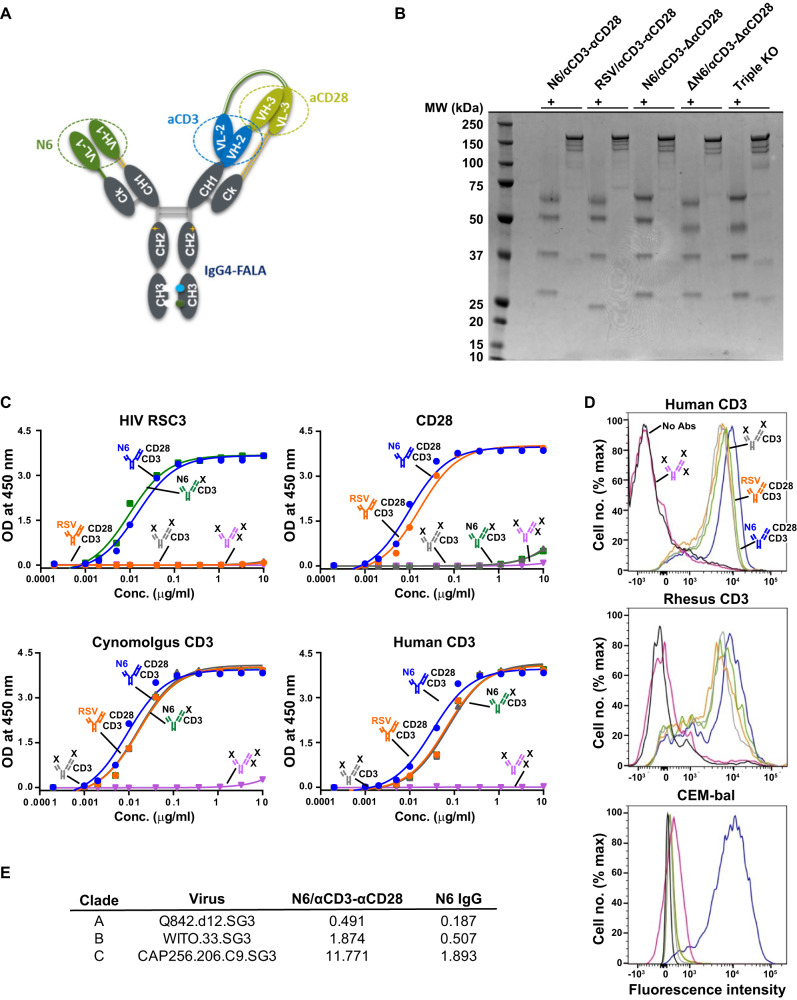
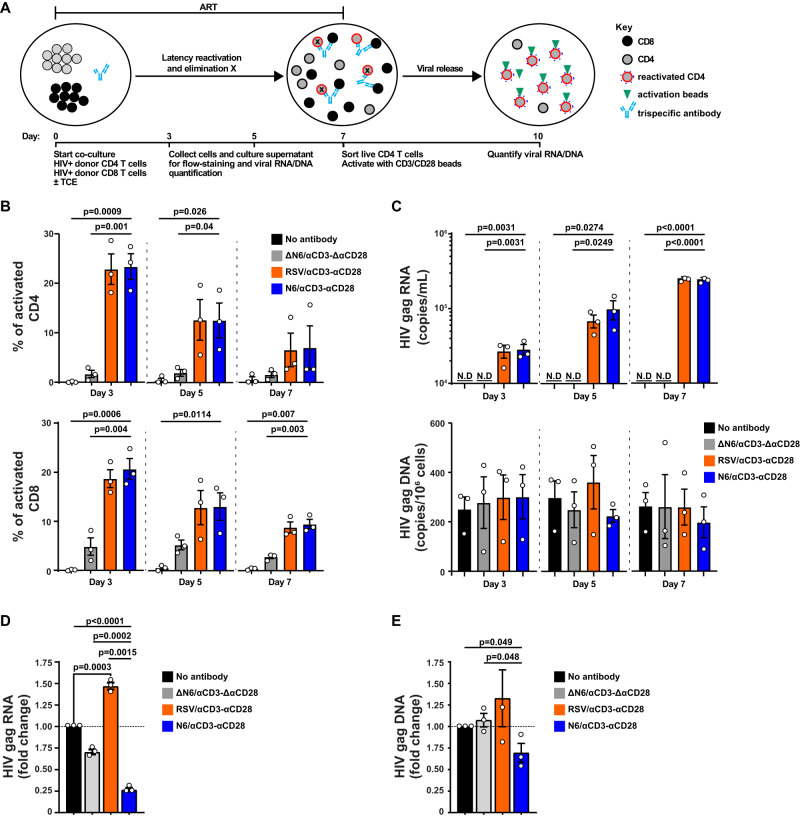
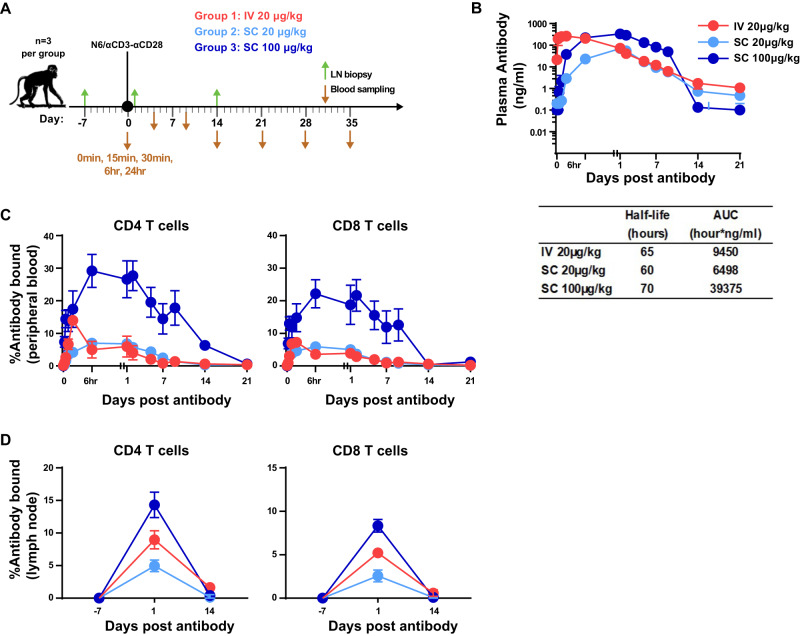
Agents that can simultaneously activate latent HIV, increase immune activation and enhance the killing of latently-infected cells represent promising approaches for HIV cure. Here, we develop and evaluate a trispecific antibody (Ab), N6/αCD3-αCD28, that targets three independent proteins: (1) the HIV envelope via the broadly reactive CD4-binding site Ab, N6; (2) the T cell antigen CD3; and (3) the co-stimulatory molecule CD28. We find that the trispecific significantly increases antigen-specific T-cell activation and cytokine release in both CD4+ and CD8+ T cells. Co-culturing CD4+ with autologous CD8+ T cells from ART-suppressed HIV+ donors with N6/αCD3-αCD28, results in activation of latently-infected cells and their elimination by activated CD8+ T cells. This trispecific antibody mediates CD4+ and CD8+ T-cell activation in non-human primates and is well tolerated in vivo. This HIV-directed antibody therefore merits further development as a potential intervention for the eradication of latent HIV infection.


Conflict of interest statement

L.X., Z.-Y.Y., G.J.N., R.W., J. Beninga, E.R., J.R.M., R.A.K., N.A.D-R., M.C. and A.P. are inventors on US patents US20200399369A1 and US20200054765A1 granted to Sanofi, The United States of America, as represented by the Secretary, Department of Health and Human Services, and the National Institutes of Health, that discloses the use of trispecific anti-HIV antibodies. L.X., J. Beninga, E.R., N.F., J. Birkenfeld, A.H.H., J. Beninga, J.S., B.Z., M.L., R.W., Z.-Y.Y., G.J.N. are or were employees of Sanofi while engaged in this research project. The other authors declare no competing interests.

Figures

Fig. 1
Fig. 1. Construction and characterization of trispecific antibodies.
A Configuration of the trispecific antibody. Colored shades (blue or green) denote variable heavy and light chain domains, whereas grey shades denote constant heavy and light chain domains. VH/VL, variable fragments. B The indicated trispecific antibodies were analysed by SDS-PAGE once with gel image showing the bands at the appropriate molecular sizes for the two heavy chains above 50 kDa and two light chains above 25 kDa under reducing conditions (+) and a single predominant 175 kDa band under non-reducing conditions (−). C ELISAs showing that N6/αCD3-αCD28 binds to the CD4-binding site (CD4bs) of HIV Env, CD28 and CD3. The N6/αCD3-αCD28 and control trispecific antibodies at increasing five-fold concentrations were allowed to bind to either a resurfaced HIV Env fragment containing the CD4bs, CD28, human or cynomolgus CD3 that was coated on ELISA plates and the bound antibodies were detected using a HRP-conjugated anti-IgG probe. The data represents the mean values from two biologically independent experiments. D N6/αCD3-αCD28 binds to T cells and HIV Env on the cell surface. Human T cells, rhesus T cells and HIV-infected CEM cells were incubated with trispecific N6/αCD28-αCD3 and the control antibody, and bound antibodies were detected by a fluorescein isothiocyanate-conjugated anti-IgG probe. and (E) Neutralization IC50 titres (µg ml−1) for the indicated trispecific N6/αCD3-αCD28 and control N6 protein against three representative HIV strains from clades (A, B and C). Source Data are provided as a Source Data file.
Fig. 2
Fig. 2. N6/αCD3-αCD28 enhances the T cell activation and T cell mediated lysis of SHIV- and HIV- infected cells.
A, B HIV dependent activation of T cells by N6/αCD3-αCD28. Effector PBMC cells were co-cultured with target cells that were either uninfected or HIV-infected CEM cells (indicated by ENV- and ENV+) in the presence of the trispecific antibodies and Brefeldin A for 16 h. The percentage of activated CD4+ and CD8+ T cells expressing both CD69 and CD25 (A) and intracellular IFN-γ (B) were measured using flow cytometry. The data were plotted as the mean ± SEM (n = 3 biological replicates). C, D Targeted lysis of HIV infected cell lines CEM-IIIb and ACH2 by N6/αCD3-αCD28. The HIV infected cells were co-cultured with SHIV+ LN CD8+ T cells which served as effector cells, in the presence of trispecific antibodies for 12 h. Percent lysis of the infected cells was measured using flow cytometry after staining with live/dead and apoptotic cell markers. Representative dose response data (C) and area under the curve (AUC) analysis (D) from three independent experiments. E Reduction in the levels of SHIV gag DNA in CD4+ T cells from SHIV-infected LN by N6/αCD3-αCD28. Sorted CD4+ and CD8+ T cells that served as target and effectors, respectively, were co-cultured with trispecific antibodies for 12 h. CD4+ T cells were then resorted from the co-culture for quantification of SHIV gag DNA. The data were plotted as the mean ± SEM (n = 5 biological replicates). F Reduction in the number of latently-infected CD4+ T cells by N6/αCD3-αCD28. Resting CD4+ T cells (CD4+CD25CD69) were sorted from PBMCs and infected with HIV BaL after culture with CCL19 for 3 days. These CD4+ T cells were then co-cultured with allogeneic CD8+ T cells and trispecific antibodies for 14 h. Intracellular p24 expression of CD4+ T cells was then measured by flow cytometry. The data were plotted as the mean ± SEM (n = 6 biological replicates). Statistical significance was measured by unpaired, two-tailed Student’s t-test with P values less than 0.05 considered significant (B, D, E, F). Source Data are provided as a Source Data file.
Fig. 3
Fig. 3. N6/αCD3-αCD28 induces HIV reactivation and redirects T-cell mediated lysis of latently-infected CD4+ T cells of ART-suppressed PBMC.
A Ex vivo latency reversing assay. Sorted autologous CD4+ and CD8+ T cells from PBMCs of antiretroviral therapy (ART)-treated donors were co-cultured (1:1) and treated with N6/αCD3-αCD28 or control constructs in the presence of ART for 7 days. On day 3, 5, and 7, cells and supernatant from the co-culture were collected and assessed for the induction of T-cell activation, and for the quantification of HIV gag RNA and DNA. On day 7, live CD4+ T cells were sorted from the co-culture and stimulated with αCD3/αCD28 activation beads in the absence of both ART and trispecific antibody for 72 h, and the level of HIV gag DNA and RNA were then quantified. B, C Activation of latently-infected CD4+ and CD8+ T cells from ART-suppressed HIV infected donors by N6/αCD3-αCD28. Sorted CD4+ T cells from ART-suppressed HIV infected PBMC samples were co-cultured with sorted autologous effector CD8+ T cells in the presence of trispecific antibodies. Total cells were collected on day 3, 5, and 7 from the co-culture, and were stained with antibodies against CD69 and CD25 for the measurement of activated CD4+ and CD8+ T cells by flow cytometry (B). The culture supernatant was collected on day 3, 5, and 7 for quantification of HIV gag RNA and DNA by real time RT-PCR (C). D, E Reduction in viral release from CD4+ T cells of ART-suppressed HIV infected donors by N6/αCD3-αCD28. On day 7 of the co-culture, live CD4+ T cells were isolated for a viral release assay, in which anti-CD3 and anti-CD28 activation beads were used to stimulate the viral release. The cells and culture supernatant were collected 72 h after for quantification of HIV gag RNA (D) and DNA (E) by real time RT-PCR. The data were plotted as the mean ± SEM. Statistical significance was measured by unpaired, two-tailed Student’s t-test with P values less than 0.05 considered significant (n = 3 biological replicates). N.D not detectable. Source Data are provided as a Source Data file.
Fig. 4
Fig. 4. Study design and comparison of the effects of intravenous versus subcutaneous administration of N6/αCD3-αCD28 on pharmacokinetics in naïve rhesus macaques.
A Rhesus macaques (n = 3 per group) received a single dose of N6/αCD3-αCD28 either via intravenous or subcutaneous administration ranging at 20−100 ug kg−1 N6/αCD3-αCD28 delivered via either a single intravenous or subcutaneous injection at the dose ranging 20–100 ug kg−1. Lymph node and blood samples were collected at various timepoints before, during, and after the administration of N6/αCD3-αCD28. B Plasma levels and half-life of N6/αCD3-αCD28 were measured, as described in the “Materials and Method”. C, D Percentage trispecific N6/αCD3-αCD28 bound to CD4+ and CD8+ T cells in peripheral (C) and in lymph node (D). Trispecific N6/αCD3-αCD28 binding to T cells was determined using anti-human IgG4 (Southern Biotech) to measure the percentage of cells with bound N6/αCD3-αCD28 on the indicated subpopulations of T cells by flow cytometry. The data were plotted as the mean of three animals ±SEM. Source Data are provided as a Source Data file.
Fig. 5
Fig. 5. In vivo effects of N6/αCD3-αCD28 on immune activation in naïve rhesus macaques.
A, B T cell activation after N6/αCD3-αCD28 administration. The levels of CD69 expression of CD4+ and CD8+ T cells in PBMCs (A) and lymph node (B) was quantified using flow cytometry. C Immune activation in lymph nodes after N6/αCD3-αCD28 administration using multiplexed confocal imaging. Representative staining of LN sections (scale bar, 500 mm) from animals received N6/αCD3-αCD28 via subcutaneous administration at 20 ug kg−1 (top images) and 100 ug kg−1(bottom images), showing CD20+ (turquoise), and immune activation marker Ki67 (pink) on days-7, 1 and day 14 post antibody. Quantification of total Ki-67+ cells normalized to whole lymph node area (mm2) is shown. D Increase in inflammatory cytokine levels in plasma after N6/αCD3-αCD28 administration. The levels of inflammatory plasma cytokines were assessed at various time points before and after N6/αCD3-αCD28 administration by a multiplex bead-based assay. The data were plotted as the mean of three animals ±SEM. Statistical significance in (C) was measured by ordinary one-way ANOVA, Hom-Sidak’s multiple comparison test with P values less than 0.05 considered significant (n = 3 biological replicates). Source Data are provided as a Source Data file.

References

    1. Palella FJ, Jr, et al. Declining morbidity and mortality among patients with advanced human immunodeficiency virus infection. HIV outpatient study investigators. N. Engl. J. Med. 1998;338:853–860. doi: 10.1056/NEJM199803263381301. - DOI - PubMed
    1. Mocroft A, et al. Decline in the AIDS and death rates in the EuroSIDA study: an observational study. Lancet (Lond., Engl.) 2003;362:22–29. doi: 10.1016/S0140-6736(03)13802-0. - DOI - PubMed
    1. Porter K, et al. Determinants of survival following HIV-1 seroconversion after the introduction of HAART. Lancet (Lond., Engl.) 2003;362:1267–1274. doi: 10.1016/S0140-6736(03)14570-9. - DOI - PubMed
    1. May MT, et al. Impact on life expectancy of HIV-1 positive individuals of CD4+ cell count and viral load response to antiretroviral therapy. AIDS (Lond., Engl.) 2014;28:1193–1202. doi: 10.1097/QAD.0000000000000243. - DOI - PMC - PubMed
    1. Samji H, et al. Closing the gap: increases in life expectancy among treated HIV-positive individuals in the United States and Canada. PloS One. 2013;8:e81355. doi: 10.1371/journal.pone.0081355. - DOI - PMC - PubMed