. 2023 Jun 22;14(1):3728.
doi: 10.1038/s41467-023-39295-7.

NBEAL2 deficiency in humans leads to low CTLA-4 expression in activated conventional T cells

Affiliations

NBEAL2 deficiency in humans leads to low CTLA-4 expression in activated conventional T cells

Laure Delage et al. Nat Commun. .

Abstract

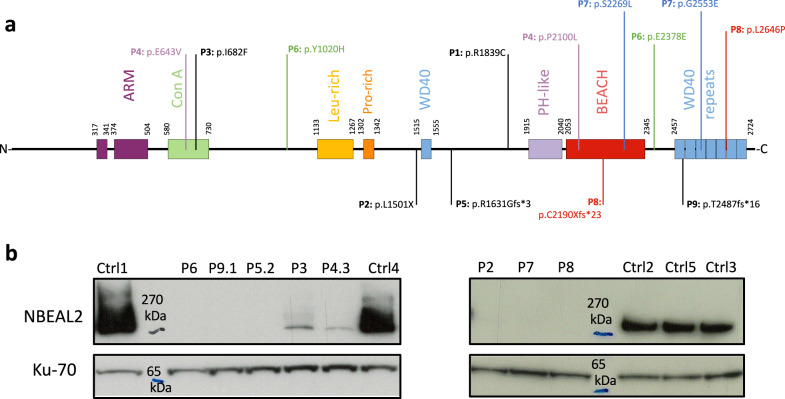
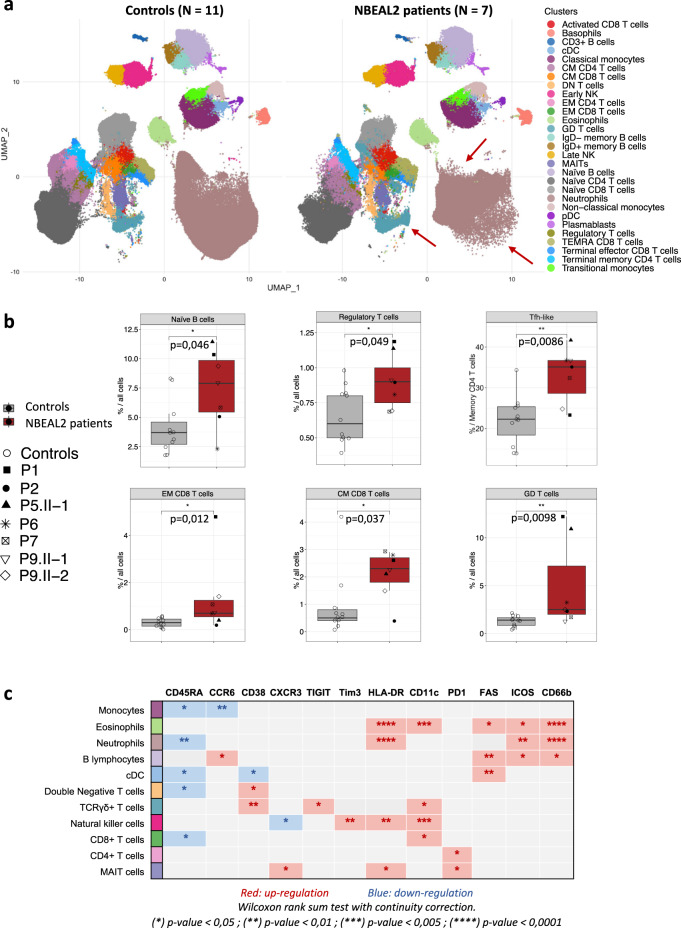
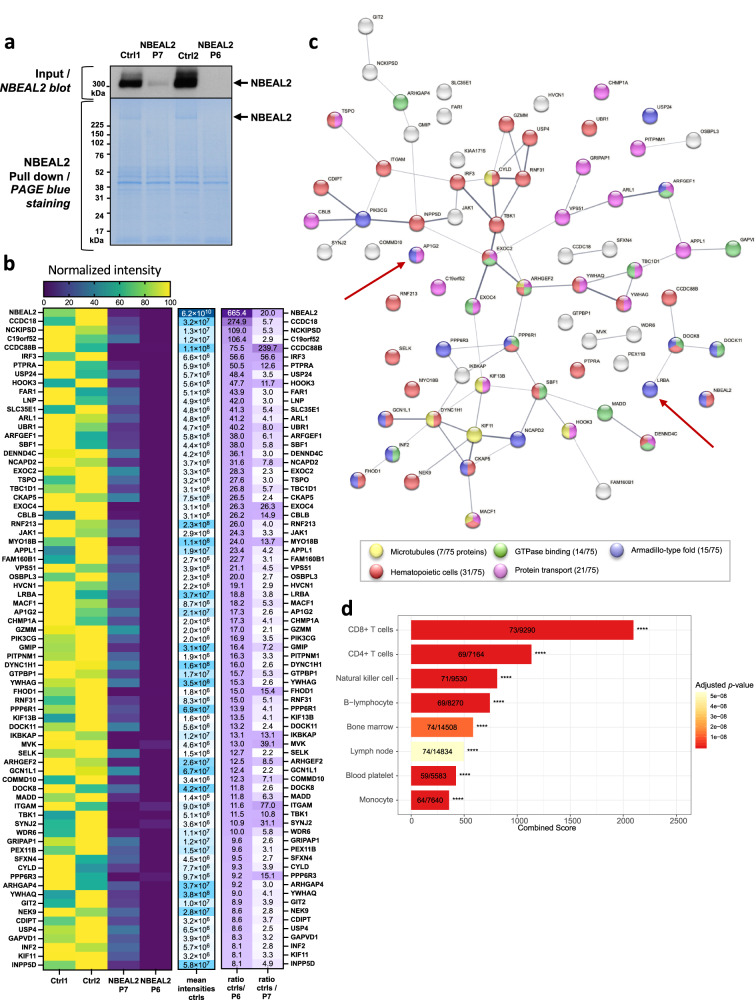
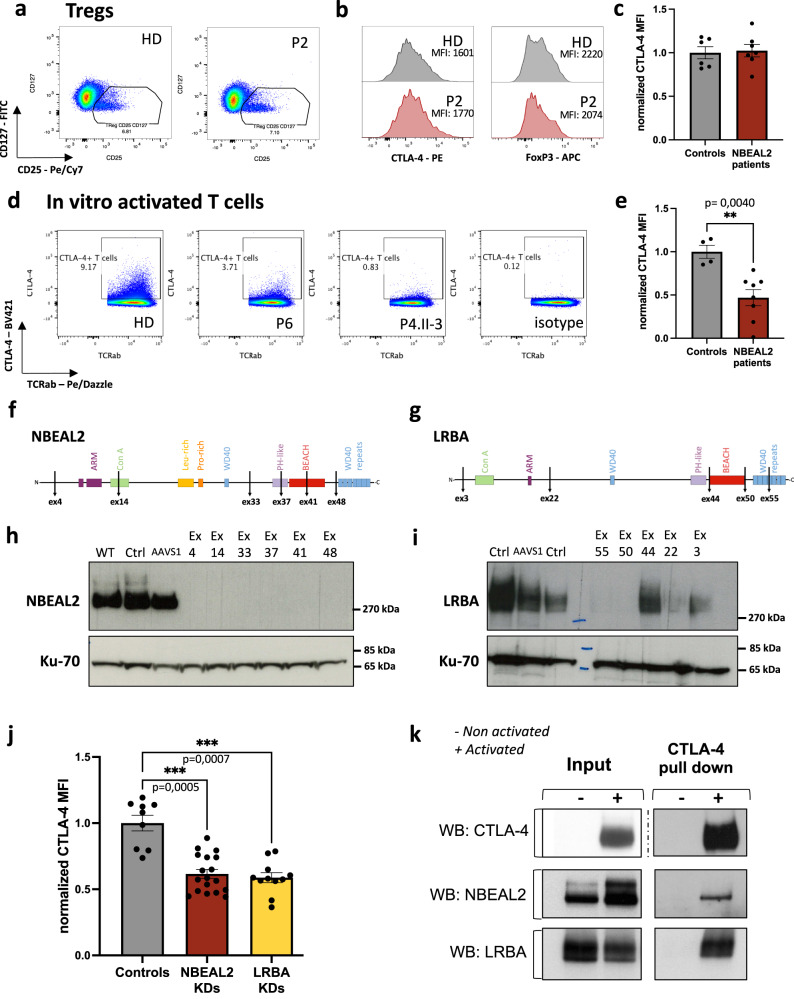
Loss of NBEAL2 function leads to grey platelet syndrome (GPS), a bleeding disorder characterized by macro-thrombocytopenia and α-granule-deficient platelets. A proportion of patients with GPS develop autoimmunity through an unknown mechanism, which might be related to the proteins NBEAL2 interacts with, specifically in immune cells. Here we show a comprehensive interactome of NBEAL2 in primary T cells, based on mass spectrometry identification of altogether 74 protein association partners. These include LRBA, a member of the same BEACH domain family as NBEAL2, recessive mutations of which cause autoimmunity and lymphocytic infiltration through defective CTLA-4 trafficking. Investigating the potential association between NBEAL2 and CTLA-4 signalling suggested by the mass spectrometry results, we confirm by co-immunoprecipitation that CTLA-4 and NBEAL2 interact with each other. Interestingly, NBEAL2 deficiency leads to low CTLA-4 expression in patient-derived effector T cells, while their regulatory T cells appear unaffected. Knocking-down NBEAL2 in healthy primary T cells recapitulates the low CTLA-4 expression observed in the T cells of GPS patients. Our results thus show that NBEAL2 is involved in the regulation of CTLA-4 expression in conventional T cells and provide a rationale for considering CTLA-4-immunoglobulin therapy in patients with GPS and autoimmune disease.


Conflict of interest statement

L.D., J-L.Z., E.K., A.B., G.K., C.E., S.R., and B.P. are employees of Sanofi, France. J-L.Z., E.K., A.B., G.K., C.dC., S.R., L.D., C.E., and B.P. may hold shares and/or stock options in the company. Other authors have nothing to disclose.

Figures

Fig. 1
Fig. 1. Grey platelet syndrome cohort: mutations characteristics.
a Positions of the NBEAL2 mutations at the protein level. Compound heterozygous mutations are annotated with the same color. Homozygous mutations are annotated in black. b NBEAL2 immunoblotting on activated T cells lysates from patients and healthy controls (Ctrl), performed once for each sample. The protein ku-70 is used as a loading control. Source data are provided as a Source Data file.
Fig. 2
Fig. 2. Immunophenotyping of patients with GPS.
a Uniform manifold approximation and projection (UMAP) of immune cell subsets analyzed by CyTOF on whole blood samples from age-matched healthy controls (N = 11) and NBEAL2 patients (N = 7). Each cluster is color coded. The red arrows indicate changes in the cluster’s shapes of the patients group. The markers used to identify these cell clusters are shown in the heatmap of supplementary figure 2 A. cDC classical dendritic cell, CM central memory, EM effector memory, pDC plasmacytoid dendritic cell, TEMRA terminally differentiated effector memory re-expressing CD45RA, NK natural killer, MAIT mucosal associated invariant T cell. b Statistically significant cluster biases observed in the CyTOF immune phenotype from healthy controls and NBEAL2 patients. Results shown correspond to 11 controls and 7 NBEAL2 patients. The line at inside the box is the median value (50th percentile). Minima and maxima of the boxes correspond to 25th and 75th percentile. Whiskers marks the 10th and 90th percentile. Two-tailed p-values were determined with a Wilcoxon rank-sum test with continuity correction. *p-value < 0.05; **p-value < 0.01; ***p-value < 0.005; ****p-value < 0.0001. TFH-like T follicular helper cells, EM effector memory, CM central memory, GD T cells: γδ T cells. Source data are provided as a Source Data file. c Table summarizing the significant overexpression (red) or downregulation (blue) of biological markers in the different immune cell subsets from GPS patients versus healthy controls. Two-tailed p-values were determined with a Wilcoxon rank sum test with continuity correction. *p-value < 0.05; **p-value < 0.01; ***p-value < 0.005; ****p-value < 0.0001.
Fig. 3
Fig. 3. NBEAL2’s partners in activated T cells.
a Immunoblotting of NBEAL2 in T cells lysate from healthy subject (Ctrl 1 and 2) and NBEAL2 patients (P6, P7). Immunoblot of the input fractions before NBEAL2 immunoprecipitation in T cells (top) and Page Blue staining after NBEAL2 pull down (bottom). Experiment performed once. b Heatmaps of the selected NBEAL2 partners after mass spectrometry analyses. The left heatmap shows normalized intensities of the 74 proteins selected after mass spectrometry analysis of the NBEAL2 interactome. The middle heatmap represents the mean intensities detected for the two controls (by mass spectrometry). The heatmap on the right shows the intensities ratio of the mean control intensity over each NBEAL2 patient. The proteins are ranked by intensities ratio of controls over NBEAL2 patient P6. c STRING network analysis of the 74 proteins and node coloring per function. The network edges indicate both functional and physical protein associations: proteins jointly contribute to a shared function. However, the network edges do not necessarily mean proteins are physically binding to each other. The line thickness indicates the strength of data support. d Analysis of the 74 proteins partners of NBEAL2 in enrichR using the Jensen Tissue library. The most represented cells in which the proteins partners are expressed is shown. In the barplots the number of proteins versus the number of proteins defining the cell type is indicated. Two-sided p-value is obtained with a Fischer’s exact test and adjusted with a Benjamini–Hochberg correction. The combined score is a combination of the p-value and z-score calculated by multiplying the two scores. Source data are provided as a Source Data file.
Fig. 4
Fig. 4. NBEAL2 is involved in CTLA-4 expression after TCR activation.
a Representative gating strategy for one healthy donor (HD) and one NBEAL2-deficient patient on CD4 + T cells. Tregs were defined as CD4+CD25+CD127low T cells. b Representative histograms of CTLA-4 and FOXP3 expression on CD25+CD127low Treg for one healthy donor (HD) and one NBEAL2-deficient patient. c Normalized CTLA-4 mean of fluorescence intensity (MFI) in CD25+CD127low Treg from controls (N = 6) and NBEAL2-deficient patients (N = 7). Mean ± SEM is represented. d Gating strategy to define CTLA-4 positive T cells after activation. The gating was tuned using a control isotype antibody. e Normalized CTLA-4 mean of fluorescence intensity (MFI) of activated T cells from controls (N = 4) and NBEAL2-deficient patients (N = 8). Mean ± SEM is represented. Two-tailed p-value is determined with a non-parametric Mann–Whitney test. f, g Diagram of the primary structure of NBEAL2 (f) and LRBA (g) proteins. Positions targeted by the CRISPR guide RNA used are indicated. h, i NBEAL2 (h) and LRBA (i) immunoblotting after CRISPR-Cas9 experiment on activated T cells. WT: refers to cells that underwent nucleofection without CRISPR/Cas9 in the solution. Ctrl: refers to cells nucleofected with a scramble guide and the Cas9. AAVS1: refers to cells transfected with a the Cas9 and a guide targeting an intronic position of the genome. Other cell lysates correspond to NBEAL2-CRISPR/Cas9 treatment (f) and LRBA-CRISPR/Cas9 treatment (g). Ku-70 is used as a loading control. j Normalized CTLA-4 MFI after CRISPR-Cas9 knockdown (KD) experiment for each mRNA guide (6 for NBEAL2; 5 for LRBA) used on three independent healthy donors activated T cells, over 2 independent experiments. Mean ± SEM is represented. Controls correspond to the three conditions Ctrl, WT, and AAVS1 described in h and i for each donor tested. Non-parametric two-sided Kruskal-Wallis test corrected with Dunn’s test for multiple comparisons was used to compare each group. k Immunoprecipitation (IP) of CTLA-4 in activated (+) or unstimulated (−) T cells from healthy donors. NBEAL2, LRBA, and CTLA-4 were immunoblotted on input fractions and on the IP fractions, as indicated (blots representative of N = 3 experiments). Source data are provided as a Source Data file.
Fig. 5
Fig. 5. Differential gene expression analyses: comparison of NBEAL2 and LRBA-deficient T cells.
a Differential Gene Expression (DEG) analyses between the NBEAL2-deficient cells (N = 5) or LRBA-deficient cells (N = 5) and the healthy controls group (N = 7). IPA Pathways analyses were performed on the T CD4+ lymphocytes subsets. In red the DEG correspond to the comparison between NBEAL2 patients and controls. In yellow, the DEG correspond to the comparison between LRBA patients and controls. b Differential Gene Expression (DEG) analyses between the NBEAL2 and LRBA patients’ groups and the healthy controls group. IPA Pathways analyses of the T CD8+ lymphocytes subsets. In red the DEG correspond to the comparison between NBEAL2 patients and controls. In yellow, the DEG correspond to the comparison between LRBA patients and controls. c Signature of the STAT3/IL-6 pathway in T cells subsets for the NBEAL2, LRBA and healthy controls groups. The heatmap shows the average signature score for the T cells subsets of each group. The list of genes from the signature Hallmark_IL6_JAK_STAT3_signaling was used. Source data are provided as a Source Data file.

References

    1. Gunay-Aygun M, et al. NBEAL2 is mutated in Gray Platelet Syndrome and is required for biogenesis of platelet alpha-granules. Nat. Genet. 2011;43:732–734. doi: 10.1038/ng.883. - DOI - PMC - PubMed
    1. Albers CA, et al. Exome sequencing identifies NBEAL2 as the causative gene for Gray Platelet Syndrome. Nat. Genet. 2011;43:735–737. doi: 10.1038/ng.885. - DOI - PMC - PubMed
    1. Kahr WHA, et al. Abnormal megakaryocyte development and platelet function in Nbeal2−/− mice. Blood. 2013;122:3349–3358. doi: 10.1182/blood-2013-04-499491. - DOI - PMC - PubMed
    1. Deppermann C, Nurden P, Nurden AT, Nieswandt B, Stegner D. The Nbeal2 −/− mouse as a model for the gray platelet syndrome. Rare Dis. 2013;1:e26561. doi: 10.4161/rdis.26561. - DOI - PMC - PubMed
    1. Sowerby JM, et al. NBEAL2 is required for neutrophil and NK cell function and pathogen defense. J. Clin. Invest. 2017;127:3521–3526. doi: 10.1172/JCI91684. - DOI - PMC - PubMed

Publication types

MeSH terms