. 2023 Jul;26(7):1245-1255.
doi: 10.1038/s41593-023-01367-8. Epub 2023 Jun 22.

Esr1+ hypothalamic-habenula neurons shape aversive states

Affiliations

Esr1+ hypothalamic-habenula neurons shape aversive states

Daniela Calvigioni et al. Nat Neurosci. 2023 Jul.

Abstract

Excitatory projections from the lateral hypothalamic area (LHA) to the lateral habenula (LHb) drive aversive responses. We used patch-sequencing (Patch-seq) guided multimodal classification to define the structural and functional heterogeneity of the LHA-LHb pathway. Our classification identified six glutamatergic neuron types with unique electrophysiological properties, molecular profiles and projection patterns. We found that genetically defined LHA-LHb neurons signal distinct aspects of emotional or naturalistic behaviors, such as estrogen receptor 1-expressing (Esr1+) LHA-LHb neurons induce aversion, whereas neuropeptide Y-expressing (Npy+) LHA-LHb neurons control rearing behavior. Repeated optogenetic drive of Esr1+ LHA-LHb neurons induces a behaviorally persistent aversive state, and large-scale recordings showed a region-specific neural representation of the aversive signals in the prelimbic region of the prefrontal cortex. We further found that exposure to unpredictable mild shocks induced a sex-specific sensitivity to develop a stress state in female mice, which was associated with a specific shift in the intrinsic properties of bursting-type Esr1+ LHA-LHb neurons. In summary, we describe the diversity of LHA-LHb neuron types and provide evidence for the role of Esr1+ neurons in aversion and sexually dimorphic stress sensitivity.


Conflict of interest statement

The authors declare no competing interests.

Figures

Fig. 1
Fig. 1. Electrophysiological diversity of LHA–LHb neurons.
a, Strategy for retrograde labeling of LHA–LHb neurons. b, Cell-attached electrophysiological recordings reveal tonic firing of LHA–LHb neurons. Cell-attached traces from representative neurons (left) and the mean firing rate of the individual neurons (mean ± s.d.; right). nneuron = 230, from left to right nneuron = 20, 49, 65, 37, 40, 19 and nmice = 46 WT. c, Overlay of the individual whole-cell traces of firing at rheobase (Rheo) of all recorded LHA–LHb neurons. Black represents a trace from a representative neuron. Inset, phase-plane plots of the first AP at rheobase for all individual neurons. d, Electrophysiological properties reveal anatomical organization of LHA–LHb neurons. Dots represent recorded LHA–LHb neurons color coded by different electrophysiological parameters. e, Three-dimensional position of all recorded LHA–LHb neurons (color coded by cell type). f, Three-dimensional visualization of the A-P distribution of electrophysiologically characterized LHA–LHb neuron types. Bregma coordinates show the most anterior and posterior coordinates for each subtype. g, Reconstruction of representative dendritic morphologies of LHA–LHb neuron types. h, Images of representative soma morphologies of the LHA–LHb neuron types. i, Heatmap of 20 electrophysiological parameters selected based on PCA. Classification of LHA–LHb neuron types by expert classification, as in c. One column = one LHA–LHb neuron. j, Circular dendrogram for hierarchical clustering of LHA–LHb neurons. Color code, expert classification of LHA–LHb neurons. k, t-distributed stochastic neighbor embedding (t-SNE) plots of graph-based clustering (left), and consensus clustering (right). Color code, consensus clustering of LHA–LHb neurons. l, Agreement between the expert classification and the unsupervised consensus clustering of LHA–LHb neurons. All data acquired in male mice. Scale bar, 50 μm (g), 10 μm (h). See also Extended Data Figs. 1 and 2 and Supplementary Tables 1–3. nneuron = number of neurons; nmice= number of mice. WT, wild type; A-P, anteroposterior; M-L, medio-lateral; D-V, dorso-ventral; 2XRheo, two times the rheobase current injection; Max, maximal firing frequency; Mem, membrane intrinsic property; pcs, pieces. Source data
Fig. 2
Fig. 2. Discrete organization of genetically targeted LHA–LHb pathways.
a, Schematic of Patch-seq showing somatic harvesting of retrobead-labeled LHA–LHb neurons. b, t-SNE plots of all recorded LHA–LHb neurons (nneuron = 230, nmice = 46 WT, same neurons as in Fig. 1). The cell type identify of neurons collected for Patch-seq are color coded based on electrophysiology (expert classification; left), or gene expression (unbiased clustering; right). n = 163 collected neurons; FA-Bk, nneuron = 12; Burst, nneuron = 42; RS-N, nneuron = 35; LS-N, nneuron = 35; LS-W, nneuron = 28; RS-W, nneuron = 11 and nmice = 46 WT. Gray neurons, recorded but not collected. c, Comparison of electrophysiological (expert classification as in b, left) versus gene expression classification (unbiased clustering as in b, right) of LHA–LHb neurons (colored as in b). d, Heatmap of genes with differential expression in the electrophysiologically defined LHA–LHb neuron types (right). Expression of vesicular transporters in the LHA–LHb neuron types (left). Colored dots represent genetic markers employed for subsequent cell-type-specific targeting. e, Experimental strategy for anterograde labeling of LHA–LHb axon terminals. f, Representative images of virally labeled LHA–LHb axon terminals in the mouse cre lines used for targeting specific LHA–LHb pathways (Pv-cre, Esr1-cre, Npy-cre and Gal-cre mice, respectively). Brain section with peak terminal density is shown. g, Heatmaps of the axon terminal density in the LHb for the four genetically targeted LHA–LHb pathways. h, Visualization of the topographical organization of the pathway-specific projection fields in the LHb. Colors as in g, white is not assigned to a specific pathway (Methods). i, Proportion of the LHb area targeted by the distinct LHA–LHb pathways, plotted along the A-P axis. Left bar, cumulative targeting of LHb by the four LHA–LHb pathways. j, Three-dimensional reconstructions (four different orientations) of the LHb projection fields of the four LHA–LHb pathways. nneuron = number of neurons, nmice = number of mice. All data were acquired in male mice. Scale bar, 100 μm (f). See also Extended Data Figs. 3 and 4. MHb, medial habenula.
Fig. 3
Fig. 3. The Esr1+ LHA–LHb pathway drives aversion.
a, Experimental strategy for somatic optogenetic manipulation of LHA–LHb neurons (left), optogenetic manipulation of LHA–LHb axon terminals in the LHb (middle) and optogenetic manipulation of the axon terminals in the LHb of the entire LHA–LHb pathway in combination with TeLC silencing of the Esr1+ LHA–LHb neurons (right). bd, Representative images of the optic fiber path and/or viral expression for the three experimental strategies. b, ChR2–mCherry expression and somatic optogenetic manipulation of Esr1+ LHA–LHb neurons. Black box, location of the right panel. c, ChR2–mCherry expression and optogenetic stimulation of Esr1+ LHA–LHb axon terminals in the LHb. Black box, location of the right panel. d, Nuclear TeLC-mCherry expression in Esr1+ LHA–LHb neurons in the LHA (left), and ChR2-eYFP expression in LHA–LHb terminals in the LHb (right). e, Schematic outline of the real-time place aversion test (rtPA). Habituation of 10 min was 24 h later followed by optogenetic stimulation paired to the right compartment (ON, light blue, 10 min) and an immediate switch of the optogenetic stimulation to the left compartment (ON SWITCH, blue, 10 min). f, Behavior in the rtPA. Optogenetic activation of the Esr1+ LHA–LHb and the VGlut2+ LHA–LHb pathway, respectively, significantly reduced the time spent in the compartment paired with optogenetic stimulation (Esr1:ChR2 habituation versus ON, P = 6.20 × 109; Esr1:ChR2 habituation versus ON SWITCH, P = 5.72 × 1014; Vglut2:ChR2 habituation versus ON, P = 0.0017, Vglut2:ChR2 habituation versus ON SWITCH, P = 7.07 × 104, two-sided unpaired t-test). Horizontal bars: light blue, ON; blue, ON SWITCH; gray, right compartment during habitation. Empty circles represent somatic stimulation and gray dots axon terminal stimulation. Ctl, nmice = 8; Esr1:ChR2, nmice = 16; Pv:ChR2, nmice = 10; Npy:ChR2, nmice = 15; Gal:ChR2, nmice = 6; Vglut2:ChR2, nmice = 5; Esr1:TeLC LHA–LHb:ChR2, nmice = 6. g, Schematic outline of the strategy for induction of an immediate (beige) and sustained aversive state (brown). State induction (light blue), 10 min optogenetic stimulation of LHA–LHb axon terminals in the LHb. h,i Scoring of aversive behaviors (stop-backward movement, sharp turns and digging) during state induction, one color coded vertical bar = 1 s in a specific aversive behavior. Ctl, Esr1:ChR2 and Esr1:TeLC LHA–LHb:ChR2 mice—nmice = 6, each, and Npy:ChR2—nmice = 7, same animals in i, j and m,n. i, The optogenetic stimulation of Esr1+ LHA–LHb axon terminals significantly increased the total time spent in aversive behaviors during state induction (Esr1:ChR2 versus Ctl, P = 0.0022, two-sided unpaired t-test). Same animals in j. j, Scoring of free rearing during state induction, one colored coded vertical bar = 1 s free rearing (left). Optogenetic stimulation of Npy+ LHA–LHb axon terminals significantly increased the time spent free rearing (Npy:ChR2 versus Ctl, P = 1.17 × 107, unpaired t-test). The same effect was seen in response to axon terminal stimulation of the compound LHA–LHb pathway in combination with TeLC silencing of the Esr1+ LHA–LHb neurons (Esr1:TeLC LHA–LHb:ChR2 versus Ctl, P = 9.39 × 104, two-sided unpaired t-test; right). Same animals in h. k, Free rearing in the open field. Somatic activation of Npy+ LHA–LHb neurons significantly increased the total time spent free rearing (right; Npy:ChR2 (nmice = 5) versus Ctl (nmice = 4), P = 0.0464, unpaired t-test). Cumulative number of free-rearing events; thick line, mean (left). l, Experimental strategy for TeLC mediated silencing of Npy+ LHA–LHb and Esr1+ LHA–LHb neurons, respectively (left). TeLC silencing of Npy+ LHA–LHb neurons significantly decreased the total time spent free rearing in the open field (right; Npy:TeLC (nmice = 7) versus Ctl (nmice = 7), P = 0.0016, unpaired t-test). Esr1:TeLC, nmice = 6 mice. m,n, Free exploration directly after (j) and 24 h after (k) the state induction. Optogenetic stimulation of Esr1+ LHA–LHb axon terminals significantly increased conditioned place aversion (right; immediate state, Esr1:ChR2 versus Ctl mice, P = 9.56 × 105; sustained state, Esr1:ChR2 versus Ctl mice, P = 7.58 × 104, two-sided unpaired t-test). Representative heatmaps of locomotion (left). m, Ctl nmice = 6 and Esr1:ChR2, Npy:ChR2 and Esr1:TeLC LHA–LHb:ChR2, nmice = 7 (each). n, Ctl and Esr1:TeLC LHA–LHb:ChR2, nmice = 6 (each); Esr1:ChR2 and Npy:ChR2, nmice = 7 (each). nmice = number of mice. All data were acquired in male mice. For boxplots f and in, data are shown as median (center line), box (25th and 75th percentiles), whiskers (nonoutlier minimum and maximum) and outliers (>1.5 interquartile range). Scale bars, 1 mm; boxes, 100 μm (bd). *P < 0.05, **P < 0.01, ***P < 0.001. See also Extended Data Fig. 5 and 6, Supplementary Videos 1 and 2 and Supplementary Table 4. Source data
Fig. 4
Fig. 4. The Esr1+ LHA–LHb pathway regulates neural population dynamics in the PFC.
a, Schematic illustration of the experimental setup. b, Behavioral protocol, colors as in a. Block 1—presentation of a pure tone (200 ms) at the trial start. Block 2—presentation of a pure tone (200 ms) at the trial start followed by optogenetic stimulation (500 ms) of LHA–LHb neurons 500 ms after the end of the tone. Block 3—identical to block 1. Block 4—presentation of blue noise (200 ms) at the trial start followed by mild air puffs (50 ms) to the eye 500 ms after the end of sound presentation. c, Representative example of CM-DiI labeled (red) probe track in DAPI stained (turquoise) brain section. AP = 1.90 mm, Allen reference atlas CCFv3. d, Three-dimensional rendering of the tracked anatomical position of 25 Neuropixels probes in the PFC. Brain regions are color coded as in c. Bottom, the animal cohorts Ctl, Npy:ChR2 and Vglut2:ChR2 mice, nmice = 5 (each); Esr1:ChR2, nmice = 10 for all panels. e, PSTH (bin size 10 ms) of the firing rate modulation in block 2 for all units (nunit = 4,152). Vertical lines, onset of auditory stimulus (black dot), and optogenetic stimulation (blue dot). Mean ± s.e.m. f, Difference between the mean pupil area in single trials (blocks 1–3), and the mean pupil area in block 1 (block 1, 50 trials; block 2, 100 trials and block 3, 50 trials). Ctl, Npy:ChR2 and Vglut2:ChR2 mice, nmice = 5 (each); Esr1:ChR2 mice, nmice = 10. Mean ± s.d. (two-sided Mann–Whitney U test with Bonferroni correction (α corrected = 0.017), P values (block 1 versus block 2, block 1 versus block 3 and block 2 versus block 3, respectively): Esr1:ChR2—P = 3.09 × 1014, P = 1.45 × 1012, P = 0.01; Vglut2:ChR2—P = 1.55 × 1011, P = 1.15 × 108, P = 0.68; Ctl:ChR2—P = 0.12, P = 0.23, P = 0.59; Npy:ChR2—P = 0.035, P = 1.91 × 108, P = 9.61 × 1015). g, Color-coded tuning score for all units (dots; nunit = 1,945) in response to optogenetic stimulation versus air puffs. Gray units, nonsignificant tuning. Bar graphs, fraction of units with significantly negative (light blue) and positive (red) tuning. h, Activity-based hierarchical clustering of all units (nunit = 1,770; mouse cre lines color coded as in d; vertical lines—onset of auditory stimulus (black or gray), optogenetic stimulation (blue) and air puffs (orange)). i, mPFC neuronal population activity in the four blocks projected in 3D onto three activity modes (‘state’, ‘sound’ and ‘opto OR air puff’; nmice = 25, all genotypes; top). mPFC population activity projected onto the ‘opto OR air puff’ mode (middle) and the ‘state’ mode (bottom). Vertical lines—onset of auditory stimulus (black or gray), optogenetic stimulation (blue) and air puffs (orange). j, Mapping of the ‘opto OR air puff’ mode and the ‘state’ mode in discrete mPFC subregions. The difference between the projection of block 1 versus block 2 shown as heatmap for each mPFC subregion. Vertical lines, onset of auditory stimulus (black) and optogenetic stimulation (blue). k, Decoding (average prediction accuracy) of block identity (block 1 versus block 2) (mean ± s.d., 50 repeated cross-validations; dashed line, 50% chance performance). l, Fraction of significantly tuned units across the mPFC subregions in response to optogenetic stimulation in Esr1:ChR2 mice (nmice = 10; left). Mean difference of the projection of the ‘state mode’ between block 1 versus block 2 across the mPFC subregions (middle). The difference in decoding (average prediction accuracy) of block identity (block 1 versus block 2) in Esr1:ChR2 versus Ctl mice (right). AP = 1.90 mm, Allen reference atlas CCFv3. nunit = number of units, nmice = number of mice. Schematic in a adapted from Scidraw (https://scidraw.io/). All data were acquired in male mice. For boxplots (f), data are shown as median (center line), box (25th and 75th percentiles), whiskers (nonoutlier minimum and maximum) and outliers (>1.5 interquartile range). ***P < 0.001. See also Extended Data Figs. 7–9, Supplementary Videos 3 and 4 and Supplementary Tables 5–9. PSTH, peri-stimulus time histograms. Source data
Fig. 5
Fig. 5. Sexually dimorphic stress sensitivity in Esr1+ LHA–LHb neurons.
a, Experimental design for retrograde viral labeling of LHA–LHb neurons (left), and TeLC silencing of Esr1+ LHA–LHb neurons using intersectional strategy (right). See Extended Data Fig. 6c for alternative retrograde TeLC strategy. b, Animal cohorts used in behavioral phenotyping. Ctl mice (both sexes) were subjected to viral injection (a, left). Ctl stress mice (both sexes) were subjected to the same viral injection (a, left) and thereafter subjected to the stress paradigm. Mice (both sexes) with TeLC silencing of Esr1+ LHA–LHb neurons (Esr1:TeLC stress) were subjected to the stress paradigm. The plots in e and f show combined data of TeLC silencing experiments with the intersectional (a, right) and with the retrograde strategy (Extended Data Fig. 6c). ce, Behavioral phenotyping 24 h after ending of the stress paradigm. Three-dimensional scatter plots summarizing total time aversive behavior in the looming stimuli test (y axis), immobility in the FST (x axis) and marble burying (z axis). Data points, colored and sized by the SI. Ctl (c), nmice = 15 male, 16 female mice; Ctl stress (d), nmice = 12 male, 12 female mice and Esr1:TeLC stress (e), nmice = 12 male, 13 female mice. f, Quantification of the SI. The stress paradigm significantly increased the SI in female mice (Ctl versus Ctl stress female mice, P = 2.39 × 10−8, one-way ANOVA with Tukey’s Multiple comparisons test). Female mice with TeLC silencing of Esr1+ LHA–LHb neurons displayed significantly reduced SI (Ctl stress females versus Esr1:TeLC stress females, P = 0.0016, one-way ANOVA with Tukey’s multiple comparisons test). Same mice as in ce. gl, Electrophysiological characterization of intrinsic properties of Esr1+ LHA–LHb neurons in stressed and control female and male mice (retrogradely labeled LHA–LHb neurons as in Extended Data Fig. 10l). g, Representative cell-attached traces of significantly increased tonic firing of Esr1+ Burst type neurons and decreased tonic firing of Esr1+ RS-N type neurons in stressed female and male mice (top). Quantification of the mean firing rate, Burst type neurons—Ctl stress female (nneuron = 15) versus Ctl female (nneuron = 14), P = 0.0; Ctl stress male (nneuron = 15) versus Ctl male (nneuron = 18), P = 0.0044; RS-N type neurons—Ctl stress female (nneuron = 17) versus Ctl female (nneuron = 16), P = 0.0; Ctl stress male (nneuron = 17) versus Ctl male (nneuron = 20), P = 0.0002; two-sided DABEST test, mean ± s.d.; bottom. h, Quantification of the stress-induced change in the tonic firing frequency of Esr1+ Burst type (left) and Esr1+ RS-N type (right) neurons in female and male mice. The difference in firing between Ctl and Ctl stress females (pink) and Ctl and Ctl stress males (blue) is plotted. i, Representative rheobase APs of Burst type Esr1+ neurons. Quantified in k, colors as in g. j, Representative firing patterns of Burst type Esr1+ neurons at maximal depolarization. Quantified in l, colors as in g. k, The AP duration of Esr1+ Burst type neurons is significantly decreased in stressed females. Quantification of the AP duration, Burst type neurons—Ctl stress female (nneuron = 15) versus Ctl female (nneuron = 18), P = 0.0; two-sided DABEST test, mean ± s.d. RS-N type neurons—Ctl stress male, nneuron = 22; Ctl male, nneuron = 56; Ctl stress female, nneuron = 22 and Ctl female, nneuron = 36. l, The maximal firing frequency of Esr1+ Burst type neurons is significantly increased in stressed females. Quantification of the maximal firing frequency—Ctl stress versus Ctl female mice, P = 0.0, two-sided DABEST test, mean ± s.d., same neurons as i (k). n = number of neurons, N = number of mice. Data acquired in male versus female mice as stated in respective panel. For boxplots (f), data shown as median (center line), box (25th and 75th percentiles), whiskers (nonoutlier minimum and maximum) and outliers (>1.5 interquartile range). Modified Gardner–Altman plots (h,k,l), distribution of bootstrap-sampled mean differences (area—pink, Ctl stress female versus Ctl female; blue, Ctl stress male versus Ctl male), mean of bootstrap sampling distribution of (circle) and the 95% CI (vertical black line). **P < 0.01, ***P < 0.001. See also Extended Data Fig. 10, Supplementary Video 5 and Supplementary Table 10. Source data
Extended Data Fig. 1
Extended Data Fig. 1. In vivo and ex vivo electrophysiology of LHA-LHb neurons.
(a) Representative image of retrobeads injected into the LHb. (b) Volume-density distribution of retrobead labeled LHA-LHb neurons (n = 5883, N = 7 wt). (c) Representative images of retrobeads (pink) in retrogradely labeled LHA-LHb neurons. Left: epifluorescence (patch-clamp set-up), right: confocal. (d) Schematic of patch-clamp recordings of retrobead-labeled LHA-LHb neurons. (e) Experimental design for opto-tagging (Neuropixels) of LHA-LHb neurons in awake head-fixed mice. (f) Left: schematic illustration of Neuropixels probe dyed with DiO (green), LHA-LHb neurons expressing ChR2-mCherry (red), and light application (light blue). Right: image of DiO labeled probe track (green) and ChR2-mCherry expressing neurons (red). (g) 3D rendering of the tracked anatomical position of five Neuropixels probes in the LHA. (h) The spontaneous firing frequency (color coded) of recorded LHA-LHb units (n = 165 units; N = 5 Vglut2-cre mice). (i) Peri-stimulus histogram for an example light-activated (opto-tagged) LHA-LHb unit relative to light stimulus (blue). Inset: spontaneous (black) and light-evoked (yellow) spike waveforms. (j) Top: 25 min recording of an example opto-tagged, tonically active LHA-LHb unit. Turquoise: raw firing rate, black: z-scored firing rate. Bottom: average, z-scored firing rates of opto-tagged, tonically active LHA-LHb units (n = 9, N = 9 Vglut2-cre mice). (k) Example firing patterns (current clamp) of the six identified LHA-LHb neuron types. Upper two rows: response at rheobase; lower two rows: response at double rheobase. (l) Average of inter-spike interval (ISI) immediate frequencies from whole-cell firing patterns at 2X Rheo and at Max (mean ± SD). Same neurons as in Fig. 1b. (m) Example responses to hyperpolarizing current injections (n = 8 for each neuron type). Insert: firing frequency as the average of the 200 ms firing before (B) and after (A) hyperpolarization. Dashed horizontal line: hyperpolarization activated depolarization or “Sag-potential”. Same neurons as in Fig. 1b. (n) Hive plots of AP- and firing-related parameters for the six identified LHA-LHb neuron types (mean ± SD, n = 230 neurons, N = 46 mice). (o) t-SNE plot of LHA-LHb neuron types classified by electrophysiology. Color code: expert classification. (p) Comparison of neuronal identity by expert classification, hierarchical clustering, graph-based clustering, and consensus clustering. Gray: lack of agreement. Consensus clustering: the agreement between hierarchical and graph-based unbiased analyses. (q) Correspondence of the three clustering approaches (hierarchical clustering, graph-based clustering, and consensus clustering) and the randomly shuffled data of each clustering with the expert classification. n = number of neurons, N = number of animals. Abbreviations: Globus pallidus internus (GPi), fornix (fx), All data acquired in male mice. Scale bars: 100 μm (a), 10 μm (c), 150 μm (f). Source data
Extended Data Fig. 2
Extended Data Fig. 2. Anatomical, morphological, and genetic characterization of electrophysiologically recorded LHA-LHb neurons.
(a) Left: AP range of tissue used for whole-cell patch-clamp recordings. (b) Right: landmarks in the vicinity of the LHA used for mapping of the AP origin of coronal sections used for whole-cell patch-clamp recordings of LHA-LHb neurons: mammillary tract (blue), fornix (green), zona incerta (yellow). Top: coronal anatomical plates (Allen Brain Atlas CCFv2) at different AP coordinates. Bottom: DIC image of a corresponding ex vivo brain slice and a recording electrode. The relative DV and ML position of mmt, fx, and ZI was used to identify the AP position of the brain slice. (c) Confocal image of three representative biocytin filled LHA-LHb neurons. Left: Pseudo-coloring of the soma. Right: the soma outlines (dashed line) were detected in the orthogonal projection of confocal z-stack. (d) Outline of the workflow for soma morphometry. The elliptical score (X/Y ratio, magenta lines) and the triangular score (Y1/Y2 ratio, turquoise lines) were used for classification of soma as triangular, elongated, or round, respectively. (e) Representative soma shapes (biocytin filled) of the six identified LHA-LHb neuron types. (f) t-SNE plot of the parameters established by soma morphometry. Color code: expert classification. FA-Bk: n = 16, Burst: n = 12, RS-N: n = 14, LS-N: n = 11, LS-W: n = 9, RS-W: n = 5 LHA-LHb neurons, N = 17 wt mice. (g) Quantification of the soma area (top, same neurons as in (f)) and total dendritic length (bottom, FA-Bk: n = 8, Burst: n = 10, RS-N: n = 12, LS-N: n = 8, LS-W: n = 8, RS-W: n = 5. N = 19 wt mice). (h) Quantification of the total number of dendrites (top) and the number of primary dendrites (bottom). FA-Bk: n = 10, Burst: n = 11, RS-N: n = 16, LS-N: n = 10, LS-W: n = 8, RS-W: n = 5. (i) Sholl analysis (number of intersections) of reconstructed neurons highlights the cell-type specific complexity of the dendritic trees of LHA-LHb neuron types, mean ± s.e.m. Violet vertical bar: median of the critical radius, turquoise vertical bar: median of the enclosing radius, gray horizontal bar: 95 percentile. Same neurons as in (g), bottom. (j) Number of detected genes in the Patch-seq LHA-LHb neurons (n = 163, same neurons as in Fig. 2b-d). Average: 6245 genes/neuron. (k) Representative examples of Agilent Bioanalyzer traces of cDNA amplicons of mRNA samples from single Patch-seq harvested LHA-LHb neurons. Top: successful sample (included in data), bottom: failed sample (discarded), ~10% of samples were discarded. (l) UMAP plot showing identity of neurons based on gene expression from Patch-seq, identifying three clusters of LHA-LHb neurons, n = 163, same neurons as in Fig. 2b-d, color code as in Fig. 2b, right. (m) Heat-map of marker genes in the electrophysiologically defined LHA-LHb neuron types (same as in Fig. 2d) before thresholding. Colored dots: genetic markers employed for subsequent cell-type specific targeting. (n) bar plot showing expression of selected marker genes before and after thresholding. (o) t-SNE plot for Patch-seq LHA-LHb neurons (n = 163 sequenced neurons, N = 46 wt mice, same neurons as in Figs. 1–2). Expression of single markers genes visualized in separate t-SNE plots. (p-r) UMAP plot showing Patch-seq data projected onto the Rossi dataset (LHA neurons projecting to LHb only), color coded by dataset (p), Seurat generated cluster using gene expression only (q) and cell types defined by electrophysiological properties of the Patch-seq dataset (r). (s) UMAP plots showing expression of LHA-LHb subtype candidate markers identified by Patch-seq on the merged dataset. All data acquired in male mice. For boxplots (g-h), data shown as median (center line), box (25th and 75th percentiles), whiskers (nonoutlier minimum and maximum) and outliers (>1.5 interquartile range). Scale bars: 50 μm (a, top), 25 μm (a, bottom left), 10 μm (a, bottom right), 10 μm (c), 10 μm (e). n = number of neurons, N = number of animals. Abbreviations: mammillary tract (mmt), zona incerta (ZI), fornix (fx), #A70C4 (along all S2B) codes for patched cell ID: A-(animal number) and C-(cell number), and Uniform Manifold Approximation and Projection (UMAP). Source data
Extended Data Fig. 3
Extended Data Fig. 3. Genetic targeting of LHA-LHb pathways.
(a) Representative confocal images of cre-dependent anterograde labeling of LHA-LHb neurons in Pv-cre, Esr1-cre, Npy-cre, and Gal-cre mice, respectively. Inserts: representative examples of cell-type specific soma morphologies. (b) Anatomical plates (Allen Brain Atlas CCFv2) of the LHb and neighboring structures along the AP range. (c) Outline of the workflow for anatomical mapping of axon terminals. (d) Experimental design for cell-type specific retrograde labeling of LHA-LHb neurons. (e) Top: representative confocal images of retrogradely labeled neurons in the LHA. Insert: representative examples of cell-type specific soma morphologies. Bottom: quantification of the labeled soma along the AP axis (mean ± s.e.m; Pv:ChR2: N = 5, Esr1:ChR2: N = 12, Npy:ChR2: N = 13). (f) Quantification of retrogradely labeled LHA-LHb neurons (same mice as in (e) + Vglut2:ChR2: N = 10. (g) Experimental design for rabies tracing. The helper virus AAV-DIO-TVA-V5-RG was injected in the LHA, and the EnvA-coated rabies virus (RV-eGFP) in the LHb. (h) Representative confocal image of LHA-LHb neurons co-expressing RV-eGFP (green) and V5 (magenta; Esr1-cre mouse). Arrow head: RV-eGFP+/V5+ neuron (quantified), empty arrow head: RV-eGFP-/V5+ neuron (not quantified). (i, j) Quantification of RV-eGFP+/V5+ LHA-LHb neurons Pv-cre, Gal-cre: N = 4, Esr1-cre: N = 5, Npy-cre: N = 3. (i) total number, (j) the proportion (average) RV-eGFP+/V5+ LHA neurons in each genotype, of all RV-eGFP+/V5+ labeled LHA neurons detected across the genotypes. Pv-cre, Gal-cre: N = 4; Npy-cre: N = 3; Esr1-cre: N = 5 mice. (k) Anatomical plates (Allen Brain Atlas CCFv2) of the LHA along the AP axis with the position of detected RV-eGFP+/V5+ LHA-LHb neurons. One dot = one neuron. Each plate depicts neurons detected in two consecutive brain sections (50 μm) from a representative mouse. (l) Topography of the projection field and the soma location of the LHA-LHb pathways along the AP axis. From top to bottom: bar plots with the proportion axon terminals in the LHb (anterograde viral strategy, Pv-cre: N = 3, Esr1-cre: N = 5, Npy-cre: N = 4, Gal-cre: N = 4 mice); soma in the LHA (retrograde viral strategy, Pv-cre: N = 5, Esr1-cre: N = 12, Npy-cre: N = 13); soma in the LHA (rabies tracing, Pv-cre: N = 4, Esr1-cre: N = 5, Npy-cre: N = 3, Gal-cre: N = 4); neurons in the LHA (Patch-seq, FA-Bk: n = 12, Burst + RS-N: n = 77, LS-N: n = 35, LS-W: n = 28). N = number of animals. Abbreviations: Globus pallidus internal (GPi), fornix (fx), medial habenula (MHb) and zona incerta (ZI), medial habenula (MHb), stria medullaris (sm), and third ventricle (V3). For boxplots (f, i), data shown as median (center line), box (25th and 75th percentiles), whiskers (nonoutlier minimum and maximum) and outliers (>1.5 interquartile range). Scale bars: 200 μm (a, e), inset 10 μm (a, e), 10 μm (h). Source data
Extended Data Fig. 4
Extended Data Fig. 4. Characterization of distinct LHA-LHb neuron types.
(a) Anterograde (left) and retrograde (right) viral labeling of the Esr1+ LHA-LHb pathway in the Esr1-cre mice. (b) ESR1 protein expression (green) was confirmed by IHC in retrogradely labeled LHA-LHb neurons (magenta) in Esr1-cre mice. Orange box: location of right panel. (c) Retrograde viral labeling of Esr1+ LHA-LHb neurons with consecutive whole-cell patch-clamp characterization of labeled neurons exclusively identified RS-N (n = 10) and Burst (n = 13) type neurons, corroborating the detection of Esr1 in the Patch-seq transcriptome of these neuron types. N = 4 Esr1-cre mice. Retrograde viral labeling of the LHA-LHb pathway in Npy-cre and Pv-cre mice, respectively, with consecutive whole-cell patch-clamp characterization of labeled neurons exclusively identified LS-N type LHA-LHb neurons (n = 19) in Npy-cre mice (N = 3), and FA-Bk type LHA-LHb neurons (n = 12) in PV-cre mice (N = 3), confirming the validity of the experimental strategy for cell type specific targeting of LHA-LHb pathways. (d) Representative confocal images along the AP axis (left to right) of the hypothalamic area with retrograde viral labeling (magenta) of the LHA-LHb pathway in Esr1-cre mice. (e) Top: same images as in (d), here with detection of ESRα protein expression (IHC; green). Orange box: location of panel in bottom row. Bottom: close-up of box in top. (f-g) Left: representative confocal images of virally labeled (magenta) LHA-LHb axon terminals in the LHb of a Npy-cre mouse (f) and a Gal-cre mouse (g), confirming expression of the neuropeptide Y (white) in the LHA-LHb axon terminals in Npy-cre mice, and expression of galanin (white) in the LHA-LHb axon terminals in Gal-cre mice. Yellow/orange box: location of right panel. Right: close-up of box in left. All data acquired in male mice. Scale bars: 1 mm (a), 10 μm (b, f, left), 200 μm (d), 50 μm (e, bottom), 20 μm (f, left), 2 μm (f, center and right), 20 μm (g, left), 2 μm (g, center and right). n = number of neurons, N = number of animals. Abbreviations: Globus pallidus internal (GPi), paraventricular hypothalamic nucleus (PVH), ventromedial hypothalamic nucleus (VMH), ventromedial hypothalamic nucleus, ventrolateral part (VMHvl).
Extended Data Fig. 5
Extended Data Fig. 5. Confirmation of the position of optical fibers, and overview of experimental timelines.
(a) The location of the tip of the optical fibers across the experiments, visualized across the AP axis of coronal anatomical plates (Allen Brain Atlas CCFv2). Top: position of the tip of optical fibers in experiments with optogenetic stimulation of LHA-LHb axon terminals in the LHb. Bottom: position of the tip of optical fibers in experiments with somatic optogenetic stimulation of LHA-LHb neurons in the LHA. Colored dots: individual mice and their respective bilateral optical fiber location. *) mice subjected to Neuropixels recordings, #) mice subjected to TeLC silencing. (b) Schematic overview of the experimental timeline for the different cohorts of mice. N = number of mice.
Extended Data Fig. 6
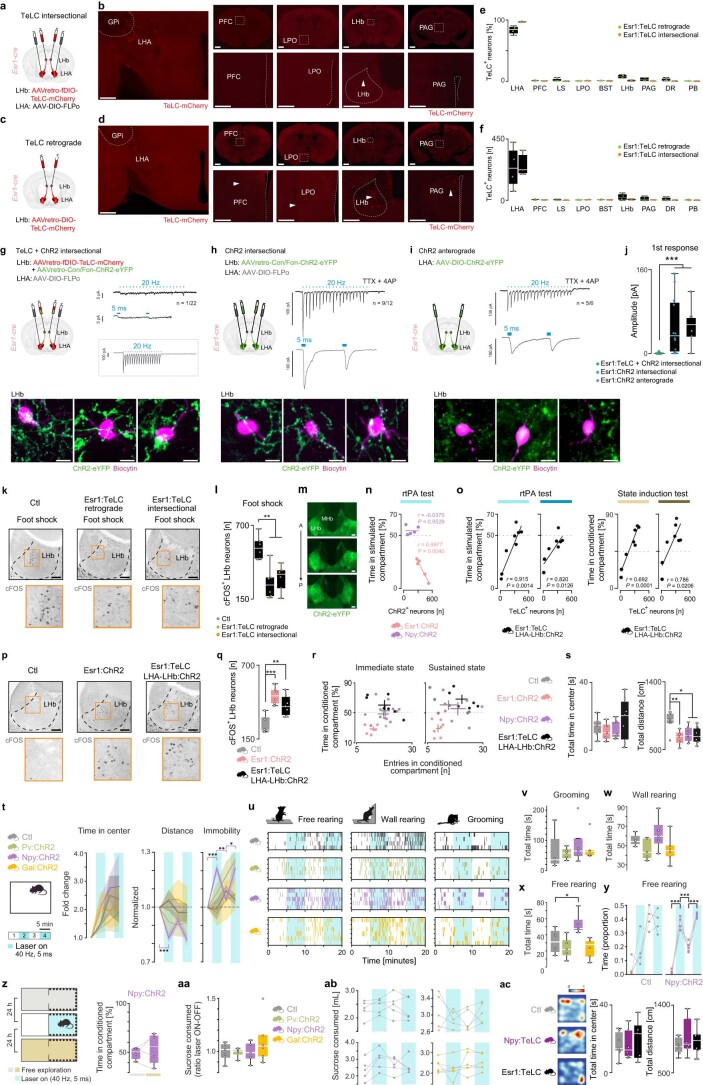
Extended Data Fig. 6. Validation of the TeLC silencing approaches, and optogenetic manipulation or TeLC silencing of LHA-LHb pathways during behavior.
(a) Experimental design of the intersectional approach for TeLC silencing of LHA-LHb neurons. (b) Representative confocal images of TeLC labeled LHb projecting neurons (red) in the LHA and potential off-target brain regions in a Esr1-cre mouse for the TeLC intersectional approach. (c) Experimental design of the retrograde approach for TeLC silencing of Esr1+ LHA-LHb neurons. (d) Representative confocal images of TeLC labeled neuron (red) LHb projecting neurons (red) in the LHA and potential off-target brain regions in a Esr1-cre mouse for the TeLC retrograde approach. (e-f) Quantification of LHb projecting neurons expressing TeLC-mCherry in the LHA and potential off-target regions in Esr1-cre mice. (e) The distribution of TeLC-mCherry+ neurons in different brain regions, plotted as the percentage of the total number of TeLC-mCherry+ neurons in individual mice. (f) The number of TeLC-mCherry+ neurons in different brain regions. Green dots: mice with TeLC retrograde approach (N = 4 mice), orange dots: mice with TeLC intersectional approach (N = 3 mice). (g) Electrophysiological ex vivo validation of the silencing of Esr1+ LHA-LHb neurons. Left: experimental design of the intersectional viral approach for combined TeLC silencing and ChR2-expression in Esr1+ LHA-LHb neurons. Right: whole-cell recordings of LHb neurons with light delivery (1 s, 5 ms pulses, 20 Hz) in the LHb validated the absence of light-evoked synaptic responses upon TeLC silencing of Esr1+ LHA-LHb neurons. Top: representative light-evoked response in a LHb neuron (synaptic response in 1/22 LHb neuron). Middle: close-up of trace in top, showing the two first responses to light stimulation. Box: Representative light-evoked response of a TeLC + /ChR2+ neuron in the LHA. Bottom images: representative confocal images of whole-cell recorded biocytin (magenta) filled LHb neurons showing ChR2-eYPF+ (green) axon terminals from Esr1+ LHA-LHb neurons. (h) Left: experimental design of the intersectional viral approach for expression of ChR2 in Esr1+ LHA-LHb axon terminals. Right: whole-cell recordings of LHb neurons concurrent with light application (1 s, 5 ms pulses, 20 Hz) in the LHb confirmed reliable synaptic responses in LHb neurons, validating the experimental strategy. Top: representative light-evoked response in a LHb neuron (synaptic response in 9/12 LHb neurons). Bottom: close-up of trace in top, showing the two first responses to light stimulation. Bottom images: representative confocal images of whole-cell recorded biocytin (magenta) filled LHb neurons showing ChR2-eYPF+ (green) axon terminals from Esr1+ LHA-LHb neurons. (i) Left: experimental design of the anterograde viral approach for expression of ChR2 in Esr1+ LHA-LHb axon terminals. Right: whole-cell recordings of LHb neurons concurrent with light application (1 s, 5 ms pulses, 20 Hz) in the LHb confirmed reliable synaptic responses in LHb neurons, validating the experimental strategy. Top: representative light-evoked response in a LHb neuron (synaptic response in 5/6 LHb neurons). Bottom: close-up of trace in top, showing the two first responses to light stimulation. Bottom images: representative confocal images of whole-cell recorded biocytin (magenta) filled LHb neurons showing ChR2-eYPF+ (green) axon terminals from Esr1+ LHA-LHb neurons. (j) Average amplitude of the first light-evoked synaptic response for all the whole-cell recorded LHb neurons in (g-i). TeLC + ChR2 intersectional vs ChR2 intersectional, p = 8.2E-5; TeLC ChR2 intersectional vs ChR2 anterograde, p = 4.1E-7, two-sided unpaired t-test. Colored dots: viral approach employed. Green dots: Esr1:TeLC + ChR2 intersectional: n = 22, blue dots: Esr1:ChR2 intersectional: n = 12, gray dots: Esr1:ChR2 anterograde: n = 6. (k-l) TeLC expression significantly reduced the expression of cFOS in response to foot shock. Representative confocal images (k) and quantification (l) of cFOS+ neurons in the LHb in response to foot shock in control mice and mice with TeLC silencing of Esr1+ LHA-LHb neurons, respectively. Two different approaches were used for TeLC mediated silencing. (l) Ctl vs Esr1:TeLC retrograde, p = 0.0014; Ctl vs Esr1:TeLC intersectional, p = 0.0016, two-sided unpaired t-test, N = 6 for each the three group of mice. (m) Representative confocal images of the LHb region along the AP axis, showing ChR2-eYFP+ (green) LHA-LHb axon terminals in a Esr1-cre mouse subjected to the Esr1:TeLC + entire LHA-LHb pathway ChR2 stimulation. (n) The relationship (two-sided Pearson correlation coefficient) between the number of ChR2+ neurons and the time spent (%) in the stimulated compartment in the rtPA. (o) The relationship (two-sided Pearson correlation coefficient) between the number of TeLC+ neurons and the time spent (%) in the stimulated compartment in the rtPA (left), or the conditioned compartment in the cPA (right). (p-q) Representative confocal images (p) and quantification (q) of cFOS+ neurons in the LHb in response to optogenetic stimulation of Esr1+ LHA-LHb axons terminal in mice with TeLC silencing (Esr1:TeLC LHA-LHb ChR2 mice) or without TeLC silencing (Esr1:ChR2 mice) of Esr1+ LHA-LHb neurons. Ctl vs Esr1:ChR2, p = 4.76E-4; Ctl vs Esr1:TeLC LHA-LHb ChR2, p = 0.0086, two-sided unpaired t-test. Ctl: N = 5, Esr1:ChR2: N = 6, Esr1:TeLC LHA-LHb ChR2: N = 7 mice. (r) Optogenetic activation of Esr1+ LHA-LHb axon terminals (Esr:ChR2 mice) reduces both the time spent and the number of entries into the conditioned compartment. Ctl, Esr1:ChR2, Esr1:TeLC LHA-LHb ChR2: N = 6 mice, Npy:ChR2: N = 7 mice, same mice as in Fig. 3j-k. (s) Open field. Continuous optogenetic activation (10 min, 40 Hz, 5 ms, 1 s on – 1 s off) of LHA-LHb axon terminals significantly decreased the distance traveled in Esr1:ChR2, Npy:ChR2, and Esr1:TeLC LHA-LHb ChR2 mice compared to Ctl mice (right, Ctl vs Esr1:ChR2, p = 9.1E-3; Ctl vs Npy:ChR2, p = 0.0172; Ctl vs Esr1:TeLC LHA-LHb ChR2, p = 0.0114, two-sided unpaired t-test), while the time spent in the center was not affected (left). Ctl, Esr1:ChR2, Esr1:TeLC LHA-LHb ChR2: N = 6 mice, Npy:ChR2: N = 7 mice, same mice as in (r) and in Fig. 3j-k. (t) Open field. Block wise optogenetic activation (20 min total, 4 ×5 min blocks, 40 Hz, 5 ms) of the axon terminals of the Pv+, Npy+, or Gal+ LHA-LHb pathway, respectively, did not affect the time spent in the center of an open field. The time spent in the center in each block, plotted as fold change compared to block 1 (mean ± s.e.m, two-sided t-test pairwise comparison of each block to the previous). Optogenetic activation of the axon terminals of the Npy+ LHA-LHb pathway significantly decreased the distance traveled in the open field (Npy:ChR2 block 1 vs block 2, p < 0.001, two-sided t-test pairwise comparison of each block to the previous). This effect was also apparent as significantly increased immobility (block 2 vs1, p < 0.001; block 3 vs 2, p = 0.0043; block 4 vs 3, p = 0.038, two-sided t-test pairwise comparison of each block to the previous). No significant effects on locomotion were observed in responses to activation of the Pv+ and Gal+ LHA-LHb pathways, respectively (two-sided t-test pairwise comparison of each block to the previous). Ctl: N = 4 mice, Pv:ChR2 and Npy:ChR2: N = 5 mice, Gal:ChR2: N = 6 mice. (u-x) Scoring of free rearing, wall rearing, and grooming in the open field in response to block wise optogenetic activation of the axon terminals of the Pv+, Npy+, or Gal+ LHA-LHb pathway, respectively. Ctl: N = 4 mice, Pv:ChR2 and Npy:ChR2: N = 5 mice, Gal:ChR2: N = 6 mice, same animals as in (t). 1 colored coded vertical bar = 1 s in a specific behavior. (x) Optogenetic activation of the axon terminals of the Npy+ LHA-LHb pathway significantly increased the total time spent free rearing (Npy:ChR2 vs Ctl, p = 0.0493, two-sided unpaired t-test. Ctl: N = 4 mice, Npy:ChR2: N = 5 mice, same mice as in Fig. 3k. (y) Quantification of proportion time free rearing in blocks with (blue) and without (white) light activation, respectively. Optogenetic activation of the axon terminals of the Npy+ LHA-LHb pathway significantly increased the proportion time spent free rearing (block 2 vs 1, p = 2.55E-7; block 3 vs 2, p = 1.91E-4; block 4 vs 3, p = 8.93E-7, two-sided t-test pairwise comparison of each block to the previous). Same mice as in Fig. 3k. (z) Left: schematic outline of the experimental design for conditioned place aversion. Optogenetic activation (10 min) of the axon terminals of the Npy+ LHA-LHb pathway did not induce avoidance of the conditioned compartment (right, two-sided unpaired t-test). Gray horizontal bar: before conditioning, gold horizontal bar: after conditioning. N = 4 Npy:ChR2 mice. (aa-ab) Sucrose consumption test, with block wise optogenetic activation (as in (t)). Optogenetic activation of the axon terminals of the Pv+, Npy+, or Gal+ LHA-LHb pathway, respectively, did not alter sucrose consumption (two-sided unpaired t-test). (aa) The ratio of the sucrose consumed in blocks with (ON) vs blocks without (OFF) light application. (ab) Sucrose consumed in the individual blocks. Ctl, Pv:ChR2, Npy:ChR2, Gal:ChR2: N = 5 mice. (ac) TeLC silencing of Npy+ LHA-LHb neurons or Esr1+ LHA-LHb neurons did not alter behavior in the open field (two-sided unpaired t-test. TeLC intersectional approach, see panel (a)). Left: heatmaps of example locomotion (10 min). Right: quantification of total time in center, and total distance, respectively. Ctl: N = 7, Npy:TeLC, Esr1:TeLC: N = 6 mice. n = number of neurons, N = number of animals. Abbreviations: real-time place aversion (rtPA), conditioned place aversion (cPA). All data acquired in male mice. For boxplots (e-f, j, l, q, s, v-x, z-aa, ac), data shown as median (center line), box (25th and 75th percentiles), whiskers (nonoutlier minimum and maximum) and outliers (>1.5 interquartile range). Scale bars: 1 mm (b, top, d, top), 500 μm (b, left, d left), 200 μm (b, bottom, d bottom), 100 μm (k, m, o), 10 μm (g-i), * p < 0.05, **p < 0.01, ***p < 0.001. Source data
Extended Data Fig. 7
Extended Data Fig. 7. Prefrontal neuronal activity and behavioral response following optogenetic activation of the different LHA-LHb pathways.
(a) Trial-averaged firing rate (z-scored) for all individual units recorded across the mPFC subregions; Ctl: n = 1147, N = 5; Vglut2:ChR2: n = 1413, N = 5; Npy:ChR2: n = 981, N = 5, Esr1:ChR2: n = 611, N = 10). Colored dots: block specific events; black: sound 1, blue: optogenetic stimulation, gray: sound 2, orange: air puffs. The units are sorted based on their location within a specific mPFC subregion (outlined by horizontal black lines), and their respective peak response latency in block 1. (b) Average population firing across the mPFC subregions in (part of) block 2. The detected latency of the onset of the optogenetic responses is indicated with green vertical lines. White vertical line; onset of optogenetic stimulation. Bin size: 10 ms. (c) As (b), but detected latency of the onset of the sound response in block 1. White vertical line; sound onset. (d) As (b), but detected latency of the onset of the air puff response in block 4. White vertical line; air puff onset. (e) Example pupil tracking using DeepLabCut, light green dots: eye markers, pink dots: pupil markers. (f) Extracted traces of normalized eye area (top) and normalized pupil area (bottom), colors as in (e). (g) Quantification of the number of eye closing events (two-sided Wilcoxon signed ranked test with Bonferoni correction (alpha corrected= 0.0083). Ctl, Npy:ChR2, and Vglut2-:ChR2 mice: N = 5, respectively; Esr1:ChR2: N = 10 mice. p-values: Esr1:Chr2: p = 0.0059; Vglut2:ChR2: p = 0.0078; Ctl: p = 0.002; Npy:ChR2: p = 0.002). (h) Eye area over the course of block 4 for each genotype (Ctl, Vglut2:ChR2, Npy:ChR2: N = 5, Esr1:ChR2: N = 10 mice). (i) Heatmaps of the mean pupil area (z-scored to block 1) across the individual trials in block 1-3, Ctl, Vglut2:ChR2, Npy:ChR2: N = 5, Esr1:ChR2: N = 10 mice. Colored dots: block specific events; black: sound 1, blue: optogenetic stimulation. (j) Mean trial-averaged pupil area (z-scored to block 1) for all individual trials from block 1-3, same trials and mice as in (g). One circle = one trial, block1: n = 50, 2: n = 100, 3: n = 50 trials. Black vertical lines: block limits. Red horizontal lines: mean pupil area in the block. Two-sided Mann-Whitney U test with Bonferroni correction (alpha corrected=0.017), p-values (block1vs2; block1vs3; block2vs3 respectively): Esr1:ChR2: p = 3.09E-14; p = 1.45E-12; p = 0.01; Vglut2:ChR2: p = 1.55E-11; p = 1.15E-8; p = 0.68; Ctl:ChR2: p = 0.12; p = 0.23; p = 0.59; Npy:ChR2: p = 0.035; p = 1.91E-8; p = 9.61E -15). n = number of units, N = number of animals. Abbreviations: medial prefrontal cortex (mPFC), anterior cingulate area, dorsal part (ACAd), prelimbic area (PL), infralimbic area (ILA) and orbitofrontal area, medial part (ORBm), peri-stimulus time histogram (PSTH), standard deviation (SD). For boxplots (g), data shown as median (center line), box (25th and 75th percentiles), whiskers (nonoutlier minimum and maximum) and outliers (>1.5 interquartile range). All data acquired in male mice. * p < 0.05, *** p < 0.001. Source data
Extended Data Fig. 8
Extended Data Fig. 8. Tuning of mPFC units to sound, LHA-LHb pathway stimulation, and air puffs.
(a) Tuning scores for all units in Ctl mice (N = 5) fitted with the GLM (n = 482). The tuning to sound 1 (pure tone) is shown. Black curve: tuning scores expected by chance. (b) Pie charts of the proportions of primary tuning for all units fitted with the GLM. Ctl: n = 482; Vglut2:ChR2: n = 738; Npy:ChR2: n = 406, Esr1:ChR2: n = 319 units. (c) Example ILA unit in an Esr1:ChR2 mouse, significantly tuned to the optogenetic stimulation. From left to right: raster plot aligned to the onset of the sound; mean waveform during (blue) or outside of (black) light application on 10 neighboring recording channels; peri-stimulus-time-histogram (PSTH) aligned to the onset of the sound; auto-correlogram (ACG; bin size: 1 ms). Colored dots: block specific events; black: sound 1, blue: optogenetic stimulation, blue vertical lines: light pulses (5 ms). (d) Example PL unit in an Esr1:ChR2 mouse, significantly tuned to sound 1 (pure tone; block 1-3). Top: PSTHs, bottom: raster plots of 50 trials. Colored dots: block specific events; black: sound 1, blue: optogenetic stimulation, gray: sound 2, orange: air puffs. (e) As (d) but for an example PL unit in an Esr1:ChR2 mouse significantly tuned to air puffs (block 4). (f) Scatterplots of the tuning of all units fitted with the GLM (n = 1945) in response to optogenetic stimulation (y axis) vs sound 1 (pure tone; y axis). One dot = one unit. Units significantly tuned to optogenetic stimulation are color coded (standard deviation from the null distribution). Gray units: non-significant tuning. (g) As (f) but for sound 2 (blue noise) vs air puffs. Units significantly tuned to air puffs are color coded (standard deviation from the null distribution). Gray dots: units without significant tuning. (h) Distribution of the peak to through duration for all recorded mPFC units (n = 4152, N = 25). Units with narrow waveform (peak to through < 0.38 ms) were classified as narrow spiking units (NS, orange) and units with wide waveform (peak to through duration > 0.44 ms) as wide spiking (WS, green) units. (i) Mean waveform of the WS (green trace) and NS (orange trace) units, respectively. Gray traces: waveforms of 100 randomly picked units/cell type. All waveforms are peak normalized. (j-m) Left: scatterplots of the tuning of all WS (green) and NS (orange) units fitted with the GLM (Table 7 and 8) in response to optogenetic stimulation (x axis) vs air puffs (y axis) for Esr1:ChR2 (j), Vglu2:ChR2 (k), Ctl (l), and Npy:ChR2 mice (m), respectively. One circle = one unit. Right: The mean tuning scores of the significantly tuned units, showing the mean negative and mean positive tuning scores, respectively. Right, detail of the tuning scores (postive and negative tuning scores, All units: black, WS: green, NS: orange) for sound1, optogenetic stimulation, sound2 and air puff for each genotype. (n) Response profile of example PL unit in an Esr1:ChR2 mouse, across block 1-3. Top: PSTH, bottom: raster, both with color-coding of the trial progression within the blocks (lighter to darker, 10 trials/color). Colored dots: block specific events; black: sound 1, blue: optogenetic stimulation; vertical black lines: event onset. Bin size: 10 ms. (o) The fraction of conditioned units. Conditioned units displayed significantly (Wilcoxon signed rank-test) increased or decreased response to the sound and optogenetic manipulation in block 2 (top) or to the sound and air puffs in block 4 (bottom) over the trials within the respective block. (p) Mean response profile of the conditioned units that over the trials displayed significantly increased response to the sound in block 2. Mean of the first (light color) and last (dark color) 10 trials in block 2 are shown. Colored dots: block specific events; black: sound 1, blue: optogenetic stimulation, vertical black lines: event onset. Bin size: 10 ms. (q) As (p) but for the units that over the trials displayed significantly decreased response to the sound in block 2. (r) The primary and secondary tunings (to sound 1, optogenetic stimulation, sound 2, or air puff respectively), and the optogenetic/air puff co-modulation for all units fitted with the GLM (n = 1945). The units are grouped based on genotypes. Red bar: number of co-modulated units expected by chance. n = number of units, Ctl, VGlut2:ChR2, Npy:ChR2: N = 5, Esr1:ChR2: N = 10 mice in all panels with group data. All data acquired in male mice. For boxplots (j, k, l, m), data shown as median (center line), box (25th and 75th percentiles), whiskers (nonoutlier minimum and maximum) and outliers (>1.5 interquartile range). Source data
Extended Data Fig. 9
Extended Data Fig. 9. Prefrontal population dynamics in response to air puffs or optogenetic stimulation of distinct LHA-LHb pathways.
(a) Trajectories of the neuronal population activity (trial averaged) in block 1-4; the first three principal components (PC) are shown. (b-g) Left: Trial-averaged baseline (the 1 s preceding sound onset, n = 50 trials) firing rate (z-scored) in block 1-4 for all individual units in specific clusters (bin size 10 ms, see also Fig. 4h). The units are sorted as in Fig. 4h. Right: mean baseline firing rate in block 1-4, respectively. SD (error bar) and significance level (tow-sided Wilcoxon signed-ranked test with Bonferroni correction). (b), ‘Opto’ cluster #1 (n = 65 units), (c) ‘Opto’ cluster #2 (n = 93 units), (d) ‘State’ cluster #1 (n = 195 units), (e) ‘State’ cluster #2 (n = 128 units), (b) ‘State’ cluster #3 (n = 253 units), (g) ‘State’ cluster #4 (n = 150 units). h. Schematic outline of the task events used to calculate the activity modes. i. mPFC neuronal population activity in the four blocks projected in 3D onto the three activity modes (state, sound, and aversive AND signal; N = 25 mice). j. The mPFC neuronal population activity in the four blocks (1-4, color coded, bin size: 10 ms) projected in 1D onto the Sound mode. Colored dots: block specific events; black: sound 1, blue: optogenetic stimulation, gray: sound 2, orange: air puffs. Vertical lines: event onset. See also Fig. 4h. (k) as (j) but with projection on the ‘opto AND air puff’ mode. (l) Detailed investigation of the sound mode; involvement of mPFC subregions and LHA-LHb pathways. Difference of neuronal population activity between block 1 and 2, projected onto the sound mode; bin size: 50 ms. Colored dots: block specific events; black: sound 1, blue: optogenetic stimulation; Vertical lines: event onset. (m) as (l) but with projection on the ‘aversive AND signal’ mode. (n) Decoding (average prediction accuracy) of block identity (block 1 vs 2) using baseline activity in the ACAd, ILA, and ORBm. Accuracy is plotted as a function of the number of units included in the logistic regression. Mean ± SD: 50 repeated cross-validations. Dashed line: 50% chance performance. (o) Top: decoding (average prediction accuracy) of block identity (block 1 vs 3) using baseline activity in the ACAd, PL, ILA, and ORBm. Accuracy is plotted as a function of the number of units included in the logistic regression. Mean ± SD: 50 repeated cross-validations. Dashed line: 50% chance performance. Bottom: as top, but block 1 vs 4. (p) Fraction of significantly tuned units across the mPFC subregions in response to optogenetic stimulation in Vlut2:ChR2 mice (left). Mean difference of the projection of the ‘state mode’ between block 1 vs block 2 across the mPFC subregions (middle). Difference in decoding (average prediction accuracy) of block identity (block 1 vs 2) in Vlut2:ChR2 vs Ctl mice (right). AP = 1.90 mm, Allen reference atlas CCFv3. (q-r) As (p), but for Ctl (q), and Npy:ChR2 mice (r). (s) Fraction of units across the mPFC subregions in Vglut2-cre mice with significant tuning to sound 1(left), sound 2 (middle), and air puffs (right). (t-v) As (s), but for Ctl (t), Npy:ChR2 (u), and Esr1:ChR2 (v) mice. n = number of units, N = number of animals. All data acquired in male mice. For boxplots (b-g), data shown as median (center line), box (25th and 75th percentiles), whiskers (nonoutlier minimum and maximum) and outliers (>1.5 interquartile range).* p < 0.05, **p < 0.01, ***p < 0.001. Source data
Extended Data Fig. 10
Extended Data Fig. 10. Aversive behaviors, behavioral stress response, and ex vivo electrophysiological characterization of baseline properties of Esr1+ LHA-LHb neurons in male and female mice.
(a) Animal cohorts used in behavioral phenotyping (top), and the viral strategy for TeLC silencing of Esr1+ LHA-LHb neurons (bottom). (b) Fear conditioning. Left: TeLC silencing of Esr1+ LHA-LHb neurons significantly reduced the total time freezing during fear conditioning extinction both in male and female mice (male Esr1:TeLC vs Ctl male, p = 0.0163; Esr1:TeLC female vs female Ctl, p = 0.0028, one-way ANOVA with Tukey’s Multiple comparisons test. Ctl: N = 6 male mice, 6 female mice, Esr1:TeLC: N = 14 male mice, 13 female mice). Right: the relationship (Pearson correlation coefficient) between the total time spent freezing during fear conditioning extinction and the number of TeLC+ neurons for male (gray) and female (black) mice, respectively. (c) Acoustic startle test. Left: TeLC silencing of Esr1+ LHA-LHb neurons significantly reduced the total time spent immobile induced by the presentation of a novel tone in female mice (one-way ANOVA with Tukey’s Multiple comparisons test, Ctl male vs Ctl female, p = 0.0029; Esr1:TeLC female vs Ctl female, p = 2.3E-4). Right: relationship (Pearson correlation coefficient) between the immobility during the acoustic startle test and the number of TeLC+ neurons for male (gray) and female (black) mice, respectively. Same mice as in (b). (d) Looming stimuli test. Left: TeLC silencing of Esr1+ LHA-LHb neurons in female mice significantly reduced the time spent in aversive behaviors (Ctl female vs Esr1:TeLC female, p = 0.0013, one-way ANOVA with Tukey’s Multiple comparisons test. Ctl: N = 15 male mice, 16 female mice, Esr1:TeLC: N = 14 male mice, 13 female mice). Right: relationship (right, Pearson correlation coefficient) between the time spent in aversive behaviors and the number of TeLC+ neurons for male (gray) and female (black) mice, respectively. (e) Animal cohorts used for baseline phenotyping in the looming stimuli test (top), and the viral strategy for TeLC silencing of Npy+ LHA-LHb neurons (bottom). (f) TeLC silencing of Npy+ LHA-LHb neurons did not influence the time spent in aversive behaviors in the looming stimuli test. Npy:TeLC: N = 6 male mice, 5 female mice, Ctl: N = 15 males mice, 16 female mice (same Ctl mice as in (e)). (g) Experimental design and animal cohorts used for behavioral phenotyping and ex vivo electrophysiological recordings. (h-j) Behavioral phenotyping 24 h after ending of the stress paradigm (see also Fig. 5c). Ctl: N = 15 male, 16 female, Ctl stress: N = 12 male mice, 12 female mice; Esr1:TeLC stress: N = 12 male mice, 13 female mice; all mice same as in Fig. 5c-f. One-way ANOVA with Tukey’s Multiple comparisons for all statistics. Right: the relationship (Pearson correlation coefficient) between the number of TeLC+ neurons and behavioral variables for male (gray) and female (black) mice, respectively. (h) Marble burying test: Ctl female vs Ctl stress female: p = 8.94E-4; Ctl stress female vs Esr1:TeLC stress female: p = 1.83E-13. (i) Looming stimuli test: Ctl male vs Ctl female: p = 0.0062; Ctl stress female vs Ctl female: p = 6.41E-6; Ctl stress female vs Esr1:TeLC stress female: p = 1.22E-6. (j) Forced swim test: Ctl stress female vs Ctl female: p = 7.86E-4; Ctl stress female vs Esr1:TeLC stress female: p = 0.0254. (k) Experimental design for retrograde labeling Esr1+ LHA-LHb neurons used for ex vivo electrophysiological recordings. (l) Representative baseline whole-cell firing traces at rheobase (top), whole-cell firing patterns at maximal depolarization (bottom) of Burst type Esr1+ LHA-LHb neurons in male (blue; n = 37 neurons) and female (pink; n = 18 neurons). (m) No significance difference in AP duration and maximal firing frequency of Burst type neurons were found between male (n = 37) and female (n = 18) mice (DABEST test). (n) Representative cell-attached baseline tonic firing traces of Burst type Esr1+ LHA-LHb neurons in male (blue) and female (pink) mice. (o) No significance difference in tonic firing frequency of Burst type neurons were found between male (n = 18) and female (n = 14) mice (DABEST test). (p) Representative baseline whole-cell firing traces at rheobase (top), whole-cell firing patterns at maximal depolarization (bottom) of RS-N type Esr1+ LHA-LHb neurons in male (blue) and female (pink) mice. (q) No significance difference in AP duration of RS-N type neurons were found between male and female mice, while neurons in female mice displayed a significant higher maximal firing frequency than male mice (female vs male mice, p = 0.0004, DABEST test). Female mice: n = 57, male mice: n = 34. (r) Representative cell-attached baseline tonic firing traces of RS-N type Esr1+ LHA-LHb neurons in male (blue) and female (pink) mice. (s) No significance difference in tonic firing frequency of RS-N type neurons were found between male (n = 20) and female (n = 16) mice (DABEST test). n = number of neurons, N = number of animals. The data acquired in male and female mice as indicated in panel. For boxplots (b-f, h-j), data shown as median (center line), box (25th and 75th percentiles), whiskers (nonoutlier minimum and maximum) and outliers (>1.5 interquartile range). *p < 0.05, **p < 0.01, ***p < 0.001. Source data

References

    1. Tye KM. Neural circuit motifs in valence processing. Neuron. 2018;100:436–452. doi: 10.1016/j.neuron.2018.10.001. - DOI - PMC - PubMed
    1. Russo SJ, Nestler EJ. The brain reward circuitry in mood disorders. Nat. Rev. Neurosci. 2013;14:609–625. doi: 10.1038/nrn3381. - DOI - PMC - PubMed
    1. Dixon ML, Thiruchselvam R, Todd R, Christoff K. Emotion and the prefrontal cortex: an integrative review. Psychol. Bull. 2017;143:1033–1081. doi: 10.1037/bul0000096. - DOI - PubMed
    1. Dalley JW, Cardinal RN, Robbins TW. Prefrontal executive and cognitive functions in rodents: neural and neurochemical substrates. Neurosci. Biobehav. Rev. 2004;28:771–784. doi: 10.1016/j.neubiorev.2004.09.006. - DOI - PubMed
    1. Hikosaka O, Sesack SR, Lecourtier L, Shepard PD. Habenula: crossroad between the basal ganglia and the limbic system. J. Neurosci. 2008;28:11825–11829. doi: 10.1523/JNEUROSCI.3463-08.2008. - DOI - PMC - PubMed

Publication types