. 2023 Jul;4(7):1036-1052.
doi: 10.1038/s43018-023-00576-1. Epub 2023 Jun 22.

High-plex immunofluorescence imaging and traditional histology of the same tissue section for discovering image-based biomarkers

Affiliations

High-plex immunofluorescence imaging and traditional histology of the same tissue section for discovering image-based biomarkers

Jia-Ren Lin et al. Nat Cancer. 2023 Jul.

Abstract

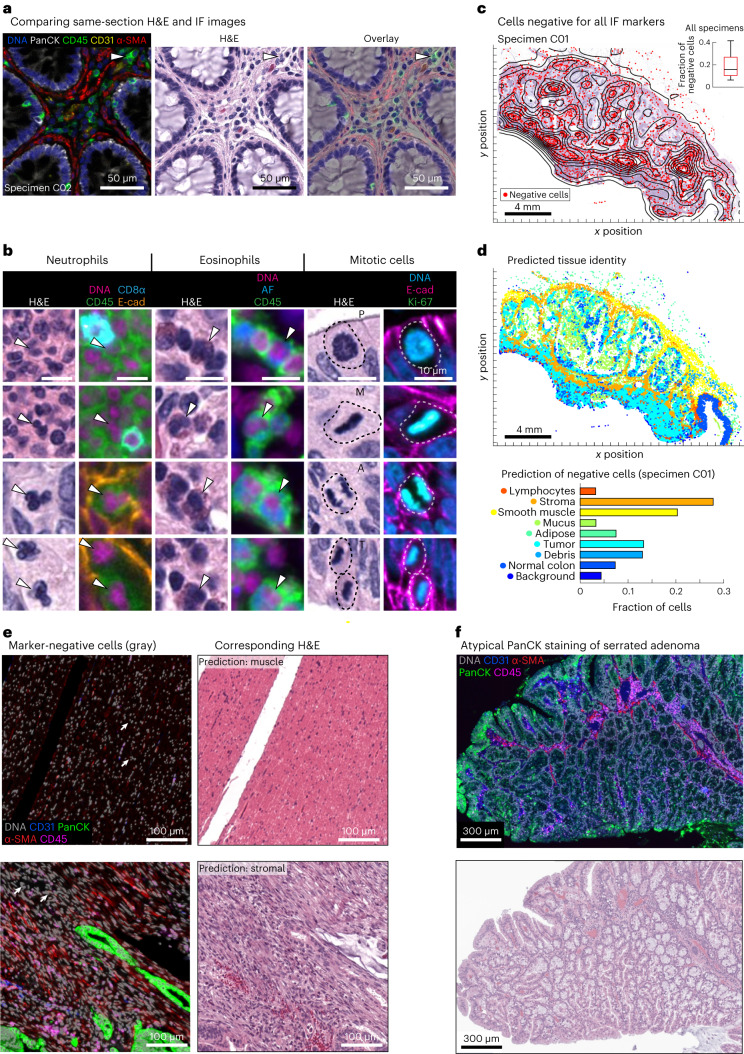
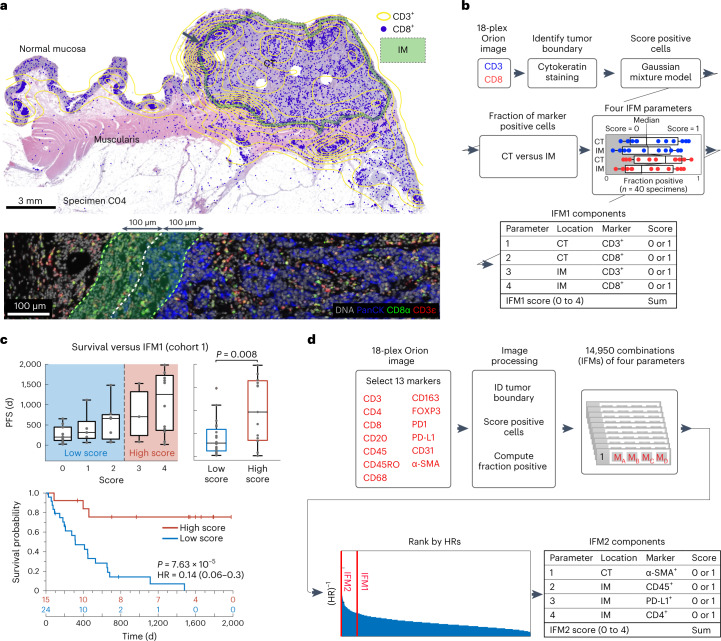
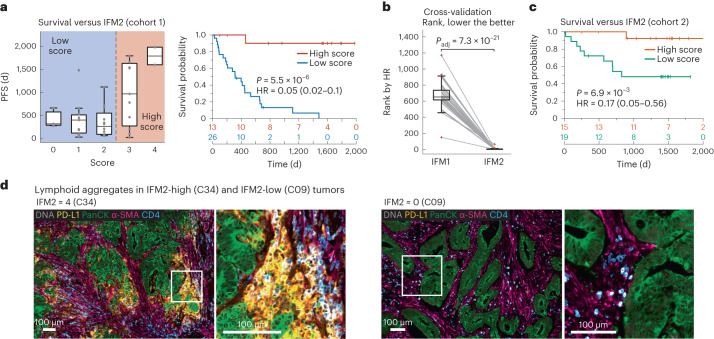
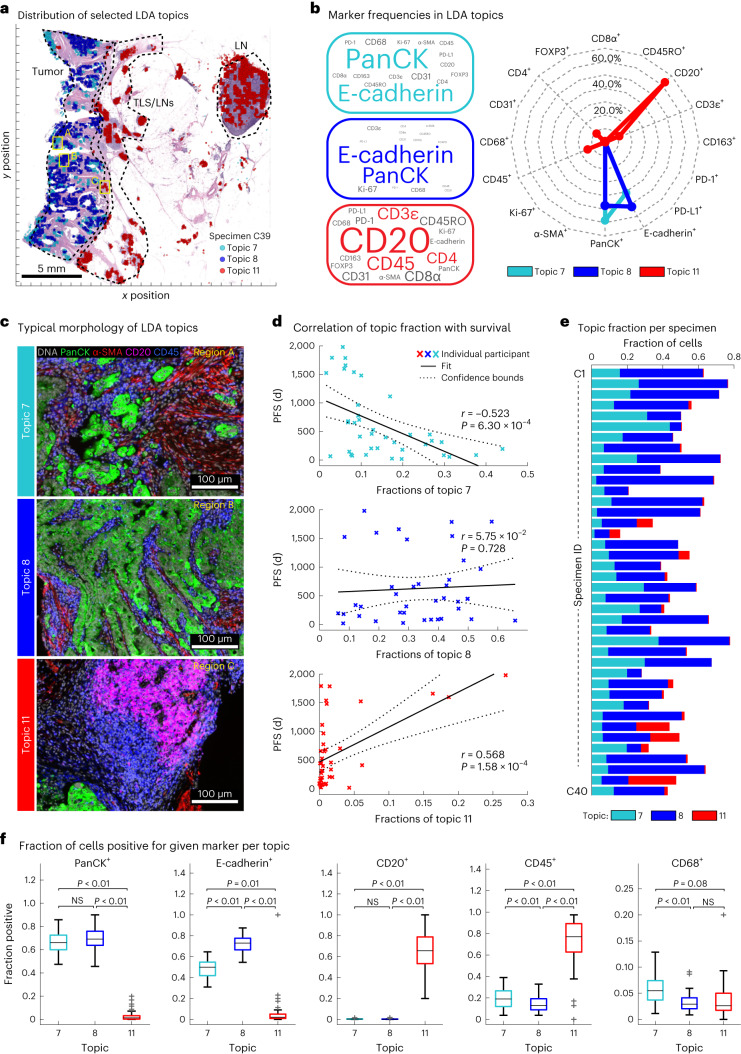
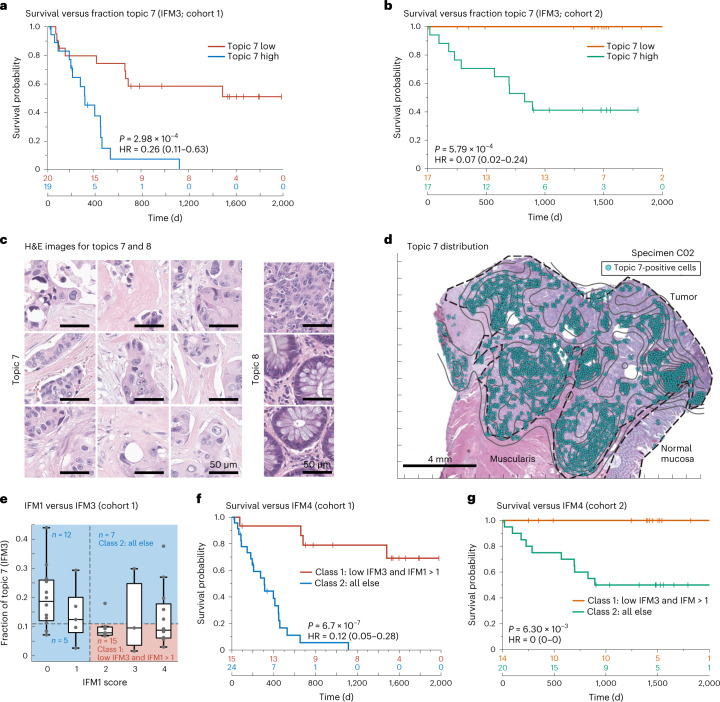
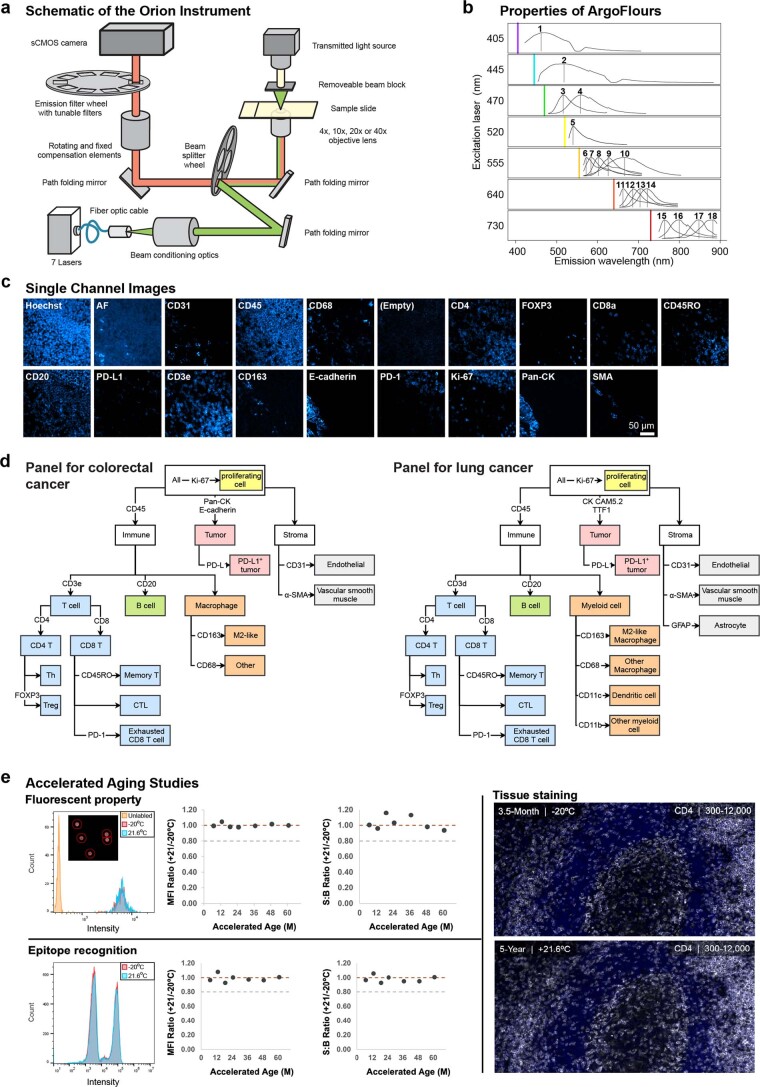
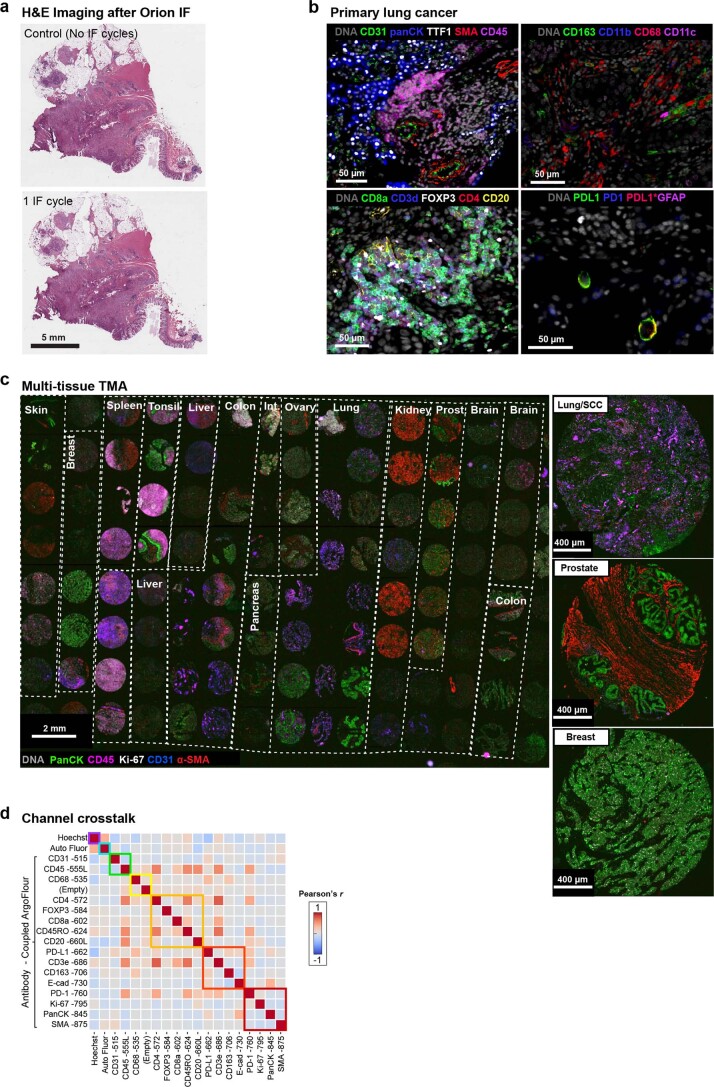
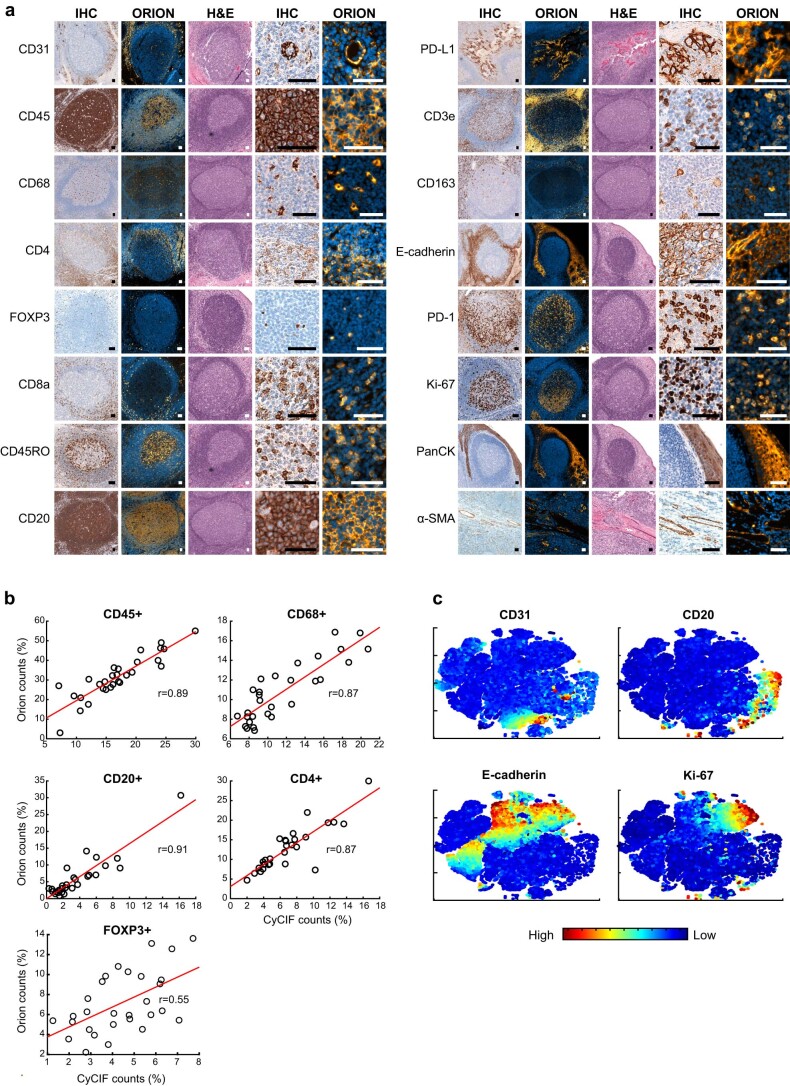
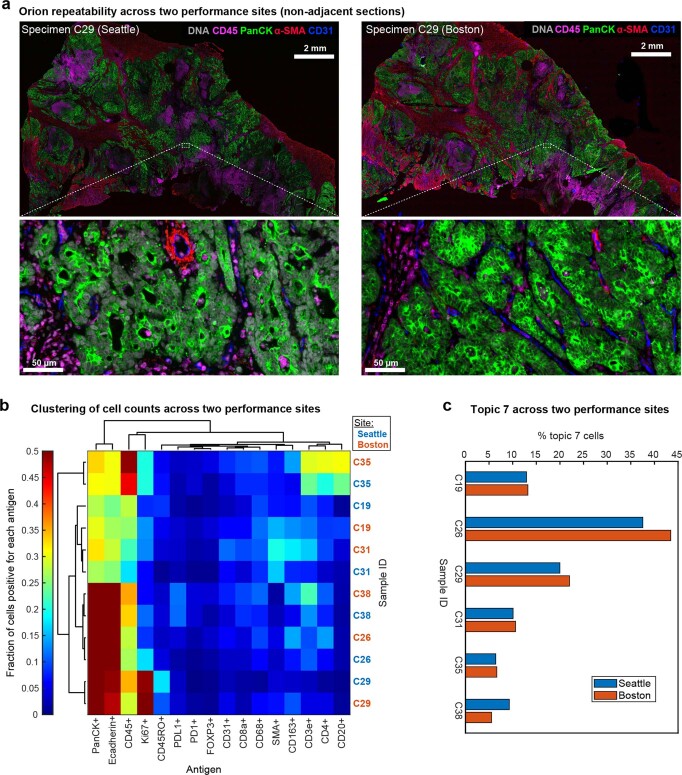
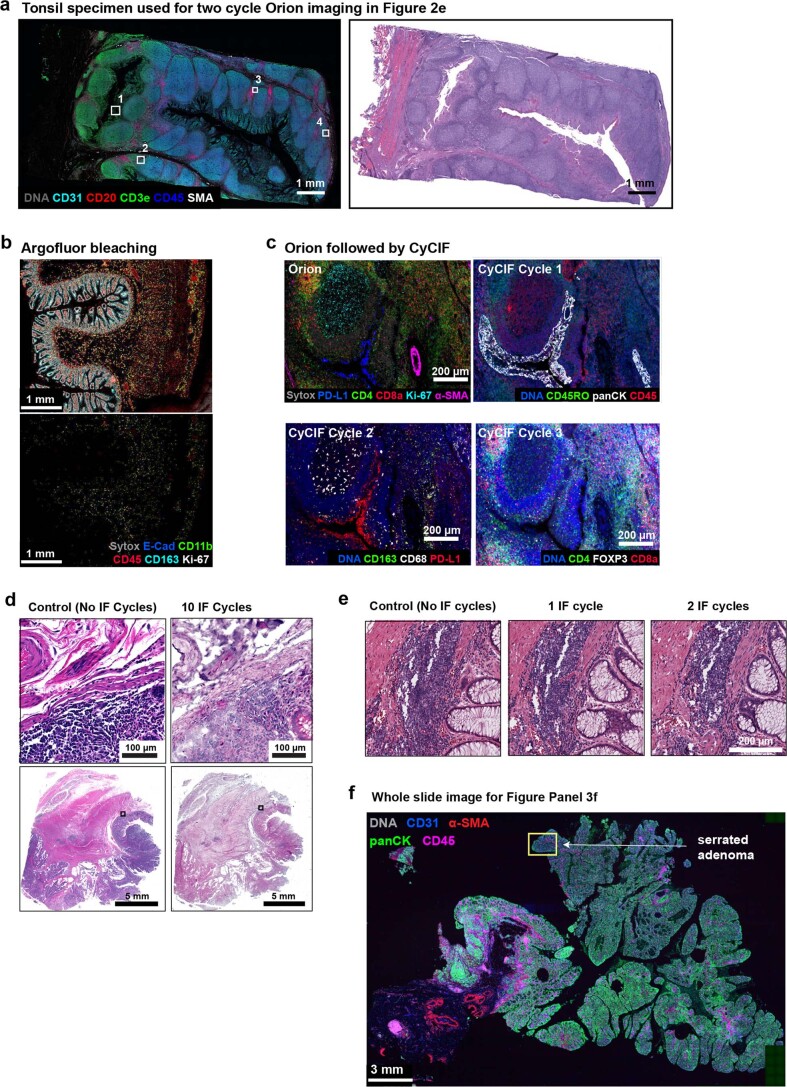
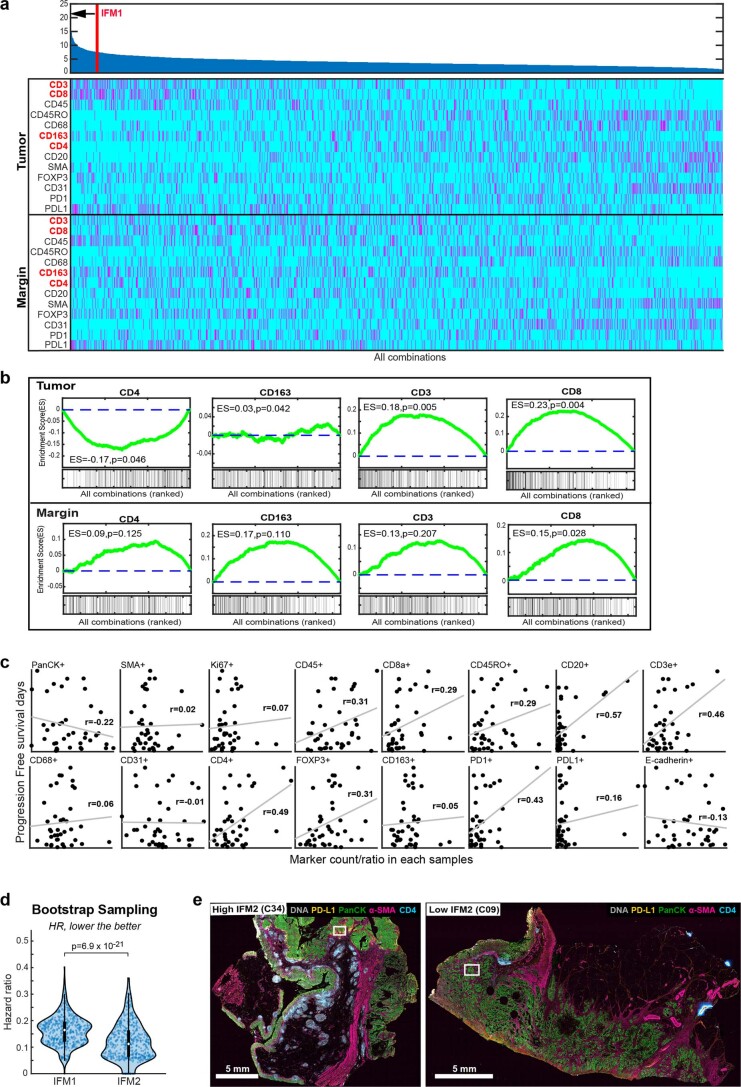
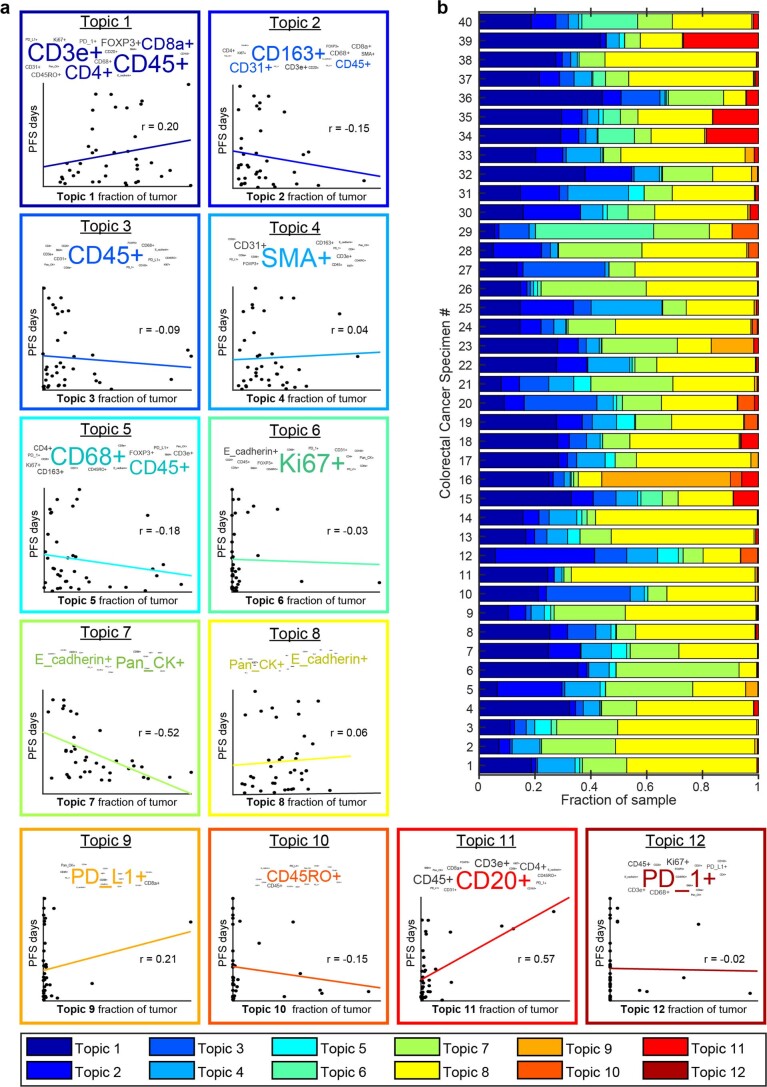
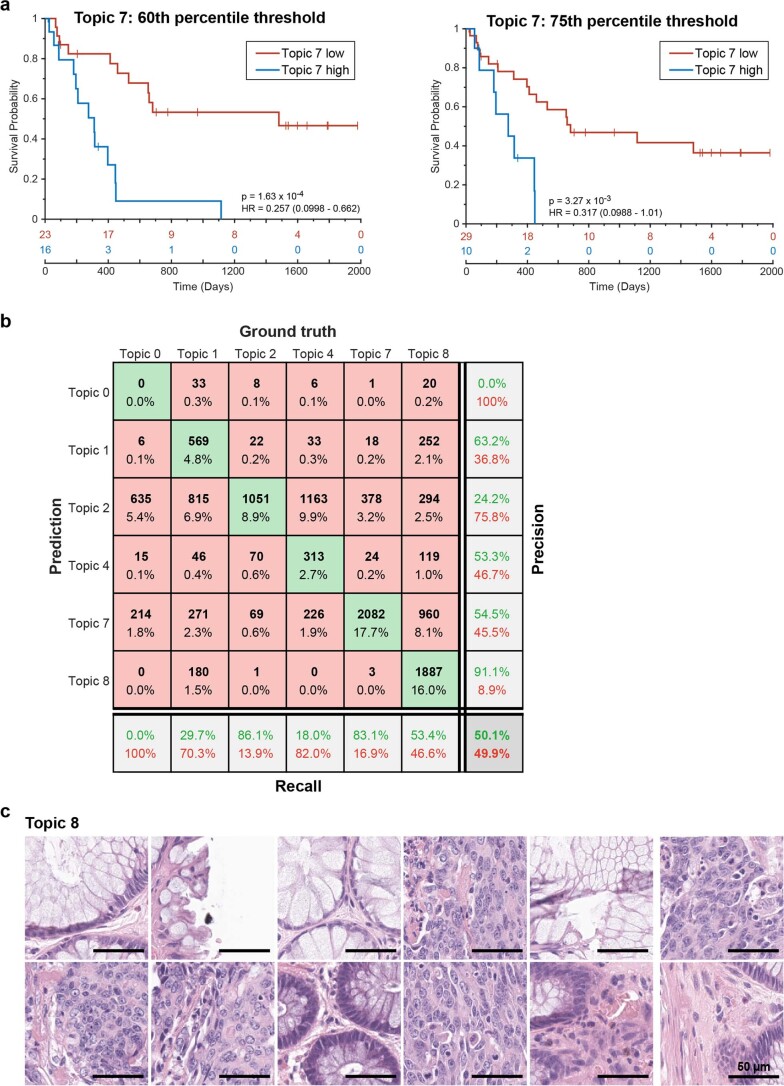
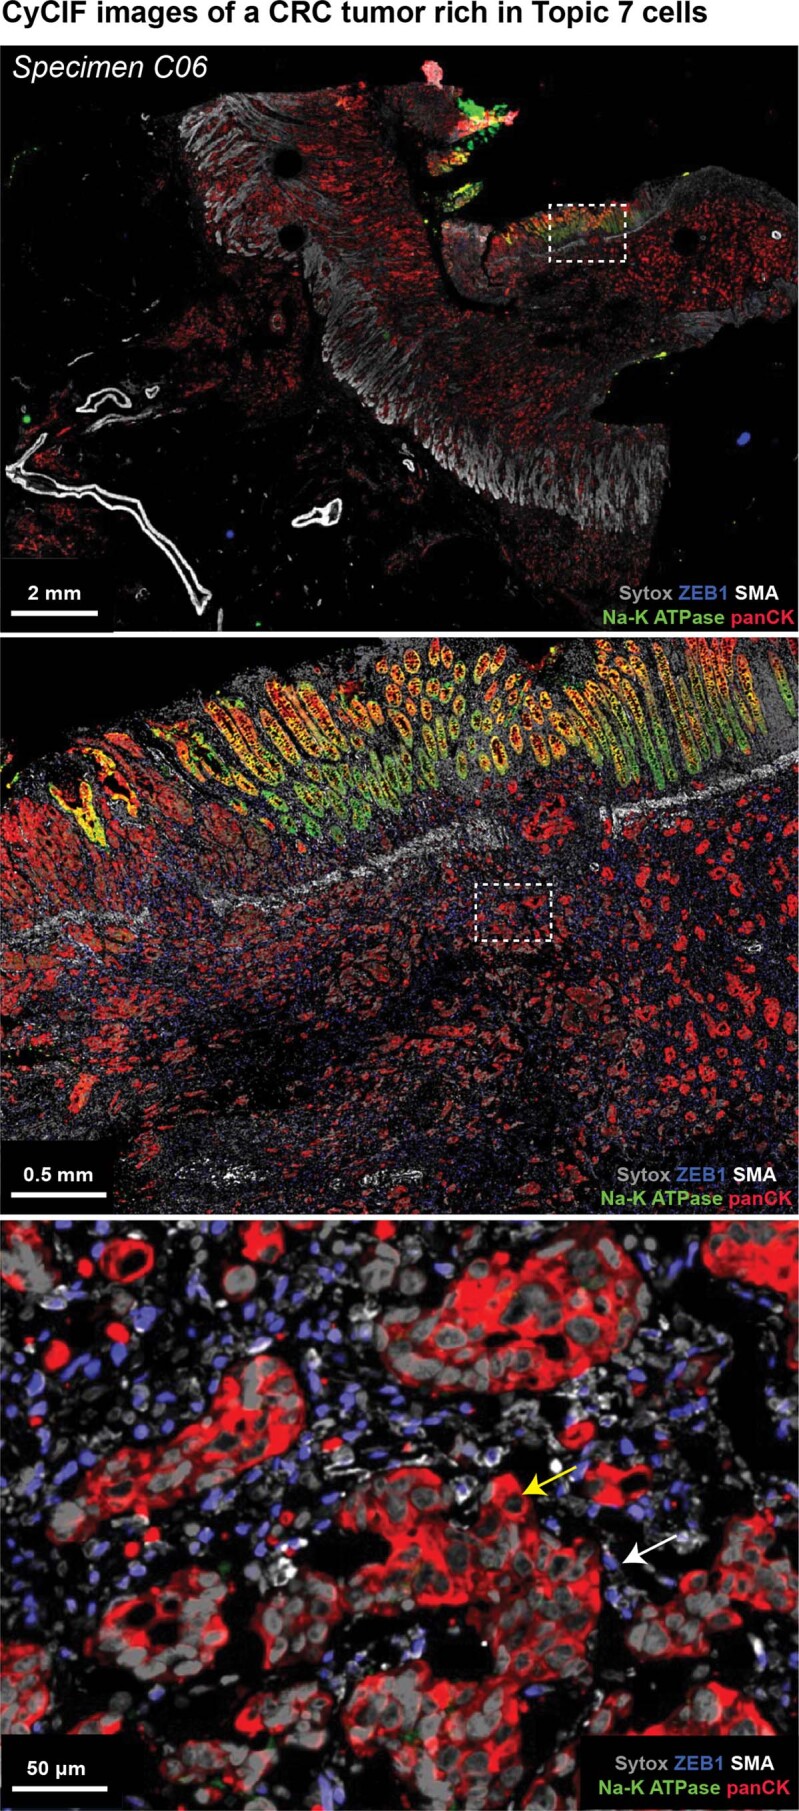
Precision medicine is critically dependent on better methods for diagnosing and staging disease and predicting drug response. Histopathology using hematoxylin and eosin (H&E)-stained tissue (not genomics) remains the primary diagnostic method in cancer. Recently developed highly multiplexed tissue imaging methods promise to enhance research studies and clinical practice with precise, spatially resolved single-cell data. Here, we describe the 'Orion' platform for collecting H&E and high-plex immunofluorescence images from the same cells in a whole-slide format suitable for diagnosis. Using a retrospective cohort of 74 colorectal cancer resections, we show that immunofluorescence and H&E images provide human experts and machine learning algorithms with complementary information that can be used to generate interpretable, multiplexed image-based models predictive of progression-free survival. Combining models of immune infiltration and tumor-intrinsic features achieves a 10- to 20-fold discrimination between rapid and slow (or no) progression, demonstrating the ability of multimodal tissue imaging to generate high-performance biomarkers.


Conflict of interest statement

P.K.S. is a cofounder and member of the Board of Directors of Glencoe Software, a member of the Board of Directors for Applied Biomath and a member of the Scientific Advisory Board for RareCyte, NanoString and Montai Health; he holds equity in Glencoe, Applied Biomath and RareCyte. P.K.S. is a consultant for Merck, and the Sorger lab has received research funding from Novartis and Merck in the past 5 years. Y.-A.C. is a consultant for RareCyte. D.C., J.C., E.M., S.R. and T.G. are employees of RareCyte. S.J.R. receives research support from Bristol Myers Squibb and KITE/Gilead. S.J.R. is on the Scientific Advisory Board for Immunitas Therapeutics. K.L.L. reports the following relationships: research support to DFCI from Bristol Myers Squibb and consulting fees from Bristol Myers Squibb, Integragen, Blaze Biosciences and Travera, Inc. K.L.L. is also an equity holder and Founder of Travera, Inc. The other authors declare no competing interests.

Figures

Fig. 1
Fig. 1. Same-section IF and H&E using the Orion platform.
a, Schematic of one-shot 16- to 20-channel multiplexed IF imaging with the Orion method followed by H&E staining of the same section using an automated slide stainer and scanning of the H&E-stained slide in transillumination (brightfield) mode. This method of discriminating the emission spectra of fluorophores is repeated using seven excitation lasers spaced across the spectrum (see Extended Data Fig. 1b and Methods). Using polychroic mirrors and tunable optical filters, emission spectra are extracted to discriminate up to 20 channels, including signal from fluorophore-labeled antibodies (15–19 in most experiments), the nuclear stain Hoechst 33342 and tissue-intrinsic autofluorescence (figure created with BioRender.com). b, Left, Orion multiplexed IF image showing CD31, α-SMA, Hoechst (DNA) and signal from the tissue autofluorescence channel; this image highlights an artery outside of the tumor region with red blood cells in the vessel lumen and elastic fibers in the internal and external elastic lamina of the vessel wall, numerous smaller vessels (arterioles) and stromal collagen fibers (the inset displays arterioles). Right, images of the H&E staining from the same tissue section (histologic landmarks are indicated). Images are from a single representative specimen (C18). c, Orion multiplexed IF image (showing CD45, pan-cytokeratin (PanCK), CD31 and α-SMA) from a whole-tissue FFPE section and matched H&E from the same section. Holes in the images are regions of tissue (‘cores’) removed in the construction of TMAs. Images are from a single representative specimen (C04). d, Zoom-in views of the regions indicated by arrowheads in c; marker combinations are indicated. The images are from a single representative specimen (C04). e, Intensities of fluorochromes (columns in heat maps) in each Orion channel (rows in heat maps) before (top) and after (bottom) spectral extraction. The extraction matrix was determined from control samples scanned using the same acquisition settings that were used for the full panel. The control samples included unstained lung tissue (for the autofluorescence channel), tonsil tissue stained with Hoechst and tonsil tissue stained in single plex with ArgoFluor conjugates used in the panel (for the biomarker channels). The values in each column were normalized to the maximum value in the column. Data were derived from a single pool (N = 1) of control beads. Source data
Fig. 2
Fig. 2. Qualifying the 16-plex single-shot Orion antibody panel.
a, Panels of images from FFPE tonsil sections showing single-antibody IHC for pan-cytokeratin, Ki-67, CD8α, CD163 and the matching channels extracted from 16-plex Orion IF images (the H&E stain was performed on the same section as the Orion imaging). Each image is from one representative specimen. For IHC/H&E, four serial sections were used from the same tonsil tissue; one additional section from the same sample was used for Orion. b, Orion IF images and CyCIF images from neighboring sections of an FFPE colorectal adenocarcinoma. The CyCIF images were collected using 2 × 2 binning, while Orion images were obtained with no binning. c, Plots of the fraction of cells positive for the indicated markers from whole-slide Orion IF and CyCIF images acquired from neighboring sections. Pearson correlation coefficients are indicated. d, t-SNE plots of cells segmented from an Orion IF image of an FFPE CRC specimen (C01) with inferred cells types (left) and the fluorescence intensities of selected markers (CD45, pan-cytokeratin, CD8α and α-SMA; right) overlaid on the plots as heat maps. The plots show a random sample of 50,000 cells. e, Orion images showing antibodies imaged across two cycles. Twenty-three of 29 antibodies are displayed across four marker groups from four different regions of interest (labeled ROI 1–4). Markers from cycle 2 are underlined. The locations of the four ROIs in the whole-slide image are shown in Extended Data Fig. 5a. Images are from one FFPE tonsil specimen/section; VIM, vimentin; Gr-B, granzyme B. Source data
Fig. 3
Fig. 3. Combined H&E and Orion to identify cell and tissue types.
a, Representative images of Orion IF and same-section H&E. All images are from one representative colorectal specimen (C02). b, Cell types not specifically identified by markers in the Orion panel but readily recognized in H&E images, including neutrophils, eosinophils and cells undergoing mitoses (selected cells of each type are denoted by arrowheads and dashed lines). Images are from three different representative colorectal specimens/sections (columns 1 and 2 are from C27/C04, columns 3 and 4 are from C04, and columns 5 and 6 are from C03); E-cad, E-cadherin; AF, autofluorescence; P, prophase; M, metaphase; A, anaphase; T, telophase. c, Spatial maps of the positions of cells (~15% of total cells) that were not detected by the Orion IF panel in a CRC specimen overlaid onto the corresponding H&E image (specimen C01); dots denote cells with identifiable nuclei but not subtyped using the antibody panel. Box and whisker plots show unidentifiable cells in cohort 1 (N = 40 specimens, C01–C40), the midline indicates the median, box limits indicate quartile 1 (25th percentile)/quartile 3 (75th percentile), and whiskers indicate 1.5× interquartile range (IQR). d, Top, spatial map of nine tissue classes determined from the H&E image using a CNN model for various cell types as indicated. Bottom, percentage of the total number of ‘unidentifiable’ (negative) cells assigned to a specific tissue class by the CNN applied to the H&E image. Data were derived from N = 1 representative specimen (C01). e, Example same-section Orion IF and H&E images from areas enriched for ‘non-detected’ cells; examples include areas predicted to be rich in stroma and smooth muscle. f, Orion IF and H&E images showing an area of serrated adenoma with low pan-cytokeratin expression (markers are as indicated). Whole-slide image indicating the location of this region is shown in Extended Data Fig. 5f. Images are from one colorectal specimen (C26). Source data
Fig. 4
Fig. 4. Recapitulating the Immunoscore tissue immune test using Orion images.
a, Map of CT and IM compartments overlaid on an H&E image with the density of CD3+ cells shown as a contour map and the positions of CD8+ T cells shown as dots. The arrow indicates the zoom-in image shown below. Bottom, selected channels from a portion of the Orion image spanning the invasive boundary (denoted by shaded overlay). Images were from one representative specimen/section (C04). b, Flow chart for the calculation of IFM1 that recapitulates key features of the Immunoscore test. c, Top, box-and-whisker plots for PFS for 40 individuals with CRC based on actual IFM1 scores where the midline indicates the median, box limits indicate quartile 1 (25th percentile)/quartile 3 (75th percentile), whiskers indicate 1.5× IQR, and dots indicate outliers (>1.5× IQR). Scores are stratified into two classes as follows: low, score of ≤2; high, score of 3 or 4 (pairwise two-tailed t-test P = 0.002). Bottom, Kaplan–Meier plots computed using IFM1 binary classes (HR, 95% CI and log-rank P value). d, Flow chart for calculation of additional models that use the underlying logic of Immunoscore but considering 13 markers. The image processing steps are the same as in a. The rank positions of IFM1 and IFM2 are shown relative to all other 14,950 combinations of parameters that were considered. Source data
Fig. 5
Fig. 5. Extending the Immunoscore test with additional immune features.
a, Left, box and whisker plots for PFS for 40 individuals with CRC based on IFM2 scores, where the midline indicates the median, box limits indicate quartile 1 (25th percentile)/quartile 3 (75th percentile), whiskers indicate 1.5× IQR, and dots indicate outliers (>1.5× IQR). Right, Kaplan–Meier plots for cohort 1 (N = 40 participants/specimens) computed using IFM2 binary classes (HR, 95% CI and log-rank P value). Scores are stratified into two classes as follows: low, score of ≤2; high: score of 3 or 4. b, Box-and-whisker plots of leave-one-out cross-validation of ranks from IFM1 and IFM2 (unadjusted P = 4.9 × 10–26 and adjusted using the Benjamini–Hochberg procedure Padj = 7.3 × 10–21); bootstrapping of HRs is shown in Extended Data Fig. 6d. Detailed analysis procedures are described in the Methods, and pairwise two-tailed t-tests were used unless otherwise mentioned (N = 40 participants/specimens; midline indicates the median, box limits indicate quartile 1 (25th percentile)/quartile 3 (75th percentile), whiskers indicate 1.5× IQR, and dots indicate outliers (>1.5× IQR). c, Kaplan–Meier plot for cohort 2 computed using IFM2 binary classes stratified into two classes as follows: low, score of ≤2; high, score of 3 or 4 (HR, 95% CI and log-rank P value; N = 33 participants/specimens). d, Representative Orion IF images of cases with high IFM2 (score = 4) and low IFM2 (score = 0). IF images show DNA, pan-cytokeratin, α-SMA, CD45 and PD-L1. Images are from two specimens (C34 and C09), as labeled. Source data
Fig. 6
Fig. 6. Bottom-up development of a tumor-intrinsic IFM.
a, Positions of three selected topics identified using LDA. Topic locations are overlaid on an H&E image. Data were derived from one representative specimen (C39); LN, lymph node. b, Left, markers making up selected LDA topics as shown by size of the text proportional to the frequency of the marker but with colored text scaled by 50% for clarity. Right, radar plot indicating the fraction of cells positive for each marker in topics 7, 8 and 11 (data for all others topics shown in Extended Data Fig. 7). c, IF images showing expression of pan-cytokeratin, α-SMA, CD20 and CD45 for the indicated LDA topics. The position of each image frame is denoted by the labeled boxes in a. Images are from one representative specimen (C39). d, Pearson correlation plots of PFS and fraction of topics 7, 8 and 11 in 40 individuals with CRC. Topic 11 corresponded to TLS, whose presence is known to correlate with good outcome. Pearson correlation was used, and unadjusted P values are provided. e, Fraction of topics 7, 8 and 11 in CRC specimens C01–C40. f, Box and whisker plots showing fractions of topic 7-, 8- and 11-positive cells for indicated markers; the midline indicates the median, box limits indicate quartile 1 (25th percentile)/quartile 3 (75th percentile), whiskers indicate 1.5× IQR, and dots indicate outliers (>1.5× IQR). Two-tailed pairwise t-test P values are indicated (N = 40 participants/specimens). The P values are listed below; pan-cytokeratin+: 2.83 × 10−44 (7 versus 11), 0.12 (7 versus 8), 4.48 × 10−42 (8 versus 11); E-cadherin+: 2.4 × 10−21 (7 versus 11), 8.26 × 10−21 (7 versus 8), 1.22 × 10−30 (8 versus 11); CD20+: 1.99 × 10−23 (7 versus 11), 0.63 (7 versus 8), 1.94 × 10−23 (8 versus 11); CD45+: 3.99 × 10−18 (7 versus 11), 6.7 × 10−3 (7 versus 8), 1.6 × 10−19 (8 versus 11); CD68+: 0.084 (7 versus 11), 2.88 × 10−5 (7 versus 8), 0.28 (8 versus 11); NS, not significant. Source data
Fig. 7
Fig. 7. LDA topic 7 corresponds to aggressive tumor regions and is correlated with poor outcomes.
a,b, Kaplan–Meier plots of PFS based on the fraction of topic 7 present in the tumor domain and stratified as ‘high’ when above the median (50th percentile) and ‘low’ when below the median of all cases (HR, 95% CI and log-rank P value) for 40 individuals with CRC in cohort 1 (a) and 34 individuals with CRC in cohort 2 (b). c, Representative H&E images of topic 7 (left) and topic 8 (right) extracted from all specimens using a CNN (GoogLeNet) trained on LDA data. Images were derived from 10 participants/specimens (C01–C10). d, Spatial map of LDA topic 7 and H&E image for one representative specimen (C02). e, Plot of fraction of topic 7 (IFM3) versus IFM1 score for 40 individuals with CRC. The midline indicates the median, box limits indicate quartile 1 (25th percentile)/quartile 3 (75th percentile), whiskers indicate 1.5× IQR, and dots indicate outliers (>1.5× IQR). f,g, Kaplan–Meier plots stratified using IFM4, which was binarized as follows: class 1, IFM1 high and topic 7 (IFM3) low group; class 2, all other participants (that is, either low IFM1 and/or high topic 7 (IFM3); HR, 95% CI and log-rank P value) for cohort 1(40 individuals with CRC; g) and cohort 2 (34 individuals with CRC; h). Source data
Extended Data Fig. 1
Extended Data Fig. 1. Features of the fluorophores, signal extraction, antibodies, cell type calling, and instrumentation used in the Orion™ Method.
a, Schematic of the Orion optical system. The Orion imaging system has fluorescence and brightfield imaging modes. Fluorescence imaging: A 7-color, class 1 laser was used to illuminate a sample slide. Emission light from the sample is redirected through a tunable emission filter prior to collection by a sCMOS camera. Brightfield imaging: The Orion system utilizes LED transillumination of the microscope slide sample. Transmitted light follows the same path as the fluorescence emission, with the exception that a window is used instead of an emission filter. b, Emission spectra of the ArgoFluor dyes with overlaid filter profiles. Each row shows fluorophores excited using the same laser (denoted by the colored vertical line). See Supplementary Table 2 for excitation laser wavelengths and fluorophores in channel 1 through 18. The 405-laser data was collected from tonsil tissue stained with Hoechst 33342; 445-laser data from unstained lung tissue. All other data was collected from single color Ig-capture beads (generated by incubation with antibodies conjugated to the indicated ArgoFluor dye). Per sample, data was collected in multiple Orion channels, spanning a wide range of wavelengths (in 2 nm center wavelength increments). c, Single channel images of FFPE tonsil section stained, imaged, and processed with Orion showing distinct spatial patterns and minimal channel crosstalk. d, Cell type calling dendrograms for Orion image analysis for colorectal cancer (left) and lung cancer (right). e, Stability of ArgoFluor 572 conjugated anti-CD4 antibody. Reagents were stored at an accelerated aging condition (21.6 °C) or the recommended condition (−20 °C). Storage for 3.5 months at 21.6 °C is equivalent to 5 years at −20 °C based on the Arrhenius equation. Fluorochrome property: The intensity of Ig-capture beads incubated with (signal) or without (background) antibody was measured from Orion images. The histogram overlay shows the intensity distribution for beads that were unlabeled or incubated with antibody and stored for 3.5 months at −20 °C or 21.6 °C. The mean fluorescence intensity (MFI) and the MFI signal-to-background (S:B) ratios were obtained across 7 time points. Epitope recognition: Human peripheral blood mononuclear cells (PBMC) were stained with accelerated-aged or real-time-aged ArgoFluor 572 conjugated anti-CD4 antibody and analyzed using flow cytometry. The MFI was obtained for the positive and negative populations to derive S:B ratios. Tissue staining: Orion images of serial sections from FFPE tonsil stained with real-time aged (top) and accelerated-aged (bottom) antibodies. These methods demonstrate equivalent performance for both storage conditions in the three assays. Source data
Extended Data Fig. 2
Extended Data Fig. 2. Orion imaging of different cancer types (colorectal and lung) and assessment of channel crosstalk.
a. Images of H&E-stained sections of colorectal cancer performed before IF imaging (no IF cycles) and after one cycle of IF imaging (1 IF cycle) showing excellent preservation of staining intensity and morphology. Scalebars 5 mm. Images from one sample. b, Representative images of 20-plex Orion panel from a primary lung adenocarcinoma sample. Note: two PD-L1 antibodies were used, PD-L1 (green) is E1L3N clone from Cell Signaling and PD-L1*(red) is EPR19759 from Abcam. Scalebars 50 µm. Images from one sample. c, 16-plex (18 channel) Orion image from a tissue microarray (TMA) containing normal and diseased human tissues including inflammatory and neoplastic diseases (Examples highlighted are lung squamous cell carcinoma (SCC), prostate adenocarcinoma, and breast ductal carcinoma); DNA, pan-cytokeratin, Ki-67, α-SMA, CD45 and CD31 are displayed. Scalebars 2 mm and 400 µm, as indicated. Images from one TMA containing 123 patient samples. d, Validation of minimal channel crosstalk in 18-plex tonsil image after spectral extraction. Pearson’s correlation coefficients between all channel pairs were calculated using the paired pixel intensities. Square boxes with colored borders denote excitation lasers. High correlation coefficients were only found in channel pairs that contains target markers that are in close proximity. Data was derived from a selected frame of (N =1) image. Source data
Extended Data Fig. 3
Extended Data Fig. 3. Qualifying 16-plex single-shot Orion antibody panel relative to immunohistochemistry and Cyclic Immunofluorescence (CyCIF).
a, Panels of images from FFPE tonsil sections showing single-antibody immunohistochemistry (IHC) for the indicated markers and matching channels extracted from the 16-plex Orion immunofluorescence (IF) images (H&E stain was performed on the same section as the Orion imaging). Scalebars 50 µm. Images are from one representative tonsil specimen. b, Plots of the fraction of positive for the indicated markers (CD45, CD68, CD20, CD4, FOXP3) from whole-slide Orion IF and CyCIF images acquired from two adjacent sections of 29 FFPE colorectal cancer specimens. Pearson correlation coefficients are indicated. c, t-distributed stochastic neighbor embedding (t-SNE) plots of cells from Orion IF image. Log transformed marker intensities (CD31, CD20, E-cadherin, Ki-67) were used to color the dots in each panel. Fig. 2d contains tSNE plots for additional markers and the inferred cell types. Single cell data is from one representative specimen (C01). Source data
Extended Data Fig. 4
Extended Data Fig. 4. Evaluation of Orion data collected at two performance sites.
a, Orion images of two adjacent sections acquired in two different laboratories. Specimen on the left was imaged at RareCyte, Inc in Seattle, WA and specimen on the right at HMS in Boston, MA. DNA (Sytox), CD45, pan-cytokeratin, α-SMA, and CD31 are shown. Scalebars 2 mm and 50 µm, as indicated. Images are from one representative sample (C29). b, Two-way hierarchical clustering heat map for the indicated markers and samples imaged at RareCyte (C19, C26, C29, C31, C35, C38) or at HMS (C19new, C26new, C29new, C31new, C35new, C38new) with the fraction of positive cells mapped to color. c, Bar plots showing the percentage of Topic 7 present in the indicated samples (C19, C26, C29, C31, C35, C38) imaged at two performance sites. Source data
Extended Data Fig. 5
Extended Data Fig. 5. Immunofluorescence and H&E images following multiple cycles of Orion imaging.
a, Left panel: Orion image of FFPE tonsil showing DNA (Sytox), CD31, CD20, CD3e, CD45 and α-SMA). Scalebars 1 mm. ROIs 1 to 4 displayed in Fig. 2e are noted. Scalebar 50 µm. Right panel: H&E image after two cycle Orion imaging (that is, after imaging of one panel, inactivation, and imaging of a second panel). Scalebars 1 mm. b, Top panel: Orion image of normal colon showing E-cadherin, CD11b, CD45, CD163, Ki-67, and DNA (Sytox) signal. Lower panel: same area of normal colon following inactivation of Orion fluorophores (see Methods). c, Same-slide Orion and CyCIF experiment. The tonsil samples were first processed with 16 Orion antibodies; PD-L1, CD4, CD8a, Ki-67, and α-SMA are shown. After imaging, fluorophores were inactivated by bleaching using the standard CyCIF protocol, then three-cycles of four-channel CyCIF staining and imaging were performed using the indicated antibodies. d, Images of H&E-stained sections of colorectal cancer without prior IF staining (right) and following 10 cycles of IF (left) using the standard CyCIF approach. Area shown in insets is indicated in the low magnification images. Scalebars 5 mm and 100 µm. e, Images of H&E-stained sections of colorectal cancer performed before IF imaging (0 cycles), after one cycle of IF imaging (1 IF cycle), and after two cycles of IF imaging (2 IF cycles). Scalebars 200 µm. f, Orion IF image from colorectal cancer resection, showing an area of serrated adenoma with low pan-cytokeratin expression (markers as indicated). Higher magnification inset as indicated by the box is shown in Fig. 3f. Scalebar 3 mm. Images are from one specimen (C26).
Extended Data Fig. 6
Extended Data Fig. 6. Assessment of individual markers in Image Feature Models of patient prognosis derived from Orion immunofluorescence images.
a, Upper: Ranking of 1/hazard ratio (HR) for each Image Feature Model (IFM1 to IFM14,950) calculated by determining the positive cell frequency for one or more of 13 markers, lying within (tumor center: CT) or outside of a region 100 µm from the tumor invasive margin (IM) model (N = 40 patients). Ranking of IFM1 is indicated. IFM2 showed an HR = 0.08 (95% CI: 0.04–0.17, p = 1.91 × 10−06). Lower: Heat map showing the selected markers at the tumor or margin in each combination. 14,950 total combinations were generated as the set of 4 out of 26 parameters (13 markers in 2 regions). b, Enrichment plots showing enrichment scores (ES) for positive cells per indicated marker (and their location in the tumor or at the tumor margin) based on the 16-plex Orion images, indicating whether the marker/location feature is enriched in the IFMs linked to the best hazard ratios. The green lines represent the running ES for a given marker/location as the analysis proceeds down the ranked list. The value at the peak is the final ES. The Kolmogorov-Smirnov test was used to calculate the ES and p-values (N = 40 patients). c, Regression line scatter plot showing fraction of positive cells for indicated markers from the Orion 16-plex images vs. progression-free survival (PFS, days) for 40 patients with CRC. Each dot represents measurements from a single patient. r per plot is displayed. d, Plot bootstrapping HRs from IFM1 and IFM2 (unadjusted p = 4.62 × 10⁻²⁶ and adjusted p = 6.9 × 10⁻²¹). Related to Fig. 5b. Detailed analysis is described in Methods. Pairwise two-tailed t-tests were used unless otherwise mentioned. Box and whisker represents N = 500 (random sampling), where midline = median, box limits = Q1 (25th percentile)/Q3 (75th percentile), whiskers = 1.5 inter-quartile range (IQR), and dots = outliers (>1.5IQR). e, Representative Orion IF images of cases with high IFM2 (IS = 4 in specimen C34) and low IFM2 (IS = 0 in specimen C09). Scalebars 5 mm. Higher magnification regions of interest shown in Fig. 5d. Images are from 2 representative patients/samples. Source data
Extended Data Fig. 7
Extended Data Fig. 7. Cellular neighborhoods in colorectal cancer resections.
a, Latent Dirichlet Allocation (LDA) probabilistic modeling was used to analyze Orion immunofluorescence data from 40 colorectal cancer specimens to reduce cell populations into neighborhoods (‘topics’) defined by patterns of single-cell marker expression. The analysis identified 12 topics that recurred across the dataset. Within each box is the LDA plot for the indicated topic (top) and a regression line scatter plot indicating the fraction of each tumor composed of the indicated LDA topic and the relationship to progression-free survival (PFS, days). Each dot represents measurements from a single patient. r value for each plot is displayed. b, Bar plot depicting the proportional distribution of the LDA Topics in the 40 colorectal cancer specimens. Source data
Extended Data Fig. 8
Extended Data Fig. 8. Evaluation of the performance of a Convolution Neural Network used to identify cellular neighborhood Topic 7 from H&E images of colorectal cancer.
a, Kaplan Meier plots of PFS for 40 CRC patients based on the fraction of Topic 7 present in the tumor domain and stratified using a threshold (‘cutoff’) of 60th percentile (left) and 75th percentile (right) (HR, hazards ratio; 95% confidence interval; logrank p-value). b, Confusion matrix table showing performance of GoogLeNet convolutional neural network (CNN) trained using H&E data from Latent Dirichlet Allocation (LDA) Topic 7 and its performance in identifying Topic 7 cells from H&E data. Topic 0 contains the rest of the topics (3, 5, 6, 9, 10, 11, 12). Target class (ground truth) was assigned from LDA analysis of Orion images and Output class (predicted) was assigned by the GoogLeNet CNN. c, Gallery of representative H&E images of true positives for topic 8 from 10 patients/specimens (C01-C10); Scalebars 50 µm. Source data
Extended Data Fig. 9
Extended Data Fig. 9. CyCIF imaging of Topic 7 tumor cells.
CyCIF imaging of regions of specimen C06 which had a high fraction of Topic 7 cells. The CyCIF image is from a non-adjacent section to that used for Orion data section. Images show DNA (Sytox), ZEB1, α-SMA, NA-K ATPase, pan-cytokeratin. Location of insets are indicated. Scalebars, 2 mm, 0.5 mm, 50 µm, as indicated. The mesenchymal differentiation/EMT-marker ZEB1 (nuclear blue signal) is present in stromal cells (white arrow) but absent in the tumor cells (marked by pan-cytokeratin, red; yellow arrow). Images here are from one sample (C06).

References

    1. Bock O. A history of the development of histology up to the end of the nineteenth century. Research. 2015;2:1283.
    1. Paget S. The distribution of secondary growths in cancer of the breast. Lancet. 1889;133:571–573. - PubMed
    1. Kumar, V., Abbas, A. K., Aster, J. C., & Perkins, J. A. Robbins & Cotran Pathologic Basis of Disease (Elsevier, 2021).
    1. Demir, C. & Yener, B. Automated Cancer Diagnosis Based on Histopathological Images: A Systematic Survey (Rensselaer Polytechnic Institute, 2005).
    1. Cui M, Zhang DY. Artificial intelligence and computational pathology. Lab. Invest. 2021;101:412–422. - PMC - PubMed

Publication types

Substances