. 2023 Aug;18(8):898-904.
doi: 10.1038/s41565-023-01421-3. Epub 2023 Jun 22.

Electron cooling in graphene enhanced by plasmon-hydron resonance

Affiliations

Electron cooling in graphene enhanced by plasmon-hydron resonance

Xiaoqing Yu et al. Nat Nanotechnol. 2023 Aug.

Abstract

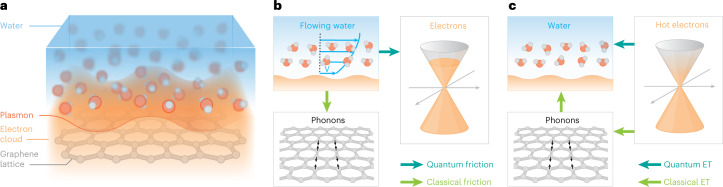
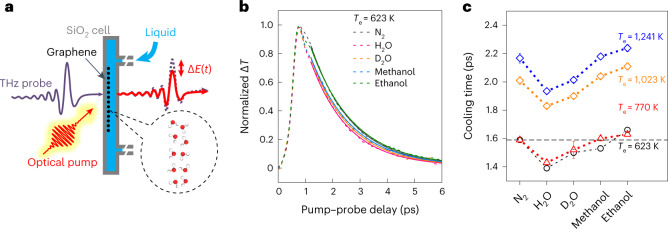
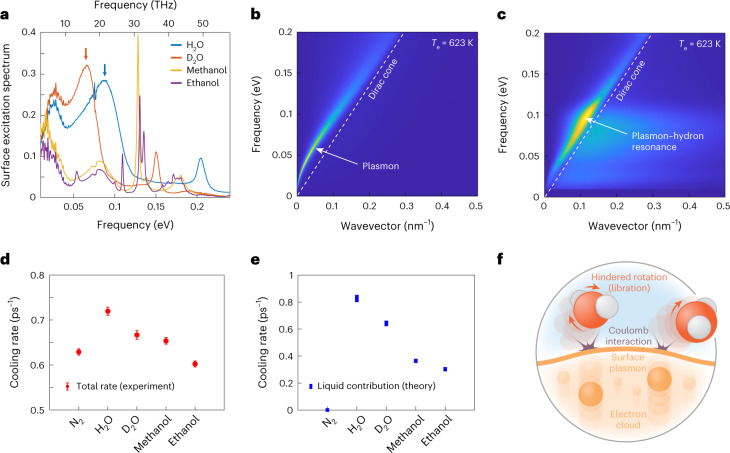
Evidence is accumulating for the crucial role of a solid's free electrons in the dynamics of solid-liquid interfaces. Liquids induce electronic polarization and drive electric currents as they flow; electronic excitations, in turn, participate in hydrodynamic friction. Yet, the underlying solid-liquid interactions have been lacking a direct experimental probe. Here we study the energy transfer across liquid-graphene interfaces using ultrafast spectroscopy. The graphene electrons are heated up quasi-instantaneously by a visible excitation pulse, and the time evolution of the electronic temperature is then monitored with a terahertz pulse. We observe that water accelerates the cooling of the graphene electrons, whereas other polar liquids leave the cooling dynamics largely unaffected. A quantum theory of solid-liquid heat transfer accounts for the water-specific cooling enhancement through a resonance between the graphene surface plasmon mode and the so-called hydrons-water charge fluctuations-particularly the water libration modes, which allows for efficient energy transfer. Our results provide direct experimental evidence of a solid-liquid interaction mediated by collective modes and support the theoretically proposed mechanism for quantum friction. They further reveal a particularly large thermal boundary conductance for the water-graphene interface and suggest strategies for enhancing the thermal conductivity in graphene-based nanostructures.


Conflict of interest statement

The authors declare no competing interests.

Figures

Fig. 1
Fig. 1. Heat transfer and friction at the solid–liquid interface.
a, Schematics of the system under study: the interface between water and a graphene sheet. The picture emphasizes the electron cloud and its wave-like plasmon excitation. b, Momentum transfer processes at the solid–liquid interface. A flowing liquid (the flow profile is shown by the thin blue arrows) may not only transfer momentum to the crystal lattice (exciting phonon vibrations) through classical hydrodynamic friction, but also directly to the electrons through quantum friction. c, Energy transfer (ET) processes at the solid–liquid interface. In the typically assumed ‘classical’ pathway, hot electrons first transfer energy to the phonons, which transfer energy to the liquid. An alternative ‘quantum’ pathway consists in the electrons transferring energy directly to the liquid through Coulomb coupling.
Fig. 2
Fig. 2. Measurement of picosecond hot electron relaxation in graphene.
a, Schematic of the experimental set-up. A graphene sample (Fermi level in the range 100−180 meV; Supplementary Information, section 1.4) is placed in contact with a liquid inside a fused silica flow cell. An optical excitation pulse quasi-instantaneously heats up the graphene electrons, and the electron temperature dynamics are then monitored with a THz probe. b, Normalized electron temperature as a function of time after photoexcitation. The dotted lines represent raw data and the full lines are exponential fits. c, Electron cooling time obtained through exponential fitting (see b) for the different liquids that have been placed in the flow cell and different initial electron temperatures, set by the excitation laser fluence. Faster cooling is observed in the presence of water and heavy water. Error bars represent 95% confidence intervals of the exponential fits, and the centre point corresponds to the result of the least-squares fitting procedure.
Fig. 3
Fig. 3. Mechanism of electron–liquid heat transfer.
a, Surface excitation spectra Im[gl(ω)] of the different liquids studied here obtained according to equation (2) from the experimentally measured bulk dielectric permittivities. The arrows indicate the libration modes of H2O and D2O. b, Graphene surface excitation spectrum Im[ge(q,ω)], calculated at a chemical potential μ = 100 meV and temperature Te = 623 K. The main feature is the collective plasmon mode. c, Theoretical prediction for the graphene–water energy transfer rate resolved in frequency–wavevector space. The main contribution originates from a resonance between the graphene plasmon mode and the water libration mode. d, Experimentally measured electron cooling rate in the presence of the various liquids, for an initial electron temperature Te = 623 K. Error bars represent 95% confidence intervals of the exponential fits to the temperature decay curves. e, Theoretical prediction for the liquid contribution to the electron cooling rate, reproducing the experimentally observed trend in terms of the nature of the liquid. The symbol size in the vertical direction represents the variation in the theoretical prediction when the graphene chemical potential spans the range 100–180 meV. f, Schematic of the water-mediated electron cooling mechanism inferred from the combination of theoretical and experimental results. The cooling proceeds through the Coulomb interaction between the graphene plasmon mode and the hindered molecular rotations (librations) in water.
Fig. 4
Fig. 4. Strong plasmon–hydron coupling.
a, Theoretical prediction for the graphene electron cooling rate in contact with different liquids, within different treatments of interactions. The cooling rate is strongly overestimated if no electron–electron interactions are taken into account (blue symbols), and underestimated if the electron–liquid interactions are considered only to first order (orange symbols). b, Graphene surface excitation spectrum Im[ge(q,ω)], calculated at a chemical potential μ = 180 meV and temperature Te = 623 K, renormalized by the presence of water according to equation (5). The white dashed lines are guides to the eye showing the strongly coupled plasmon–hydron mode. Inset: bare and renormalized graphene spectra at fixed wavevector q0 = 0.15 nm−1. c, Comparison between the spectrally resolved energy transfer rates obtained to first order and to arbitrary order in the solid–liquid interaction. Higher-order effects enhance the energy transfer rate at low frequencies.

References

    1. Hwang HY, et al. Nonlinear THz conductivity dynamics in p-type CVD-grown graphene. J. Phys. Chem. B. 2013;117:15819–15824. doi: 10.1021/jp407548a. - DOI - PubMed
    1. Hafez HA, et al. Extremely efficient terahertz high-harmonic generation in graphene by hot Dirac fermions. Nature. 2018;561:507–511. doi: 10.1038/s41586-018-0508-1. - DOI - PubMed
    1. Liu M, et al. A graphene-based broadband optical modulator. Nature. 2011;474:64–67. doi: 10.1038/nature10067. - DOI - PubMed
    1. Romagnoli M, et al. Graphene-based integrated photonics for next-generation datacom and telecom. Nat. Rev. Mater. 2018;3:392–414. doi: 10.1038/s41578-018-0040-9. - DOI
    1. Muench JE, et al. Waveguide-integrated, plasmonic enhanced graphene photodetectors. Nano Lett. 2019;19:7632–7644. doi: 10.1021/acs.nanolett.9b02238. - DOI - PubMed