. 2023 Jun 22;13(1):10178.
doi: 10.1038/s41598-023-37189-8.

Paying attention to the outcome of others' actions has dissociated effects on observer's peripersonal space representation and exploitation

Affiliations

Paying attention to the outcome of others' actions has dissociated effects on observer's peripersonal space representation and exploitation

Maria Francesca Gigliotti et al. Sci Rep. .

Abstract

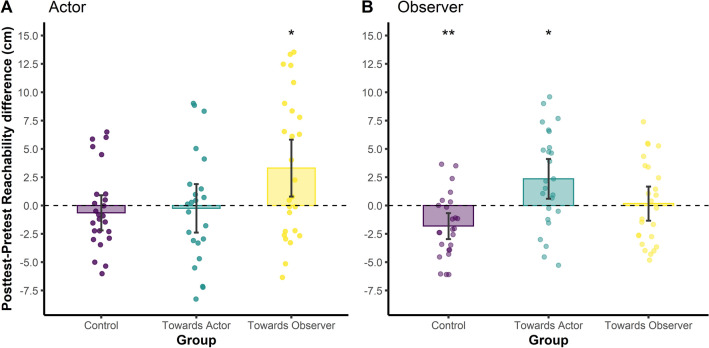
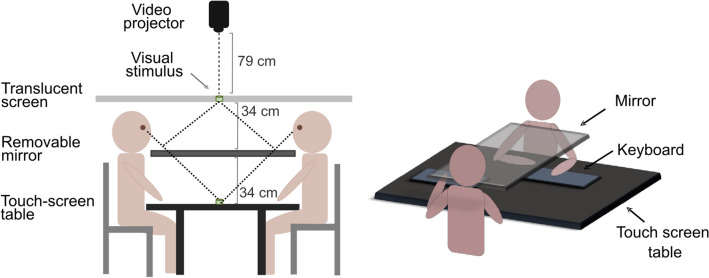
The representation of peripersonal space (PPS representation) and the selection of motor actions within it (PPS exploitation) are influenced by action outcomes and reward prospects. The present study tested whether observing the outcome of others' actions altered the observer's PPS representation and exploitation. Participants (observers) performed a reachability-judgement task (assessing PPS representation) before and after having observed a confederate (actors) performing a stimuli-selection task on a touch-screen table. In the stimuli-selection task, the stimuli selected could either yield a reward or not, but the probability to select a reward-yielding stimulus was biased in space, being either 50%, 25% or 75% in the actor's proximal or distal space. After the observation phase, participants performed the stimuli-selection task (assessing PPS exploitation), but with no spatial bias in the distribution of reward-yielding stimuli. Results revealed an effect of actors' actions outcome on observers' PPS representation, which changed according to the distribution of reward-yielding stimuli in the actors' proximal and distal spaces. No significant effect of actors' actions outcome was found on observers' PPS exploitation. As a whole, the results suggest dissociated effects of observing the outcome of others' actions on PPS representation and exploitation.


Conflict of interest statement

The authors declare no competing interests.

Figures

Figure 1
Figure 1
Experimental procedure and tasks. (A) Sequential order of the tasks. First, participants performed the reachability-judgment task. Second, the actor performed the stimuli-selection task, while the observer observed his/her confederate’s performance. Third, participants realised the reachability-judgment task for a second time. Finally, participants performed again the stimuli-selection task, but switching their roles: the observer realised the stimuli-selection task, while the actor observed. (B) Distribution of the reward-yielding stimuli as function of the group. In the Control group, the probability to select a reward-yielding stimulus was 50% both in the space near the actor (rows 1, 2, 3 of the grid) and in the space near the observer (rows 4, 5, 6). In the Towards Actor group, the probability to select a reward-yielding stimulus was 75% in the space near the actor and 25% in the space near the observer. On the contrary, in the Towards Observer group, it was 75% in the space near the observer and 25% in the space near the actor. It is important to note that when the observers performed the stimuli-selection task, the probability to select a reward-yielding stimulus was 50% both in the near and far spaces (as in the Control Group) for all the three groups, regardless of the group assigned during the observation phase. In this way, we expected observers to base their selection strategy on the observation of actors’ performances, rather than on the detection of a biased distribution of reward-yielding stimuli.
Figure 2
Figure 2
Posttest–pretest difference in reachability threshold as function of the group (Control, Towards Actor, Towards Observer) and the role (Actor, Observer). (A) Actor’s posttest–pretest differences in reachability threshold. Only the Towards Observer group showed a significant change in reachability threshold, which increased in the posttest compared to the pretest (posttest–pretest > 0). No significant change was observed for the other two groups. (B) Observer’s posttest–pretest differences in reachability threshold. The Towards Actor Group showed a significant change in reachability threshold, which increased in the posttest compared to the pretest (posttest–pretest difference > 0). The Control group showed also a significant change in reachability threshold, which decreased in the posttest compared to the pretest (posttest–pretest difference < 0). No significant change was observed for the Towards Observer group. Histograms represent the mean posttest–pretest difference in reachability threshold. Dots represent individual posttest–pretest differences. Error bars represent 95% confidence intervals. *p < 0.050, **p < 0.010.
Figure 3
Figure 3
Density maps illustrating the frequency at which each location of the touch-screen table was chosen when it contained a stimulus. The rectangles represent the distribution grid composed of 42 cells (6 rows × 7 columns). The colour bar ranges from blue (rare selection) to red (frequent selection). The human silhouette above or below each density map represents participants’ position during the task. (A) Actors’ performance during the stimuli-selection task. The Control group tended to explore the whole surface. The Towards Actor group explored mainly the space near themselves, while the Towards Observer group explored the whole surface tending slightly towards the space near the observer. (B) Observers’ performance during the stimuli-selection task (first 3 blocks only). The three groups did not show any particular trend in their early selection strategy. (C) Mean number of reward-yielding stimuli obtained by the actor. Histograms represent the mean number of reward-yielding stimuli obtained by the actor in the distal space (i.e., near the observer). Dots represent individual data and error bars 95% confidence intervals. Percentage values represent the proportion of reward-yielding stimuli obtained in the distal space with respect to the total amount of stimuli selected. ***p < 0.001.
Figure 4
Figure 4
Mean percentage of stimuli selected in the space near the observer (for the actor) or near the actor (for the observer), as function of the group (Control, Towards Actor, Towards Observer) and the role (Actor, Observer). (A) Mean percentage of stimuli selected by the actor in the space near the observer across the 17 blocks, as function of the group. As shown by linear regressions, only the Towards Observer group changed its selection strategy during the task: they selected progressively more stimuli in the space near the observer, which was associated, for this group, to a higher probability of obtaining a reward-yielding stimulus. (B) Results of the permutation-based multiple comparisons tests for the actor (*p < 0.050). The Towards Actor and Control groups showed different selection strategies from the 1st block on, and throughout all the task. By contrast, the Towards Observer group showed a different strategy from the Control group from the 14th block on. (C) Mean percentage of stimuli selected by the observer in the space near the actor across the 17 blocks, as function of the group. As shown by linear regressions, the selection strategy adopted by the three groups did not change across the task. (D) Results of the permutation-based multiple comparisons for the observer. Any difference did not emerge between the three groups. *p < 0.050.
Figure 5
Figure 5
(A) Schematic representation of the experimental setting. During the reachability-judgment task, the video-projector projected an image on the mirror, through a translucent screen (which improved the sharpness of the image). This generated an optical projection effect, increasing the depth of the visual field and making the stimuli appear at the level of the touch-screen table. (B) Participants’ posture during the reachability-judgment task. The mirror hid participants’ hands and the keyboards used to provide the answers. During the task, the touch-screen table was covered by a black sheet, in order to avoid any interference from external luminous sources. Once the reachability-judgment task was completed, the mirror and the keyboards were displaced on the side, and the black sheet covering the touch-screen table removed.

References

    1. Rizzolatti G, Scandolara C, Matelli M, Gentilucci M. Afferent properties of periarcuate neurons in macaque monkeys I. Somatosensory responses. Behav. Brain Res. 1981;2:125–146. doi: 10.1016/0166-4328(81)90052-8. - DOI - PubMed
    1. Bufacchi RJ, Iannetti GD. An action field theory of peripersonal space. Trends Cogn. Sci. 2018;22:1076–1090. doi: 10.1016/j.tics.2018.09.004. - DOI - PMC - PubMed
    1. de Vignemont F, Iannetti GD. How many peripersonal spaces? Neuropsychologia. 2015;70:327–334. doi: 10.1016/j.neuropsychologia.2014.11.018. - DOI - PubMed
    1. di Pellegrino G, Làdavas E. Peripersonal space in the brain. Neuropsychologia. 2015;66:126–133. doi: 10.1016/j.neuropsychologia.2014.11.011. - DOI - PubMed
    1. Coello Y, Cartaud A. The interrelation between peripersonal action space and interpersonal social space: Psychophysiological evidence and clinical implications. Front. Hum. Neurosci. 2021;15:1–14. doi: 10.3389/fnhum.2021.636124. - DOI - PMC - PubMed

Publication types