. 2023 Jul;8(7):1252-1266.
doi: 10.1038/s41564-023-01405-y. Epub 2023 Jun 22.

Modelling viral encephalitis caused by herpes simplex virus 1 infection in cerebral organoids

Affiliations

Modelling viral encephalitis caused by herpes simplex virus 1 infection in cerebral organoids

Agnieszka Rybak-Wolf et al. Nat Microbiol. 2023 Jul.

Abstract

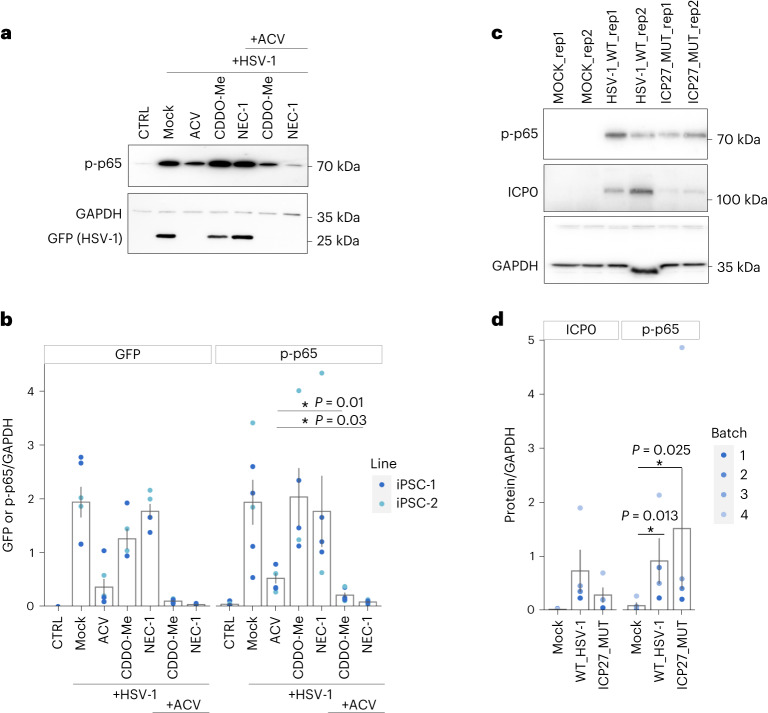
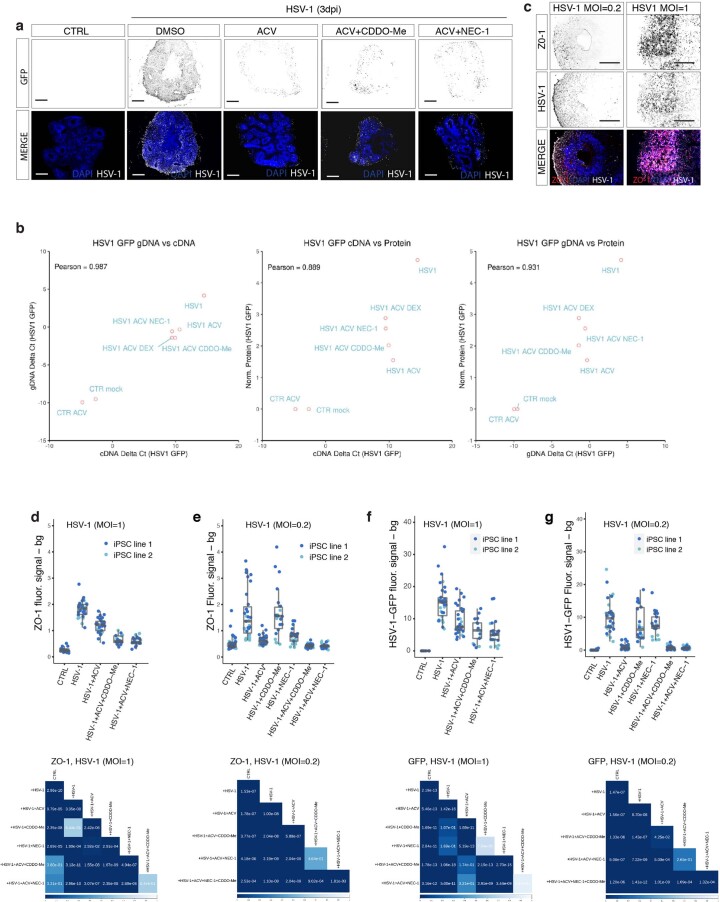
Herpes simplex encephalitis is a life-threatening disease of the central nervous system caused by herpes simplex viruses (HSVs). Following standard of care with antiviral acyclovir treatment, most patients still experience various neurological sequelae. Here we characterize HSV-1 infection of human brain organoids by combining single-cell RNA sequencing, electrophysiology and immunostaining. We observed strong perturbations of tissue integrity, neuronal function and cellular transcriptomes. Under acyclovir treatment viral replication was stopped, but did not prevent HSV-1-driven defects such as damage of neuronal processes and neuroepithelium. Unbiased analysis of pathways deregulated upon infection revealed tumour necrosis factor activation as a potential causal factor. Combination of anti-inflammatory drugs such as necrostatin-1 or bardoxolone methyl with antiviral treatment prevented the damages caused by infection, indicating that tuning the inflammatory response in acute infection may improve current therapeutic strategies.


Conflict of interest statement

The authors declare no competing interests.

Figures

Fig. 1
Fig. 1. Cerebral organoids development at single-cell and spatial resolution.
a, Schematic overview of cerebral organoids generation using iPS cells. Bottom: representative images of organoids at different developmental stages. b, Representative images from the Resolve Biosciences’ Molecular Cartography analysis of 60-day-old organoid from iPS cell line 1 for markers EOMES (intermediate progenitors), SOX2/PAX2 (progenitors), TBR1 (deeper-layer cortical neurons), BCL11B (upper-layer cortical neurons) and TUBB3 (neurons). Scale bar, 100 µm. Representative image of one experiment with two biological replicates (n = 2). c, Exemplary immunohistochemistry of 60-day-old cerebral brain organoids showing expression of TBR1 (deeper-layer cortical neurons), SATB2 (upper-layer cortical neurons), SOX2 (progenitors), TUJ1/MAP2 (neurons), GFAP (astroglia) and ZO-1 (neuroepithelial junctions). Scale bar, 500 µm. Right: merged images co-stained with nuclear marker DAPI (blue). Representative image of three experiments from two independent iPS cell lines (n = 3 independent organoids/iPS cell line/experiment). d, UMAP plot of scRNA-seq data. Colours are mapped to the clusters (annotated on the right); broader cell-type definitions are overlayed on the plot. Data from two independent iPS cell lines, n = 2 biological replicates each.
Fig. 2
Fig. 2. HSV-1 impairs synaptic activity and alters neuroepithelium identity.
a, Schematic overview of experimental set-up. CTRL, uninfected control. b, HSV-1–GFP protein (black) expression in uninfected and 1 and 3 dpi HSV-1-infected 60-day-old organoids. Bottom: merged images showing HSV-1–GFP protein (white) and nuclear marker DAPI (blue). Scale bars, 500 µm. Images representative of three experiments. c, CalBryte590 AM-loaded (green) organoids (left); spike frequency illustrated by colour-coded image (middle); and spike detection plot for all regions of interest (ROIs) (right) in uninfected organoids. Scale bar, 100 μm. d, CalBryte590 AM-loaded (green) organoids showing HSV-1–GFP expression (grey) at 48 h post infection (hpi) (left); spike frequency illustrated by colour-coded image (middle); and spike detection plot for all ROIs (right) in 48 hpi HSV-1-infected (organoids. Scale bar, 100 μm. Images representative of one experiment, n = 3 biological replicates per condition. e, Immunohistochemistry for neuronal proteins STMN2 and NEUN, and HSV-1–GFP protein expression in uninfected and 1 and 3 dpi HSV-1-infected 60-day-old organoids. Right: merged images (HSV-1–GFP, white; STMN2, red, NEUN, green) co-stained with nuclear marker DAPI (blue). Scale bars, 100 µm. f, Immunohistochemistry for tight junction protein ZO-1 and HSV-1–GFP protein expression in uninfected and 1 and 3 dpi HSV-1-infected 60-day-old organoids. Right: merged images (HSV-1–GFP, white; ZO-1, red) co-stained with nuclear marker DAPI (blue). Scale bars, 100 µm. Images representative of three experiments, with two independent iPS cell lines (n = 3 independent organoids/condition/iPS cell line/experiment).
Fig. 3
Fig. 3. Cell-type-specific responses in HSV-1-infected and ACV-treated organoids.
a, UMAP plot of cells from uninfected (CTRL), HSV-1-infected (1 and 3 dpi) and 3 dpi HSV-1-infected ACV-treated organoids. b, Proportion of cell types in uninfected, HSV-1-infected (1 and 3 dpi) and 3 dpi HSV-1-infected ACV-treated organoids. c, Mean viral load (percentage of viral UMI) in every cluster for each condition. Missing values (NA) are indicated for ‘highly infected’ clusters in uninfected organoids. d, UMAP plots of cells coloured by the density of cells from each condition in the specific UMAP area shown for uninfected, HSV-1-infected (1 and 3 dpi) and 3 dpi HSV-1-infected ACV-treated organoids, in which yellow and blue indicate increased and decreased density, respectively. Data from two independent iPS cell lines, n = 2 biological replicates/condition/iPS cell line. Source data
Fig. 4
Fig. 4. ACV does not prevent HSV-1-driven inflammatory responses.
a, Enriched gene sets for the assessed cell types based on the comparison of HSV-1-infected (1 and 3 dpi) and 3 dpi HSV-1-infected ACV-treated organoids with uninfected organoids. Colour indicates normalized enrichment score (NES) values and dot size represents −log10-adjusted P value for statistically significant pathways according to gene set enrichment analysis (GSEA) analysis. b, UMAP plots of cells coloured by the TNF pathway activity score in each cell and separated in uninfected (CTRL), HSV-1-infected (1 and 3 dpi) and 3 dpi HSV-1-infected ACV-treated organoids, with red and blue indicating increased and decreased scores, respectively. Pooled data from two independent iPS cell lines, n = 2 biological replicates for each line. c, Representative western blot analysis of p-p65 expression in uninfected, 3 dpi HSV-1-infected and 3 dpi HSV-1-infected ACV-treated organoids; GAPDH serves as loading control, and GFP indicates virus expression (bottom). d, Semi-quantification of p-p65 protein expression by densitometry in uninfected, 3 dpi HSV-1-infected and 3 dpi HSV-1-infected ACV-treated organoids, normalized to GAPDH expression. *P < 0.05, **P < 0.01, Benjamini–Hochberg-corrected two-sided t-tests. n = 6 biologically independent samples; that is, six batches of pooled organoids from two iPS cell lines; colour indicates cell line of origin. Bar plots and error bars show mean ± standard error. e, Representative immunohistochemistry for SOX2 (top) and HSV-1–GFP protein expression (middle) in uninfected, HSV-1-infected (1 and 3 dpi), and 3 dpi HSV-1-infected ACV-treated organoids. Bottom: merged images (HSV-1–GFP, white; SOX2, red) co-stained with nuclear marker DAPI (blue). Scale bar, 100 µm. Representative image of three experiments (n = 3 independent organoids/condition/iPS cell line). Source data
Fig. 5
Fig. 5. Combinatorial treatment strategies for HSV-1-driven neuroinflammation.
a, Schematic overview of combinatorial treatment set-up. b, Exemplary images of intact organoids (top) and HSV-1–GFP protein expression (bottom) in uninfected (CTRL) and 3 dpi HSV-1-infected mock-treated (DMSO), ACV-treated, CDDO-Me-treated, NEC-1-treated, ACV and CDDO-Me-co-treated, and ACV and NEC-1-co-treated organoids. Scale bars, 800 µm. Representative image of three experiments from two different iPS cell lines (n = 3 independent organoids/condition/iPS cell line). c, Representative immunohistochemistry for ZO-1 (top) and HSV-1–GFP (middle) protein expression in uninfected and 3 dpi HSV-1-infected mock-treated, ACV-treated, CDDO-Me-treated, NEC-1-treated, ACV and CDDO-Me-co-treated, and ACV and NEC-1-co-treated organoids. Bottom: merged images (HSV-1–GFP, white; ZO-1, red) co-stained with nuclear marker DAPI (blue). Scale bars, 100 µm. Representative image of three experiments, two different iPS cell lines (n = 3 independent organoids/condition/iPS cell line). d, Representative immunohistochemistry for STMN2 (top) and HSV-1–GFP (middle) protein expression in uninfected and 3 dpi HSV-1-infected mock-treated, ACV-treated, CDDO-Me-treated, NEC-1-treated, ACV and CDDO-Me-co-treated, and ACV and NEC-1-co-treated organoids. Bottom: merged images (HSV-1–GFP, white; STMN2, red) co-stained with nuclear marker DAPI (blue). Scale bars, 100 µm. Representative image of three experiments, two different iPS cell lines (n = 3 independent organoids/condition/iPS cell line).
Fig. 6
Fig. 6. Combinatorial treatment reduces HSV-1-driven neuroinflammation in HSV-1-infected organoids.
a, Representative western blots analysis of p-p65 expression in uninfected (CTRL) and 3 dpi HSV-1-infected mock-treated (DMSO), ACV-treated, CDDO-Me-treated, NEC-1-treated, ACV and CDDO-Me-co-treated, and ACV and NEC-1-co-treated organoids. GAPDH serves as a loading control and GFP indicates virus expression (bottom). b, Semi-quantification of HSV-1–GFP (left) and p-p65 protein expression (right) by densitometry in uninfected and 3 dpi HSV-1-infected mock-treated, ACV-treate, CDDO-Me-treated, NEC-1-treated, ACV and CDDO-Me-co-treated, and ACV and NEC-1-co-treated organoids, normalized to GAPDH expression. P values were determined by Benjamini–Hochberg-corrected two-sided t-tests (n = 5 biologically independent samples for CTRL, HSV1 + CDDO-Me and HSV1 + NEC-1, n = 6 for all others; colour indicates cell line of origin). Error bars indicate the mean ± standard error. c, Representative western blots analysis of p-p65 expression in uninfected (mock) organoids and 3-dpi organoids infected with wild-type (WT) HSV-1 KOS strain or HSV-1 KOS ICP27 mutant strain. GAPDH serves as a loading control and ICP0 indicates virus expression (bottom). d, Semi-quantification of HSV-1-ICP0 (left) and p-p65 protein expression (right) by densitometry in uninfected and 3-dpi organoids infected with wild-type HSV-1 KOS or HSV-1 KOS ICP27 mutant strain. P values were determined by Benjamini–Hochberg-corrected paired two-sided t-tests (n = 5 biologically independent samples coming from n = 4 batches of medium preparation, indicated by colour). Bar plots and error bars show mean ± standard error. Source data
Extended Data Fig. 1
Extended Data Fig. 1. Cerebral organoids development at single cell and spatial resolution.
a, Representative images from the Resolve Biosciences’ Molecular Cartography analysis of 60 days old organoid from iPSC line 2 for markers: EOMES – intermediate progenitors, SOX2/PAX6 – progenitors, TBR1 - deeper layer cortical neurons, BCL11B- upper layer cortical neurons, TUBB3- neurons. Representative image of one experiment, n=2 biological replicates. Scale bar - 100 µm. b, High magnification of exemplary immunostaining of 60 days old cerebral brain organoids showing expression of TBR1 - deeper layer cortical neurons, SATB2- upper layer cortical neurons, SOX2- progenitors, TUJ1/MAP2 – neurons, GFAP- astroglia, ZO-1- neuroepithelial junctions. Representative of three independent experiments (n=3 independent organoids/ iPSC line / experiment). Scale bar - 100 µm. c, UMAP plots with cells colored by replicate (Rep) showing overlap between two biological replicates from control 60 days old cerebral organoids derived from induced Pluripotent Stem Cell (iPSC) line 1 (upper panel) and iPSC line 2 (lower panel). Scale bar - 100 µm d, UMAP plots depicting normalized expression of cell-type specific markers: VIM, SOX2-progenitors, FOXG1- telencephalic neurons and progenitors, MKI67-proliferating radial glia, DCX- neurons, EOMES-intermediate progenitors, NEUROD2, NEUROD6 – cortical neurons, BCL11B- upper layer cortical neurons, TCF7L2- Thalamic neurons, GFAP, SPARCL1-astroglia, RSPO2, RSPO3- cortical hem, TTR-choroid plexus, DCT- retinal pigmented epithelium, SFRP2- retinal progenitors, COL1A2 – mural cells, RELN- Cajal Retzius neurons. All expression values are clipped to 2 for a better and homogenous color representation. (Two independent iPSC lines, each n=2 biological replicates).
Extended Data Fig. 2
Extended Data Fig. 2. HSV-1 driven impairment of synaptic activity.
a, Spatial transcriptomics analysis of HSV-1 GFP expression in uninfected (CTR) as well as 1 and 3 days post infection (dpi). Colors indicate log2 GFP mRNA expression. Representative image of one experiment, n=4 biological replicates. b, Fold changes (Log2FoldChange) of gene expression between control (CTR) and infected organoids 3 days post infection (+HSV-1 3dpi) versus log10 normalized mean transcript counts (baseMean). HSV-1 transcripts (green) and ‘CHEMICAL SYNAPTIC TRANSMISSION’ genes (red) are highlighted. Data from two independent iPSC lines, n=3 biological replicates/condition/iPSC line (see Methods). c, Exemplary immunohistochemistry for synaptic (SYN1 – black, magenta) neuronal, nuclei (DAPI – black, blue) and HSV-1 (GFP - white) in uninfected and infected organoids. Scale bar - 100 µm. Representative image of three independent experiments (n=3 independent replicates). d, Representative western blots of synaptic proteins (HOMER1, SYN1) and a housekeeping protein (GAPDH) of uninfected (CTRL) and infected (HSV-1) organoids. Representative image of three independent experiments, n=3 biological replicates. e, Mosaic image of the footprint of an uninfected organoid (CTRL) and HSV-1-GFP infected organoid (HSV-1) used in calcium imaging experiments showing TUJ1 expression (red), HSV-1-GFP expression (green) and DAPI (blue). Scale bar – 1 mm. Representative image of one experiment, n=3 independent organoids/condition were analyzed. f, Line chart showing the progression of the relative activity based on the mean spike frequency of uninfected (CTRL) and infected (+HSV-1) after 24 and 48 hours post-infection (hpi), n=3 independent replicates/condition, three measurements per timepoint. Error bars show the mean ± s.d. g, Exemplary images of HSV-1 GFP virus expression in sectioned infected and ACV treated organoids, immunostained with anti-GFP antibody. Infected (HSV-1 3dpi), ACV treated organoids (HSV-1 3dpi + ACV). Right panel: merged images, GFP (white), DAPI (blue). Scale bar - 500 µm. Representative image of three independent experiments (n=3 biological replicates). Source data
Extended Data Fig. 3
Extended Data Fig. 3. Acyclovir (ACV) treatment in control and HSV-1 infected organoids.
a, Exemplary images of HSV-1 GFP virus expression in sectioned infected and ACV treated organoids, immunostained with anti-GFP antibody. Infected (HSV-1 3dpi), ACV treated organoids (HSV-1 3dpi + ACV). Right panel: merged images, GFP (white), DAPI (blue). Scale bar - 500 µm. Representative image of three independent experiments (n=3 independent replicates). b, UMAP plots of single cell RNA-seq data in control organoids (left UMAP) and ACV treated control organoids (right UMAP). Colors are mapped to the clusters (annotated on the right). c, UMAP plots of cells colored by replicate (Rep.) from uninfected organoids (CTRL), 1 day and 3 days post infection (HSV-1 1,3 dpi), and acyclovir treated, 3 days post infection (dpi) organoids derived from induced Pluripotent Stem Cell (iPSC) line 1 (left) and iPSC line 2 (right panel), n=2 independent replicates/condition/iPSC line.
Extended Data Fig. 4
Extended Data Fig. 4. Cell-type specific responses in HSV-1 infected and Acyclovir (ACV) treated organoids.
a, Proportion of cell types in uninfected, infected(1, 3dpi) and ACV treated organoids derived from iPSC line 1 (upper) and iPSC line 2 (lower panel). b, Representative immunohistochemistry for mitotic marker (pVIM – white) and merged images for mitotic marker (pVIM - green), HSV-1 (GFP - white), nuclei (DAPI - blue) in uninfected (CTRL), 3 dpi infected (HSV-1) and ACV treated organoids. Scale bar - 100 µm. Representative image of three experiment (n=3 biological replicates). c, Viral gene expression heatmap showing log10 expression values of detected viral genes. Genes (rows) are ordered by decreasing overall expression and cells (columns) are ordered and both by condition and cluster assignment. Cells are coloured by Condition, Clusters and Viral load. Data from two independent iPSC lines, each with n=2 biological replicates. d, Barplot showing the proportion of cells from each infected condition assigned to each Highly infected cluster. e, Dotplot showing the expression of selected marker genes in each Highly infected cluster. Color indicates average, scaled expression values and dot size shows the percentage of expressing cells in each Highly infected cluster. f, Violin plot showing the viral load (% of viral transcripts, that is Unique Molecular Identifiers or UMI) in each Highly infected cluster. Each dot represents a cell. (All data derived from two independent iPSC lines, each n=2, biological replicates).
Extended Data Fig. 5
Extended Data Fig. 5. Viral infection induces inflammatory responses.
a, Dotplot showing the expression of detected genes from the ‘TNF-α signaling via NF-κB’ HALLMARK gene set. Color indicates average, SCT-normalized expression values and dot size shows the percentage of expressing cells in each cluster. Only highly infected clusters and clusters included in the differential gene expression and gene set enrichment analysis are shown. Data pooled from two independent iPSC lines, each n=2, biological replicates.
Extended Data Fig. 6
Extended Data Fig. 6. Acyclovir (ACV) treatment does not prevent inflammatory responses.
a, TNF-α pathway activity score in each condition: uninfected (CTRL), uninfected ACV treated (CTRL +ACV), HSV-1-infected (HSV-1 1dpi, HSV-1 3dpi), and 3 dpi HSV-1-infected ACV-treated (HSV-1 3dpi +ACV) organoids. Boxplot centers represent median values, while the boxplot bounds represent the 25% and 75% quantiles. Boxplot whiskers represent the 25% quantile −1.5× interquartile range (IQR) and the 75% quantile +1.5× IQR, respectively. Data from two independent iPSC lines, n=2, biological replicates/condition/iPSC line. b, UMAP plots of cells colored by the TNF pathway activity score in each cell and separated in uninfected organoids, 1 day and 3 days post infection (dpi), and acyclovir treated, 3 days post infection (dpi) organoids, with red and blue indicating increased and decreased score, respectively. Data from two independent iPSC lines, n=2, biological replicates/condition/iPSC line.
Extended Data Fig. 7
Extended Data Fig. 7. TNF ligands are upregulated upon infection.
a, Fold changes (Log2FoldChange) of gene expression between control (CTR) and infected organoids 3 days post infection (+HSV-1 3dpi) versus log10 normalized mean transcript counts (baseMean). HSV-1 transcripts (green) and TNF ligands (red) are highlighted. Significantly differentially expressed TNF ligands with a log2 fold change > 2.5 are labelled. Transcript counts were measured from two independent iPSC lines, n=3 biological replicates/condition/iPSC line (see Methods). b, TNF ligands induced upon infection are not downregulated by acyclovir treatment. Row-mean normalized expression of upregulated TNF ligands in scRNA-seq data (pseudo-bulk). Transcript counts are shown for 2 replicates per condition (group) and two cell lines (line). c, Exemplary images of Cleaved Caspase 3 and HSV-1 GFP virus expression in sectioned and immunostained organoids, uninfected (Mock) infected with HSV-1 (HSV-1 1dpi, HSV-1 3dpi) and ACV treated (HSV-1 3dpi+ACV). Right panel: merged images, Cleaved Caspase 3(red), GFP (white), DAPI (blue). Scale bar - 100 µm, n=3 biological replicates/condition.
Extended Data Fig. 8
Extended Data Fig. 8. Combinatorial treatment strategies for HSV-1- driven neuroinflammation.
a, Exemplary images of HSV-1 GFP virus expression in sectioned and anti-GFP antibody immunostained organoids. Uninfected (CTRL), infected (HSV-1), ACV treated organoids (ACV), ACV and CDDO-Me co-treated (ACV+CDDO-Me) and ACV and NEC-1 cotreated (ACV+NEC-1). Lower panel: merged images, GFP (white), DAPI (blue). Scale bar - 500 µm. Representative image of three independent experiments with two iPSC lines (n=3 biological replicates/condition/iPSC line). b, Scatterplots showing all comparisons between viral GFP RNA, measured as Delta Ct with respect to the human DICER1 gene in cDNA from whole organoids lysate, viral GFP gDNA, measured as before in genomic DNA from the same organoids, and viral GP protein, measured from Western blot densitometric analysis, normalized on GAPDH. All correlation coefficients (Pearson) are shown in the top left of each plot. Sample identity is indicated next to each dot, representing the mean between three biological replicates (n=3, biological replicates). c, Exemplary images of ZO-1 and HSV-1 GFP virus expression in sectioned and immunostained organoids, infected with high (MOI=1) and low (MOI=0,2) multiplicity of infection (MOI) of HSV-1. Lower panel: merged images, ZO-1(red), GFP (white), DAPI (blue). Scale bar - 100 µm. Representative image of three independent experiments with two iPSC lines. d, e, ZO-1 fluorescent signal quantification in sectioned and immunostained organoids infected with high (d) or low (e) multiplicity of infection (MOI) of HSV-1, each dot represents one neuroepithelial loop, colors indicated cell lines: iPSC line 1 (dark blue), iPSC line 2 (bright blue). Lower panel, p-values for the fluorescent signal quantification f, g HSV-1-GFP signal quantification in immunostained organoids infected with high (f) or low (g) multiplicity of infection (MOI) of HSV-1 virus, each dot represents one neuroepithelial loop, colors indicated cell lines. Lower panel: p-values (Benjamini-Hochberg-corrected pairwise Wilcoxon Mann Whitney test for the fluorescent signal quantification, n=14,34,32,17,23 individual neuroepithelial loops quantified from 3,5,6,4,4 individual organoids per condition for panels d and f, n=43,31,33,22,21,38,29 loops from 5,3,3,2,3,3,3 organoids for panels e and g, from two independent hiPSC lines and two MOIs. Boxplot show lower quartile, median and upper quartile, whiskers represent upper and lower quartile ± the smallest value within 1.5-fold of the interquartile range respectively. Source data
Extended Data Fig. 9
Extended Data Fig. 9. Combinatorial treatment reduces HSV-1- driven neuroinflammation.
a, Scatterplot showing the comparisons between viral GFP protein measured from Western blot densitometric analysis (normalized on GAPDH) or immunofluorescence (signal intensity minus background, see methods), in green for ‘low MOI’ infections and red for ‘high MOI’ infections. Western blot was performed on ‘low MOI’ only. Sample identity is indicated next to each dot, representing the mean between all biological replicates from Supplementary Fig. 5C–F (IF) and Fig. 6B (WB). b, Representative western blots analysis of STMN2 expression in uninfected (CTRL), infected (HSV-1), ACV treated organoids (HSV-1+ACV), CDDO-Me treated (HSV-1+ CDDO-Me), NEC-1 treated (HSV-1+ NEC-1), ACV and CDDO-Me co-treated (HSV-1+ACV+CDDO-Me); and ACV and NEC-1 cotreated (HSV-1+ACV+NEC-1). GAPDH serves as loading control and GFP indicates virus expression (lower panel). Number of replicates is shown in panel c. c, Semi-quantification of STMN2 (right panel) and GFP (left panel) protein expression by densitometry in uninfected (CTRL), infected (HSV-1), ACV treated organoids (+ACV), ACV and CDDO-Me cotreated (+ACV+CDDO-Me) and ACV and NEC-1 cotreated (+ACV+NEC-1). P-values are indicated for the relevant comparisons, according to Benjamini-Hochberg-corrected two-sided t-tests (n=4 biologically independent samples for CTRL, HSV1+CDDO-Me and HSV1+NEC-1, n=6 for all others, that is 4-6 batches of pooled organoids; color indicates cell line of origin).Bar plots and error bars shown ± s.e. Source data
Extended Data Fig. 10
Extended Data Fig. 10. Infected organoids release signaling molecules capable of NF-κB pathway activation independently from viral infection.
a, Exemplary western blots analysis of p-P65 expression in uninfected (MOCK), mock treated (ACV, CDDO-Me, NEC-1), infected (HSV-1), infected and treated (HSV-1+ACV, HSV-1+ CDDO-Me, HSV-1+ NEC-1) organoids. GAPDH – loading control and GFP -virus expression, n=3 independent experiments. b, Exemplary western blots analysis of p-P65 expression in uninfected (MOCK), infected (HSV-1), and organoids exposed to irradiated virus (HSV-1 IRR). GAPDH -loading control, GFP -virus expression (n=3 independent experiments). c, Exemplary western blots analysis of p-P65 expression in uninfected (MOCK) and HSV-1- WT virus (3dpi and 6dpi) or HSV-1-ICP27 mutant virus (3dpi and 6dpi) infected organoids. GAPDH – control, ICP0 - virus expression. n=3 independent experiments. d, e, Exemplary images of ZO-1 (d) and STMN2 (e) and HSV-1 ICP0 virus expression in: uninfected, mock treated organoids, and HSV-1- WT virus (3dpi) or HSV-1-ICP27 mutant virus (6dpi) infected organoids. Lower panel: merged images, ZO-1/STMN2 (green), ICP0 (white), DAPI (blue). Scale bar - 100 µm. Representative of more than three independent experiments. f, Exemplary western blots analysis of p-P65, pAKT, AKT, TRAF6, ERK1/2 expression in uninfected mock organoids, infected with HSV-1- WT virus and HSV-1-ICP27 mutant virus. GAPDH -loading control, ICP0 -virus expression, n=3 biological replicated. Samples were processed in parallel on several blots (see source data ED Fig. 10f). g, A scheme of experimental set-up. h, Exemplary images of HSV-1 GFP expression in infected organoids or organoids exposed to the medium (2x 0.1 µm filtered) collected from 3dpi infected organoids. i, Exemplary western blots analysis of p-P65 expression in uninfected mock (MOCK), HSV-1-GFP infected and organoids exposed to mock or infected organoid medium (MOCK medium, HSV-1 medium, respectively). GAPDH - loading control and GFP - virus expression (lower panel). j, Semi-quantification of p-P65 (right panel) and GFP (left panel) protein expression by densitometry in uninfected mock (MOCK), HSV-1-GFP infected and organoids exposed to mock or infected organoid medium (MOCK medium, HSV-1 medium, respectively). Data were normalized on the same sample in each batch. P-values are indicated according to Benjamini-Hochberg-corrected paired two-sided t-tests (n=4 biologically independent samples coming from n=3 batches of medium preparation, indicated by color). Barplots and error bars show mean ± s.e. Source data

References

    1. Thellman NM, Triezenberg SJ. Herpes simplex virus establishment, maintenance, and reactivation: in vitro modeling of latency. Pathogens. 2017;6:28. doi: 10.3390/pathogens6030028. - DOI - PMC - PubMed
    1. Marcocci ME, et al. Herpes simplex virus-1 in the brain: the dark side of a sneaky infection. Trends Microbiol. 2020;28:808–820. doi: 10.1016/j.tim.2020.03.003. - DOI - PubMed
    1. Piret J, Boivin G. Immunomodulatory strategies in herpes simplex virus encephalitis. Clin. Microbiol. Rev. 2020;33:e00105–e00119. doi: 10.1128/CMR.00105-19. - DOI - PMC - PubMed
    1. Rozenberg F. Herpes simplex virus and central nervous system infections: encephalitis, meningitis, myelitis. Virologie. 2020;24:283–294. doi: 10.1684/vir.2020.0862. - DOI - PubMed
    1. D’Aiuto, L. et al. Modeling herpes simplex virus 1 infections in human central nervous system neuronal cells using two- and three-dimensional cultures derived from induced pluripotent stem cells. J. Virol.10.1128/jvi.00111-19 (2019). - PMC - PubMed

Publication types

MeSH terms